

Abstract
People in low-lying coastal areas live under the great threat of damage due to coastal flooding from tropical cyclones. Understanding how coastal population settlements react to such events is of high importance for society to consider future adaptation strategies. Here we generate a new global hydrodynamic data set on tropical cyclone-generated storm surge flooding for the period 1851–2020. By combining this data with spatial data on human populations, we analyze the influence of the depth of storm surge flooding on the rural, urban, and total populations in low elevation coastal zones from 1941–2010. We find that in response to a one standard deviation increase in storm surge flooding depth (0.43 m), the exposed population in a  km low elevation coastal zone decreases by around 970 individuals on average per decade. This reduction corresponds to 9% of the average population living in an exposed grid cell. Tropical cyclone generated wind speed and rainfall do not influence the relocation of coastal populations. The majority of the threatened population lives in Eastern, South–Eastern, and Southern Asia. We show that the exposed coastal population appears to have adapted over time by reducing its exposure in recent decades. This finding applies to all regions other than North America, Oceania, and Western Asia.
Export citation and abstract BibTeX RIS

Original content from this work may be used under the terms of the Creative Commons Attribution 4.0 license. Any further distribution of this work must maintain attribution to the author(s) and the title of the work, journal citation and DOI.
Corrections were made to this article on 27 February 2024. A url in the Data availability statement was amended.
1. Introduction
The influence of nature on human settlements is immense. While a friendly and calm environment can lead to prosperity and growth, a hostile environment with frequent natural disasters can result in stagnation, collapse, and even death. In this regard, tropical cyclones are one of the most dangerous climatic events to pose a threat to the prosperous development of human societies. For instance, during the 1970–2019 period, these storms have caused deaths of up to 962 000 people and costs of nearly USD 1600 billion [1]. The main tropical cyclones' damage causes are high wind speeds, extreme precipitation, and storm surge, where particularly people in low elevation coastal zones (LECZ), which are defined as areas contiguous to the coastal shoreline up to 10 m above sea level [2], have the highest storm surge flooding risk [3]. In the future, sea level rise and the intensification of tropical cyclones through climate change, as well as rapid human-induced land subsidence are likely to further increase local exposure to storm surge [4–7], with accompanying cost estimates amounting to 1 trillion USD per year by 2050 [8].
The economic possibilities, transportation access, and recreational opportunities have made living near the coast attractive to humans [9–11]. This attraction may be so strong as to induce positive population growth even in multi-hazard coastal areas [10, 12]. Currently, around 634 million [2] to 1.4 billion [13] people are estimated to be living in coastal flooding zones, and this population is likely to grow in the future [8, 13, 14]. In principle, the decision to live in a high-risk area should depend on net expected gains, and this calculation is likely to be updated as new events occur [15]. However, there exists evidence that people systematically underestimate the losses of tail-risk climatic events [16]. Moreover, strong social and communal bonds [17] or a sufficient governmental support system [18] may deter affected individuals from moving, even after they have suffered considerable losses. Additionally, poor households sometimes do not have sufficient monetary means to move out of hazardous areas [19].
The literature investigating how damaging storm surge events affect local populations itself is rather mixed. For instance, sometimes it has been found that people move away after a damaging event [19, 20], while other studies have indicated that people prefer to stay and adapt or just move very nearby [17]. There are even findings that indicate that there is subsequent inward migration, in particular by poorer people [21, 22], following such events. However, the current evidence is arguably too limited in scope and context to draw broad conclusions about the likely adjustment behavior of the growing coastal population across the globe to the threat of storm surges, which is possibly becoming more frequent and/or intense with climate change. Firstly, the existing studies are generally limited to either specific storm surge events or specific areas. Secondly, they almost exclusively only cover a relatively recent period. In this study, we thus analyze how local populations in potentially hazardous areas respond to storm surges caused by tropical cyclones, at both a global level and a long historical context.
Since storm surge levels from tropical cyclones at the global level are hard to model, as of date no global comprehensive and consistent tropical cyclone-driven storm surge data set exists and is used in a global impact analysis. Rather most impact studies instead focus on wind effects [21, 23, 24], and a few also on precipitation damage [25]. Previous studies analyzing the exposure of coastal populations to coastal flooding have used extreme sea level data and combined these with climate change or socioeconomic scenarios [8, 26, 27]. However, such static statistical analyses are suited for risk assessment rather than for the causal identification of the relationship between storm surges and human settlement outcomes. Additionally, while there are historical observations of storm surges available, these are limited in time, space, and quality. For example, the widely used SURGEDAT data set comprises only 172 validated empirical observations since 1897 [28]. Recent advances in modeling storm surge damage are global re-analysis models such as GTSR [29] or GSSR [30] for wind speed and pressure with tidal inputs in a hydrodynamic model. Because of the coarse spatial and temporal resolution of the ERA-interim reanalysis input, approximately 75 km and 6 h respectively, the derived model outputs from, e.g. the GTSR model tend to underestimate the observed storm surge levels [29, 31]. Additionally, within the GTSR or GSSR data it is not possible to attribute coastal storm surge heights specifically to tropical cyclones.
The main contribution of this study is the development of the first global tropical cyclone-generated storm surge data set of all documented historical tropical cyclones in the IBTrACS data [32] and to use this data in a long-term analysis of exposed coastal settlements. This new data set not only covers a very long period (1851–2020), but also allows one to estimate storm surge water levels attributable to specific historical events. For almost all regions tropical cyclone data coverage starts in 1940 (see appendix figure S7). To be able to compare results across regions our sample therefore starts in 1940. The underlying hydrodynamic model combines data on bathymetry, tides, and tropical cyclone intensity and allows us to calculate 1-hourly coastal inundation maps at a resolution of 0.1∘ for all tropical cyclones recorded. We combine our storm surge damage data with local time-varying population data from the HYDE data set [33] which offers data in a ten-year time step until 2010.
By using a multivariate grid-cell-level-fixed-effects panel regression model at a resolution of 0.1∘, we analyze the responses of the populations in LECZ to storm surge flooding depth globally and regionally. We also investigate whether there are heterogeneous impacts of storm surge in terms of urban versus rural populations, as urban area infrastructure may be particularly vulnerable through impacts on drainage systems, electricity grids, and schools [34, 35]. Furthermore, urban poor people tend to be overexposed to flood damage while for rural populations abundant land in rural areas can reduce their exposure [36–38]. Similarly, agricultural production of rural households can serve as a safety net in case of a disaster [39] and can prevent households from moving away in less exposed regions. The dependency on natural resources for income generation can be, however, also a reason for rural households to stay in exposed areas. To further explore the role of agricultural productivity we distinguish local areas by their crop suitability. Finally, to see if there may have been any temporal adaptation in the population's response to storm surge flooding or if wealthier countries are more able to mitigate any migration effects, we also identify decadal and country income per capita differences in our estimates. Our analysis contributes to the debate on whether (long-term) adaptation to disasters is taking place, an issue especially urgent in light of climate change and its implications for the increasing coastal population numbers.
2. Data and methods
2.1. Data
The population data are constructed from the historic gridded population data of the History Database of the Global Environment (HYDE) data set version 3.2.1 [33], which provides global population maps for every 10 years from 1700 until 2000 and yearly data for the 2000–2015 period at a spatial resolution of 0.5 arc min. For the statistical analysis, decadal data from 1950–2010 for total, rural, and urban population counts measured in inhabitants per grid cell are utilized. 'Decadal' in our context means that the population data are observed as a snapshot at the end of every decade, e.g. in the years 1950, 1960,  , and 2010. To be consistent with the population observations before 2000 and their decadal nature we only use data until 2010. This also means that we are measuring effects over the relatively long run, i.e. relatively more permanent impacts. Tropical cyclone raw data come from the International Best Track Archive for Climate Stewardship (IBTrACS) v04r00 version [32]. When minimum sea level pressure observations are available for the storm track, but wind speed entries are missing, the latter are estimated by using the formula proposed by Atkinson and Holliday [40]. Missing pressure values are proxied with observed wind speeds using the method from Tan and Fang [41]. For the hydrodynamic model, bathymetry data from GEBCO 8.2 (www.gebco.net/data_and_products/gridded_bathymetry_data/version_20100927/), and the TPXO 7.2 Global Inverse Tidal Model [42] (https://journals.ametsoc.org/view/journals/atot/19/2/1520-0426_2002_019_0183_eimobo_2_0_co_2.xml) for the tidal conditions are used. LECZ are defined as land areas contiguous with the coastline up to 10 m above sea level using the Shuttle Radar Topography Mission elevation data [2, 43]. For the data used for crop suitability and income classes see appendix S1.
2.2. Storm surge model
To model historic storm surge flooding, the Delft3D FLOW model is used (see figure S3 for a summary of our modeling steps). The model runs at a spatial resolution of 0.1∘ and includes all global coastal zones 10 m above sea level and contiguous with the shoreline, which were exposed to tropical cyclone surges at least once in the past (1842–2020). Since we only want to consider damaging tropical cyclones in our model, we restrict it to tropical cyclones with a maximum raw track distance of 200 km to the exposed coasts. This corresponds to the 99th percentile of the observed radius of maximum wind speed in the IBTrACS data, where the impact of storm surge inundation is expected to be largest and most damaging [44]. For each tropical cyclone raw track, we calculate hourly pressure drop and wind fields of their observation time on a curve-linear spiderweb grid are constructed using the Holland model [45] as implemented in the Delft3D FLOW model. Next, three dimensional grids along the exposed coastlines are generated at a resolution of 0.1∘ for areas below 10 m of altitude. To ensure stable computation conditions, model time steps between 1.5 and 4 minutes are chosen, depending on the coastal area and bathymetry, to satisfy a Courant number being below 10. The simulation time for each tropical cyclone storm surge corresponds to its total observation raw data time span. The model calculates each tropical cyclone's storm surge-related water level (above sea level) for every hour of their observation time. The coastal inundation is constructed with the following specifications: the bottom depth of each grid cell is determined by the depth in its cell center, whereas for the depth values at the cell interfaces we take the minimum level of the bottom depth of two neighboring cell centers. From these hourly maps, the maximum water level per grid cell and per tropical cyclone is further considered. To not falsely overestimate the tidal component of the model, only coastal grids within a radius of 200 km around each tropical cyclone are selected. In a next step, the maximum storm surge flooding level per coastal grid cell i and year t is taken which we use as our main metric of storm surge flooding depth. The calculation of the metrics for wind speed and rainfall is described in appendix S1.
2.3. Regression analyses
To analyze the influence of past storm surge flooding depth on coastal populations, a multivariate grid-cell-level-fixed-effects panel data regression approach is employed. The sample is restricted to LECZ that lie within countries that have been exposed to at least one tropical cyclone over our sample period. Global coverage of landfalling tropical cyclones is approximately reached by 1940, and the last full decade of population data is observed in 2010. Since we are interested in the effect of storm surge on post-cyclone event population, i.e. ten years before we observe the population data, our sample covers the seven decades from 1950–2010 with the yearly tropical cyclone data starting in 1941. For a schematic overview of the data structure see appendix figure S4. In total, we are using data from 4826 distinct tropical cyclones. The level of analysis are the 48 344 exposed coastal zones' grid cells at a resolution of 0.1∘, which we observe globally over seven decades. This leaves us in total with 338 408 panel observations. As the main specification, the following linear panel fixed effects model is estimated:
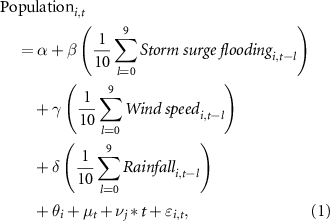
where  is the total, rural, or urban population count in year
 ![$t = [1950,\ldots,2010]$](https://content.cld.iop.org/journals/1748-9326/19/2/024016/revision4/erlad18dfieqn4.gif) in grid cell i.
in grid cell i.  (in m),
  (in (km h−1)3), and
  (in mm) are the decade means averaged over the yearly data from t − 9 to t in grid cell i. By using the means we consider both, the average intensity and frequency, of the tropical cyclones. Additionally, we include grid-specific fixed effects (θi
), decade fixed effects (µt
), and country j-specific linear time trends (
(in mm) are the decade means averaged over the yearly data from t − 9 to t in grid cell i. By using the means we consider both, the average intensity and frequency, of the tropical cyclones. Additionally, we include grid-specific fixed effects (θi
), decade fixed effects (µt
), and country j-specific linear time trends ( ). Standard errors are allowed to be correlated within tropical cyclone affected areas in a country and decade. Thus, they are clustered by affected grid cell × decade × country.
In an ideal setting, one would like to conduct an experiment with a clearly defined control and treatment group. These groups should have similar characteristics and differ only in their treatment status to establish a causal relationship. However, for many real-world research questions, such ideal experimental settings are not feasible. Thus, one has often to rely on quasi-experimental situations where people are selected 'by nature' into a treatment and control group. With our statistical approach we make use of such a quasi-experimental setting to establish causality. The occurrence and intensity of tropical cyclones can be considered random, given the complexity and unpredictability of processes such as storm surges, particularly at the local level [46]. It thus seems reasonable to assume a stable local distribution of storm surge during the sample period from which people at the local level, in our case a  km grid cell, are randomly exposed. By the inclusion of an indicator variable for each grid cell (the fixed effects θi
), we account for many observable and unobservable time-invariant differences between grid cells, such as geography, institutional background, or individual risk perceptions of a certain location. This helps to reduce the risk of omitted variable bias. Our estimator of interest, β, then captures the responses of the population with-in each grid cell over time. Therefore, the same grid cells are either randomly exposed (treatment group) or not exposed (control group) to storm surges.
km grid cell, are randomly exposed. By the inclusion of an indicator variable for each grid cell (the fixed effects θi
), we account for many observable and unobservable time-invariant differences between grid cells, such as geography, institutional background, or individual risk perceptions of a certain location. This helps to reduce the risk of omitted variable bias. Our estimator of interest, β, then captures the responses of the population with-in each grid cell over time. Therefore, the same grid cells are either randomly exposed (treatment group) or not exposed (control group) to storm surges.
To control for events common to all grid cells within each specific decade—such as an exceptional tropical cyclone season or a global pandemic—we include decade fixed effects, µt
, to our model. Additionally, we introduce country j-specific linear time trends,  , which account for changing patterns over time within individual countries. These patterns might include changes in the population growth rate, improvements in coastal protection leading to decreased vulnerability, or shifts in climate patterns. In summary, our reduced panel model allows us to control for many observable and unobservable variables, both time-variant and time-invariant without making many assumptions. The inherent randomness of the captured storm surge shocks provides strong exogenous identification properties, enabling us to establish a presumptive causal relationship [47].
One concern for the causal identification is the role of local mitigation measures that could improve the coastal protection and potentially lead to less population resettlement. Since our measure of storm surge flooding, however, is based solely on the physical characteristics of tropical cyclones and the relevant, pre-determined, and time-invariant geographic characteristics of the location, it thus does not rely on any possible human induced local mitigation measures. This does not mean that human induced mitigation matters do not play a role in the estimated impact of storm surge on local populations, but rather that under the above stated assumptions our model still could capture the average storm surge effect across potentially different degrees of such mitigation factors within our sample. Additionally, we try to capture changes in local protection measures by the inclusion of different location-specific time trends.
Another remaining confounding factor that might render estimates on  non-causal could be that other climatic factors, such as temperature, might be correlated with storm surge and affect local population [48, 49]. This potential influence is accounted for by including data on temperature in a robustness test (see table S23). A further possible violation of the identifying assumption could be that the distribution of local storm surge is time-varying rather than time-invariant, and that local populations are aware of this and adjust their expectation regarding the local distribution of storm surge accordingly. However, arguably this is unlikely to be a realistic concern, as any sort of tropical storm signal is only likely to emerge with climate change over the very long run [50]. More generally, while we are reasonably confident that we are capturing the causal effect of storm surges on population changes, this does not imply that there are no other, potentially more important driving factors of population movements, but rather that these would not be systematically correlated with storm surges. It could nevertheless be that by pure chance other local changes coincidentally took place in the same decades as storm surge damage and hence are partially driving any estimated impact. To eliminate this possibility, we conducted a Fisher randomization test, where storm surge observations are randomly reshuffled between decades (see figure S20). It shows that we do not find our effect to be likely by chance but rather systematically related to storm surges. In appendix S1 we show that our results hold for many different robustness tests.
To analyze heterogeneous responses by decade, agricultural crop suitability, and income level, we introduce an interaction term with  . Appendix S1 describes this statistical approach in greater detail. Furthermore, tables S33–S42 show summary statistics for all variables used, both globally and differentiated by nine world regions.
3. Exposure and populations development
Figure 1 displays the average modeled inundation levels along the coast for the years 1940–2010, computed from our storm surge model. The average water levels range between 0 m and 4.59 m. The regions of South–Eastern Africa, Eastern Asia, and Oceania experience the highest levels of storm-surge-related flooding on average, with mean water levels in exposed LECZ of 0.16 m, 0.12 m, and 0.09 m, respectively. The least exposed regions are Europe (0.008 m), Western Asia (0.02 m), and North America (0.04 m). At the country level, the most exposed countries are South Korea (1.07 m), Madagascar (0.88 m), and Hong Kong (0.74 m) (see figures S8–S17).
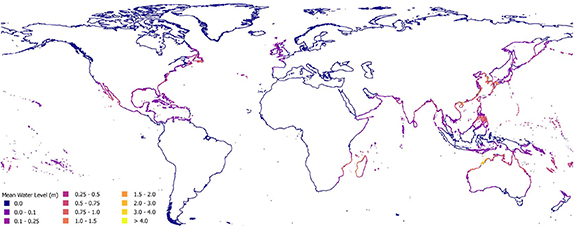
Figure 1. Average storm surge levels induced by tropical cyclones, 1940–2010.
Download figure:
Standard image High-resolution imageFigure 2 depicts the regional developments of population for LECZ exposed (orange solid line) and not exposed (purple dash-dotted line) to storm surge flooding over the decades 1950–2010. In all regions, fewer people live in exposed LECZ than in non-exposed ones. Moreover, in most exposed localities the population growth rate is lower compared to non-exposed LECZ, particularly in more recent decades. If one compares the population development in LECZ to those living in other areas (figure S5), one discovers that, since 1970 in Oceania more individuals live in LECZ, but, as figure 2 demonstrates, an increasing number of these inhabit unexposed LECZ.
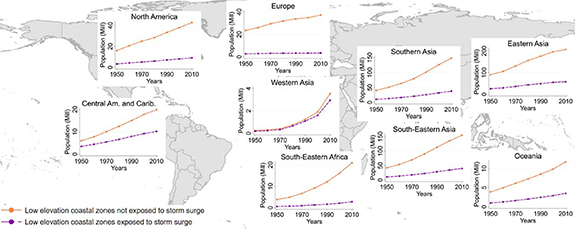
Figure 2. Population count for low elevation coastal zones exposed and not exposed to storm surge flooding, 1950–2010.
Download figure:
Standard image High-resolution imageFigure 3 illustrates how many people are still living in exposed areas in 2010, classified by region. Panels (a)–(c) display the distribution of total population across nine world regions for different levels of past exposure. Column 1 of panel a indicates that most people with more than one past storm surge event of any height live in Eastern Asia (59.3 million). A comparison of panels (a)–(c) reveals a consistent trend: the greater the past exposure, the fewer people live in these areas. Additionally, figure 3 reveals that the majority of threatened population lives in Eastern, South–Eastern, and Southern Asia. Across all exposure levels, these regions account for at least 83% of the population exposed globally. Furthermore, appendix figure S6 shows the population responses after storm surge for selected grid cells. In general, storm surge flooding led to a reduction of local population count in the grid cells. Of course, these subjectively chosen examples require a systematic statistical analysis to demonstrate that the observed relationship is robust. This is the purpose of the next section.
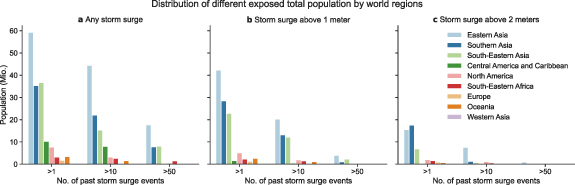
Figure 3. Storm surge exposed population in 2010.
Download figure:
Standard image High-resolution image4. Statistical analysis
Using panel data from 1941–2010, with a resolution of 0.1∘ for LECZ in 80 storm surge-exposed countries, this study examines the effect of storm surge flooding depth on local total, rural, and urban population counts through a multivariate fixed-effects panel regression model. Figure 4 shows the results for the main sources of tropical cyclone damage—storm surge, wind speed, and rainfall—for the global sample for our sample period, interpretable in terms of a one standard deviation increase. If storm surge flooding rises by one standard deviation (0.4337 m), there is a decrease of  people living in an exposed area per decade. Compared to the average population living in an exposed low elevation grid cell (11 038), this constitutes a 9% reduction per decade. This average effect seems to be driven by people who inhabit exposed urban areas (
 , panel (c)), while for rural populations the effect amounts to a reduction of
  (panel (b)). It becomes also clear that only storm surge flooding has a significant negative influence on any kind of population count, while wind speed and rainfall do not play a role in terms of conventional significance levels.
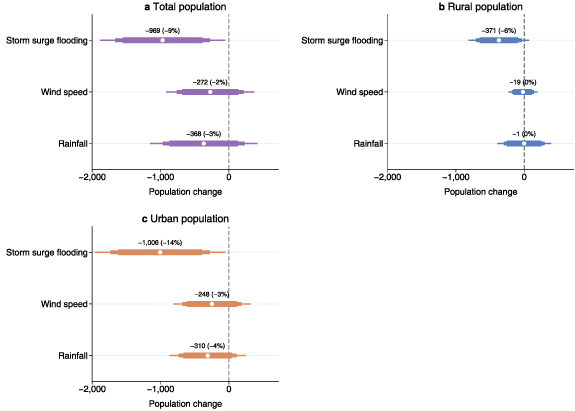
Figure 4. Effects of a one standard deviation increase in storm surge flooding depth, wind speed, and rainfall on the global total, rural, or urban population count.
Download figure:
Standard image High-resolution imageFigure 5 displays heterogeneous effects of storm surge flooding over time and for different subgroups. Panels (a)–(c) depict the average effects per decade compared to 1950 for the total, rural, and urban populations, respectively, with the implied percentage impact relative to the population mean in a LECZ grid-cell given in parentheses. While for the total population in 1960 more of the population ( ) lived in exposed areas after storm surge flooding, for every subsequent decade the coefficients become increasingly negative, and significantly so in 1990 (
 ), 2000 (
 ) and 2010 (
 ). Comparing these absolute coefficients with their respective decadal means (given in parentheses) also reveals a decrease in recent decades. Note that in all specifications our estimated effects are net of the country-specific linear trends, which account for country-specific factors such as population growth. People living in urban areas (panel (c)) have also reduced their exposure in recent decades. For rural areas (panel (b)) the qualitative pattern is analogous, but it is less pronounced. Panel (d), which plots the average effect of storm surge flooding depth for different levels of local agricultural crop suitability, shows that for areas with low and middle levels of crop suitability, there is a negative effect for both urban and rural populations. However, strictly speaking, one cannot make any causal inference from this result since crop suitability may be correlated with other local factors that drive parameter heterogeneity. Panel (e) displays the heterogeneous treatment effects for World Bank income classes. It shows that the higher the income level of a country the more negatively pronounced is the resettlement effect for urban people. Conversely, the impact on rural populations is less clear—only those in lower–middle-income countries exhibit a significantly negative response.
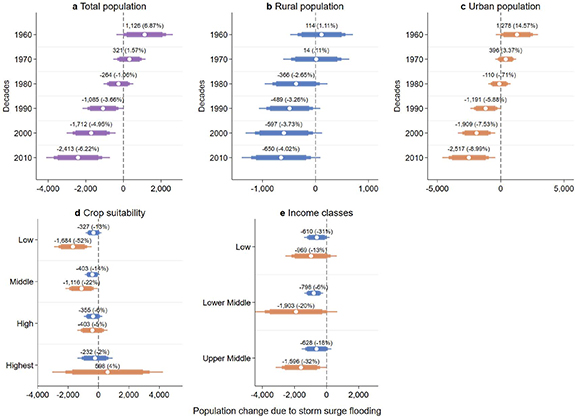
Figure 5. Heterogeneous effects of a one standard deviation increase in storm surge flooding depth on the global total, rural, or urban population count.
Download figure:
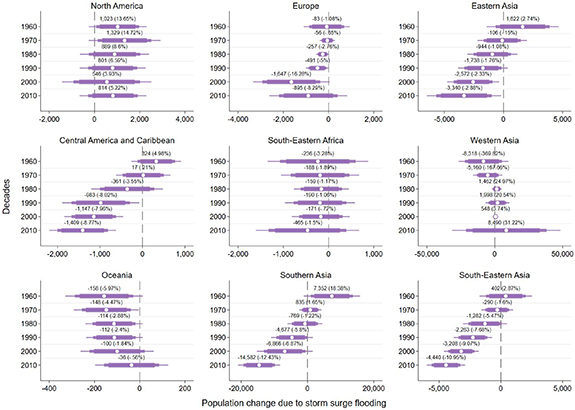
Standard image High-resolution imageFigure 6 depicts the regional responses of the total population to storm surge flooding per decade compared to 1950. Most exposed regions exhibit a trend moving from positive to increasing negative coefficients in recent decades. However, this behavior cannot be detected for North America, Oceania, and Western Asia. For Oceania, there is a small but increasing pattern over time, as is true for Western Asia. In North America the coefficients always stay positive. Again, the urban population effect per decade mimics the effect of storm surge flooding on the total population (figure S19). This is not true for rural populations (figure S18), where a decreasing pattern with negative responses can only be found for South–Eastern Africa, Southern, South–Eastern, and Western Asia.
Figure 6. Effects of a one standard deviation increase in storm surge flooding depth per decade on the total population count for different world regions.
Download figure:
Standard image High-resolution image
5. Discussion
This is the first study to utilize historical tropical storm data, population exposure, and a global storm surge model to investigate what role exposure to storm surge flooding has played in the distribution of populations along the world's coasts. The regression analysis employed allows one to systematically link the changes observed in terms of storm surge events and coastal population counts. Overall, more intense storm surge flooding has globally led to a reduction of the population in the LECZ, where a one standard deviation increase in storm surge flooding depth leads to a 9% reduction in the total population per exposed  km grid and decade. This finding contrasts with many previous studies, which found evidence of no migration [12, 51], no permanent migration [52, 53], or even net-positive migration [10, 54] in response to flooding. The results here appear to be for the most part driven by people living in urban areas, potentially due to their greater financial capacity to relocate compared to rural residents whose income depends on local natural resources [9]. In fact, we show that in (currently) richer countries the net reduction in urban population is larger than in their poorer counterparts. This result may be because richer individuals are more mobile than poorer ones, a feature that has been, for instance, observed in the United States after hurricanes [21]. Additionally, poor populations are sometimes trapped by natural disasters, as they are more vulnerable and have fewer financial resources to move [55]. This finding could also be explained by the cheaper housing costs inducing these people to move to more dangerous areas [22].
The data set's panel structure employed here enabled the decomposition of the estimated effect over time, suggesting that overall, there has been a slowly evolving structural change in the response of populations to storm surge events. While in earlier decades storm surge events led to a net increase in population numbers, over time this has reversed into a net fall. Possible reasons for the earlier rise may be that the damage due to storm surge induced creative destruction [56] in that it induced new opportunities for growing industries such as manufacturing, tourism, and transportation [57] and hence net population growth. The fall of exposed populations in recent decades after damaging storm surge events is encouraging, as it suggests that coastal populations are, on average, adapting to this recurring threat and relocate. This finding is most likely not driven by increases in mortality or decreases in birth rates since other studies find a fall in storm surge-related deaths in recent years [25, 58], and the effect on birth rates to be small and not last very long [59].
There are notable differences in the findings across regions. While most regions on average saw their populations in LECZ reduced over the decades, Oceania's and Western Asia's populations responded increasingly positively, with North America maintaining a consistently positive, though insignificant, effect. This trend in North America is not unexpected, considering that much of its coastal population growth can be attributed to improvements in productivity and quality of life [60]. In Western Asia, the preference for coastal living may be influenced by the comparatively milder climate, as opposed to the dry hinterland [61]. As most areas in Oceania consist of small islands and people heavily depend on coastal and oceanic fishing [62], people may have limited choice to live in areas other than LECZ. However, as shown, the population in Oceania has instead in part shifted to unexposed LECZ.
The analysis is limited by the non-consideration of the role of protection measures in the storm surge model, which could be artificial, such as dykes, or natural, such as mangroves and coral reefs. Therefore, one is likely overestimating storm surge exposure in high income countries [63]. Furthermore, protection measures could influence the re-location behavior of the local population. Since we do not observe them directly, we instead assume that they develop linearly over time within broader administrative areas. As table S26 shows, the inclusion of administrative level 2-specific time trends does not change our main results. Simultaneously, as sea level rise or human-induced land subsidence is also not considered, there may be a tendency to underestimate the experienced storm surge threat [64]. Furthermore, employing a finer and more flexible grid [29, 31], considering river flows and deltas [65], and using more precise elevation data, such as CoastalDEM [66], could improve the precision of the storm surge model output. Additionally, our model only considers the mean storm surge flooding depth, but future research would benefit from different exposure metrics that consider for example the length or area of flooding. Another limitation of our study is that the HYDE data set for the population count variables is a combination of different historic databases to generate an internally consistent spatial population data set over a long time series. It is therefore prone to measurement error.
Importantly, the available data do not allow us to explicitly disentangle the mechanisms that drive local populations to move away after their location is flooded by a storm surge. However, several studies offer insights into potential channels. For instance, in the United Kingdom, coastal flooding often results in declining house prices, likely due to an anticipated increase in future flooding risks [67]. A study in Indonesia finds that coastal inundation leads to an increase in poverty due to subsequent loss of employment and required repair costs [17]. Finally, in Puerto Rico after Hurricane Maria in 2017, storm surge caused considerable damage to critical infrastructure (water, electric, and public schools) leading to migration of the affected population [20]. Arguably, any such effects, i.e. higher perception of risk, personal income losses, or damage to local infrastructure, could lead populations to move away from storm surge affected areas. Future data collection will hopefully allow researchers to directly link these factors to post storm surge migration.
Overall, the findings suggest that populations show adaptive behavior, at least for some regions in modern times. If, as has been predicted, climate change leads to more intense, and possibly more frequent, storm surge events following tropical cyclones [68], then one should expect the share of the population in exposed LECZ to decline. While this can be a valid adaptation strategy of the local population to external environmental factors, it can also cause pressure on nearby areas and countries, potentially leading to a higher conflict risk [69]. Projected sea level rise [66] and future population growth, especially in Asia [8], could very well offset or even outweigh this decline. This indicates a need to take further steps to protect coastal populations and/or to help them cope with the negative consequences of storm surges. The construction of dykes may be an easy to implement protection measure for most countries [70], but may not be feasible everywhere [63]. Thus, alternatives, like protecting coastal environments such as coral reefs and mangroves [71] or increasing the hazard awareness of the population [72], should be considered. Additionally, a functional governmental response to tropical cyclone events and a high level of social capital in the coastal communities can also dampen the negative effects of storm surge flooding and thereby reduce the need to relocate. The results here serve as a first step to quantify the responses of coastal populations to storm surge damage. Policymakers could use these findings as a starting point for cost-benefit analyses, but for formulating effective mitigation policies the underlying mechanisms should be further researched.
Acknowledgments
We are grateful to Axel Dreher, Andrew Hultgren, and Leonie Wenz for their valuable feedback. We also thank participants from several conferences and workshops, including: the 6th World Congress of Environmental and Resource Economists 2018 at the University of Gothenburg, the Global Policy Lab at UC Berkeley, the Summer Conference of the Association of Environmental and Resource Economists (AERE) 2019 in Lake Tahoe, the Econometric Models of Climate Change Conference 2019 at the University of Milano-Bicocca, the Congress 'Extreme Events: Building Climate Resilient Societies' of the Volkswagen Foundation in Hanover, the 2021 Workshop on Compound Weather and Climate Events at University of Bern, the Stakeholder Workshop Quantifying the Short- and Long-Term Socioeconomic Impacts of Extreme Weather Events 2022 at the Potsdam Institute for Climate Impact Research (PIK), and the 28th Annual Conference of the European Association of Environmental and Resource Economists 2023 in Limassol. In addition, we would like to express our gratitude to Tim Deisemann, Theresa Geyer, and Tobias Hellmundt for their exemplary research assistance.
Data availability statement
All data and codes to replicate the main results of this article are available under the repository https://zenodo.org/records/10417500.
Supplementary data (5.8 MB PDF)