

Abstract
Drylands are the world's largest biome and dominate the trends and interannual variability of global carbon sinks. Although a 'greening' trend of global drylands has been widely reported, large uncertainties remain in attributing its drivers. It is increasingly emphasized that elevated CO2 has greatly contributed to the vegetation greening over global drylands. Here we quantified the contributions of climate change, elevated CO2, and land use and land cover change (LULCC) on leaf area index (LAI) over drylands, using a process-based land surface model Noah-MP to investigate the drivers of vegetation change. The state-of-the-art model shows better performance in simulating the interannual variability of satellite-observed LAI over global drylands compared with that of the multi-model ensemble mean LAI from the TRENDY results. The area that LAI changes dominated by climate change (44.03%) is three times greater than that by CO2 (13.89%), and climate change also contributes most to the global drylands greening trend (55.07%). LULCC shows regional dominance over 13.35% of the global drylands, which is associated with afforestation, woody plant encroachment, and agricultural intensification. Our results imply that the vegetation greening area driven by elevated CO2 is much limited relative to the overwhelming climatic driving, which should be considered in predictions of trends and interannual variations of global carbon sinks.
Export citation and abstract BibTeX RIS

Original content from this work may be used under the terms of the Creative Commons Attribution 4.0 license. Any further distribution of this work must maintain attribution to the author(s) and the title of the work, journal citation and DOI.
1. Introduction
Drylands (dry subhumid, arid, semiarid and hyperarid ecosystems) cover ∼45% of the land surfaces (Prăvălie 2016, IPCC 2019) and are home to 3 billion people (IPCC 2019). In addition, drylands are the world's largest biome (Schimel 2010) and contribute to approximately 40% of the global net primary productivity (Grace et al 2006, Wang et al 2012). The semiarid ecosystems, particularly, dominate the trends and interannual variability of global carbon sinks (Poulter et al 2014, Ahlström et al 2015). Drylands are particularly sensitive to climate changes and land degradation (Reynolds et al 2007) due to low water availability and soil fertility, since dryland organisms are already living at their physiological limits and may have significant nonlinear responses to subtle climatic changes (Cable and Huxman 2004, Potts et al 2006, Reed et al 2012, Vale and Brito 2015); furthermore, dryland soils are coarse-textured and contain small amounts of organic matter (Lal 2004, Ravi et al 2010). They are quickly affected by the tillage, grazing and severe climatic conditions (Reynolds et al 2007, Ravi et al 2010). Dryland vegetation provides essential ecosystem services including carbon sequestration and food production (D'Odorico et al 2013). Its changes are mainly driven by the biogeochemical factors and land use and land cover change (LULCC) (Zhu et al 2016, Song et al 2018). Therefore, improving our understanding of this vulnerable ecosystem and mechanism of its change is a top priority for sustainable drylands management.
Previous studies based on satellite records suggested a greening trend of drylands (Herrmann et al 2005, Helldén and Tottrup 2008, Fensholt et al 2012) despite the warming and drying climate (Dai 2013, Chang et al 2020). To date, only limited study has focused on attributing the drivers of vegetation dynamics over global drylands and the drivers are still uncertain. Dryland ecosystems are characterized by limited water availability, and thus the vegetation dynamics is extremely sensitive to water (Poulter et al 2014, Zhang et al 2022). Previous studies based on statistical methods believed that the precipitation was the most important factor affecting vegetation change (Fensholt et al 2012, He et al 2019). However, at global scale, the CO2 fertilization effect has been identified as a dominant factor for the greening of drylands (Burrell et al 2020) and global continents (Zhu et al 2016). Enhanced plant water use efficiency with the higher concentrations of CO2 (Donohue et al 2013, Driscoll et al 2020) and woody plant encroachment (WPE) in grasslands and savannas worldwide (Deng et al 2021) have been increasingly emphasized to contribute to the greening. In addition, the fire regimes (Hantson et al 2021), agricultural and grazing activities (Chen et al 2019), reforestation and deforestation (Erb et al 2018) also contribute to the vegetation changes, making it challenging to disentangle the effects of climate change, CO2, and LULCC on the vegetation change. In order to accurately predict trends and interannual variations of global carbon sinks under projected increasing drought frequency and severity (Dai 2013) for drylands, it is urgent to investigate the main drivers of the vegetation change.
In the study, we use the state-of-the-art Noah-MP land surface model (LSM) (Niu et al 2011) to discern the drivers of leaf area index (LAI) trends over global drylands during 2000–2019. The Noah-MP is augmented with a representation of dynamic root water uptake (Niu et al 2020) (Materials and Methods). Here we first evaluate the Noah-MP performance in simulating the trends and interannual variations against the satellite LAI data sets over global drylands and selected regions. We then conduct various model experiments to disentangle dominant drivers of the LAI changes including CO2, climate change, and LULCC, and we verify our results against existing regional studies to support our conclusions.
2. Materials and methods
2.1. Global data products
We use the average of three satellite-observed LAI records (reprocessed Moderate-resolution imaging spectroradiometer (MODIS), Global Land Surface Satellite (GLASS) and GLOBMAP LAI data sets) to analyze the changes in vegetation over drylands during the period of 2000–2019. The reprocessed MODIS version 6 LAI products (Myneni et al 2015, Yuan et al 2020) based on two-step integrated method (Yuan et al 2011) perform much better than the original product (Yuan et al 2011, 2020). The GLASS LAI product (Version 6) (Ma and Liang 2022) was derived from MODIS surface reflectance data using the bidirectional long short-term memory model. The missing data of the GLASS LAI for January and February 2000 was substituted by the monthly climatology of LAI during 2000–2019. The GLOBMAP LAI (Version 3) (Liu et al 2012) was made up by combination of AVHRR LAI (1981–2000) and MODIS LAI (2000–2020). The MODIS LAI series was generated from MODIS C6 land surface reflectance data. The reprocessed MODIS, GLASS, and GLOBMAP LAI data were interpolated to 1° spatial resolution based on the linear interpolation method to match the spatial resolution of the Global Land Data Assimilation System (GLDAS) 2.1 forcing data (Rodell et al 2004).
In this study, we use GLDAS2.1 atmospheric forcing fields to drive the Noah-MP. We use the global 1 km hybrid State Soil Geographic Database and the United States Geological Survey (USGS) 24–category vegetation data to determine the soil and vegetation parameters, respectively. Both the 1 km data sets are aggregated to 1° with the dominant soil and vegetation types to match the spatial resolution of the GLDAS2.1 forcing data. The soil and vegetation parameters are then determined for each soil type and vegetation type through the look-up tables of Noah-MP.
To compare the performance of Noah-MP and dynamic global vegetation models (DGVMs) to simulate the interannual variations and trends in LAI, we used outputs from S3 experiment of 13 DGVMs from TRENDYv10 datasets (Friedlingstein et al 2022), including CABLE-POP, CLM5.0, IBIS, ISAM, ISBA-CTRIP, LPJ-GUESS, LPX-Bern, OCN, ORCHIDEE, ORCHIDEEv3, SDGVM, VISIT and YIBs. For the comparison with satellite-observed and Noah-MP modeled LAI, LAI simulation of CLM5.0, ISAM, LPJ-GUESS, LPX-Bern, ORCHIDEE, ORCHIDEEv3, SDGVM and VISIT was regridded to 1° using linear interpolation method.
2.2. The Noah-MP LSM
All the model experiments were conducted with the Noah-MP LSM (Niu et al 2020). The model describes the carbon, energy and water flux exchanges between the land surface and the atmosphere controlled by terrestrial ecohydrological processes and the corresponding storage terms. Noah-MP include a short-term dynamic model to predict LAI, which is converted from the predicted leaf carbon mass controlled by carbon allocation of the assimilated carbon, through photosynthesis of sunlit and shaded leaves, maintenance and growth respirations, leaf turnover and death due to water and temperature stresses (Niu et al 2011). Noah-MP explicitly represents plant water storage supplied by dynamic root water uptake through hydrotropic root growth to meet the transpiration demand (Niu et al 2020). It allows more carbon translocation to roots when the plants are under water stress and represents root hydrotropism through more carbon translocation to roots but less turnover in wetter soil layers. The model improved the resilience of plants to droughts by using the water in shallow soil and groundwater through capillary rise. In this study, we drive the model at 1° spatial resolution and 3 hour time step from 2000 to 2019 over global drylands with a spin-up of 5 loops. The model physical options are listed in table 1.
Table 1. Noah-MP options used in the simulation.
| Noah-MP options | The option used in simulations | |
|---|---|---|
| Dynamic vegetation | DVEG = 2 | Dynamic vegetation on |
| Canopy stomatal resistance | OPT_CRS = 1 | Ball-Berry type |
| Moisture factor for stomatal resistance | OPT_BTR = 1 | Plant water storage control |
| Runoff and groundwater | OPT_RUN = 1 | TOPMODEL with groundwater |
| Surface layer exchange coefficient | OPT_SFC = 1 | Monin-Obukhov similarity theory |
| Super cooled liquid water | OPT_FRZ = 1 | No iteration |
| Frozen soil permeability | OPT_INF = 1 | Linear effects of frozen soil |
| Radiation transfer | OPT_RAD = 1 | Modified two-stream |
| Ground snow surface albedo | OPT_ALB = 2 | CLASS type |
| Precipitation partitioning | OPT_SNF = 4 | Nonlinear function of wet bulb temperature |
| Lower boundary condition of soil temperature | OPT_TBOT = 2 | Soil bottom temperature read from a table |
| Snow/soil temperature time scheme | OPT_STC = 1 | Semi-implicit |
| Soil carbon model | OPT_SCM = 3 | Six carbon pool model |
2.3. Determining the impact of driving factors to the LAI trends
To determine the relative contributions of the driving factors to the LAI trends, we conducted three experiments using Noah-MP to quantify the relative contribution of climate change, CO2, and LULCC to the LAI trends. The first experiment was forced by the 3-hourly GLDAS2.1 climatic forcing data during 2000–2019 and varying atmospheric CO2 (hereafter 'ALL'). The second experiment was forced by the same varying atmospheric CO2 but 3-hourly climatology of climatic forcing during 2000–2019 (simulation 'CO2'). The third experiment was forced by the GLDAS2.1 climatic forcing data during 2000–2019 but with a constant CO2 concentration at the level of year 2000 (hereafter 'CLI'). The difference between ALL and CO2 (ALL–CO2) and that between ALL and CLI (ALL–CLI) were used to evaluate the contribution of climate change and CO2 to LAI trends, respectively. Since the Noah-MP does not incorporate modules that account for the effects of LULCC on LAI, the difference between satellite-based LAI trends and modeled LAI trends from experiment 'ALL' was then explained as the contributions of LULCC.
2.4. Growing season and extent of drylands
Our study focuses on vegetation dynamics during the 'growing season', when the surface air temperature (based on the GLDAS2.1 monthly climatology between 2000 and 2019) is greater than 0 °C for both the satellite-observed and modeled LAI. Potential evapotranspiration was firstly calculated with the Penman–Monteith equation (Allen et al 1998) and the GLDAS2.1 forcing data from 2000 to 2019. Aridity index (AI) was then computed as the ratio of mean annual precipitation to mean annual potential evapotranspiration. Drylands are defined as where AI < 0.65 (Middleton and Thomas 1997, Huang et al 2015, Berg and McColl 2021), which include dry subhumid, semi-arid, arid and hyperarid regions (figure 1(a)). Besides, bare ground and water bodies represented by the USGS vegetation data, and areas without vegetation cover represented by the satellite-observed and modeled LAI are not included in the study. The vegetation types of the study area are shown in figure 1(b).
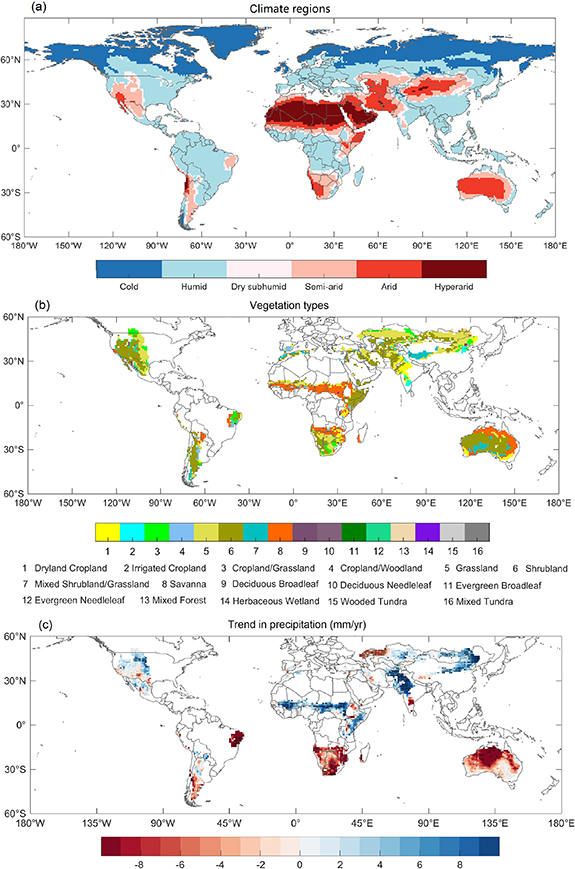
Figure 1. Spatial distribution of climate regions classified by aridity index using GLDAS2.1 data during 2000–2019 (a), the USGS vegetation types (b) and GLDAS2.1 precipitation trends from 2000 to 2019 (c) over drylands. Regions labeled by dots in (c) indicates regions where the trends that are statistically significant (p < 0.05).
Download figure:
Standard image High-resolution image2.5. Statistical method
We used a non-parametric Mann–Kendall method to determine the linear trends in the precipitation and the growing season LAI for both the satellite-based and modeled LAI at the 95% significance level. We used the Pearson correlation coefficient to evaluate the correlation between variables. When calculating the area, we took into account the changing grid box size with latitude. To calculate the mean LAI over dryland and the 12 selected regions, we used a spatially weighted mean.
3. Results and discussion
3.1. LAI changes in global drylands
Our results show that global drylands cover ∼40% of the global land area, and the extent is similar to the findings of Feng and Fu (2013), Burrell et al (2020), and Berg and McColl (2021). It was reported that global drylands have expanded towards the north of the 60° N parallel and cover ∼45% of the Earth's terrestrial area (Huang et al 2015, Prăvălie 2016). Due to the uncertainty of the GLDAS2.1 data, this characteristic is not captured by our method.
The LAI linear trends derived from the average of the three satellite LAI data sets show positive values ('greening') over a large portion of the drylands (71.72%) during the period of 2000–2019 (figure 2(a)). Globally, 29.47% of the drylands show a significant greening trend (p <0.05) including the southwestern North America, southern South America, Sahel, Middle East, southern and eastern Central Asia, South Asia, Tibet Plateau, Mongolia, and Northern China. The satellite-based LAI shows a significant decreasing trend (p < 0.05) over only 2.94% of the drylands. About 67.59% of the drylands have no significant (p <0.05) change from 2000 to 2019. It is worth noting that the satellite-based LAI shows a decreasing trend ('browning') spreading over the eastern South America, southern Africa, northwestern Central Asia and northwestern Australia; though the trend is not significant at 95%.
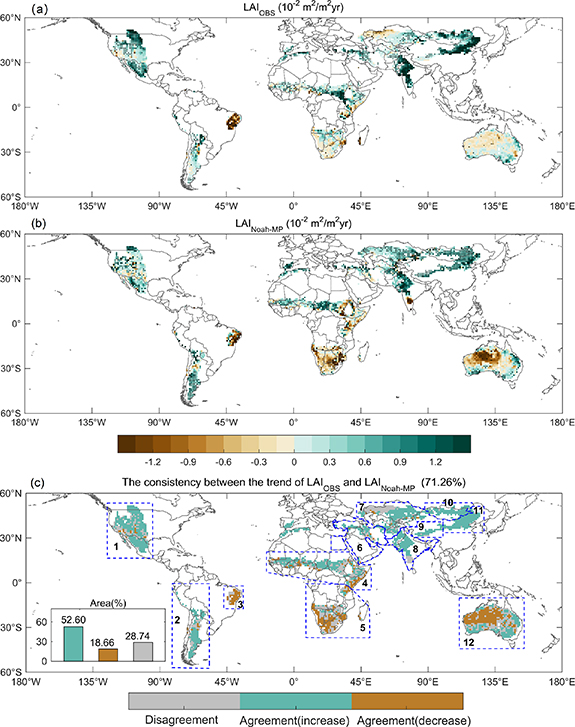
Figure 2. Satellite-observed and Noah-MP modeled LAI trends and their consistency. Linear trends of (a) the average of the three satellite-observed LAI data sets (LAIOBS, 10−2 m2 m−2 yr−1) and (b) Noah-MP modeled (LAINoah-MP, 10−2m2 m−2 yr−1) growing season LAI from 2000 to 2019. Regions labeled by dots indicates regions where the trends are statistically significant (p < 0.05). (c) The consistency between the satellite-observed and Noah-MP modeled growing season LAI trends. Regions with consistent increasing and decreasing trends are masked in green and brown, respectively, while regions with inconsistent trends are masked in gray. Also included in (c) are 12 selected regions labeled by blue boxes for regional analysis: 1, southwestern North America; 2, southern South America; 3, eastern South America; 4, Sahel and eastern Africa; 5, southern Africa; 6, Middle East; 7, central Asia; 8, south Asia; 9, Tibet Plateau; 10, Mongolia; 11, northern China; 12, Australia.
Download figure:
Standard image High-resolution imageThe Noah-MP (experiment ALL) with a representation of hydrotropic root has an excellent performance in simulating the spatial patterns of LAI trend (figure 2(b)). Overall, the LAI trends modeled by Noah-MP agree with those of satellite observations over 71.26% of the drylands (52.60% for greening and 18.66% for browning). The disagreement between Noah-MP and satellite observations accounts for 28.74% of the drylands (figure 2(c)), which spreads over the southwestern United States, a large part of the southern Africa, northwestern Central Asia, southern India, a few areas of south central and east central Australia. The LAI trends modeled by Noah-MP and the multi-model ensemble mean (MMEM) LAI trends of DGVMs in the TRENDY project agree with those of satellite observations over 70.14% and 73.6% of the drylands (only the regions covered by all the 13 DGVMs of TRENDY project, three satellite-observed LAI products, and Noah-MP simulations were selected), respectively (figure 3). Compared with TRENDY results, the Noah-MP has comparable performance in simulating the spatial distributions of LAI trends over drylands.
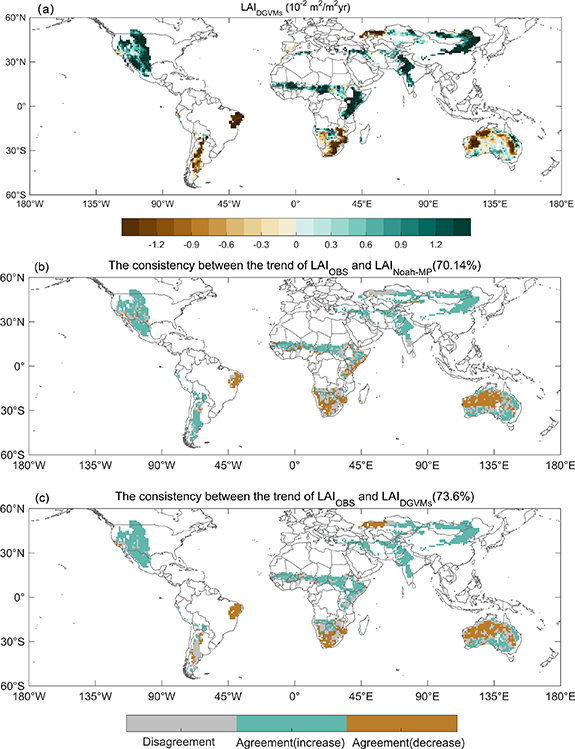
Figure 3. Performance comparison of the Noah-MP and DGVMS in simulating the LAI trends. (a) Linear trends of MMEM of 13 DGVMs from TRENDY project (LAIDGVMs, 10−2 m2 m−2 yr−1) during growing season from 2000 to 2019. Regions labeled by dots indicates regions where the trends are statistically significant (p < 0.05). (b), (c) The consistency between the satellite-observed and Noah-MP modeled LAI trends (b) and that between the satellite-observed and MMEM LAI trends (c) during the growing season from 2000 to 2019. Only the regions covered by all the 13 DGVMs, three satellite-observed LAI products, and Noah-MP simulations were selected.
Download figure:
Standard image High-resolution imageWe compare annual anomalies of the growing season LAI modeled by Noah-MP with those of the average of the three satellite observations. For the greening trend (52.60% of drylands) (figure 2(c)), averaged over global drylands, the modeled LAI trend (0.0048 m2 m−2 yr−1) agrees well with the satellite-based LAI trend (0.0048 m2 m−2 yr−1) (figure 4(a)). The model also agrees very well with the satellite observations in the LAI interannual variations with a correlation coefficient of 0.93 (p <0.01). For the browning trend (18.66% of drylands) (figure 2(c)), the satellite-based LAI decreases at −0.0033 m2 m−2 yr−1, while the modeled LAI shows a greater decreasing trend (–0.0074 m2 m−2 yr−1) (figure 4(b)). The model also matches satellite observations in the interannual variations for these areas (r = 0.86, p < 0.01). Over the 12 selected regions (figures 4(c)–(n)), the model also captures the interannual variations of LAI, and the correlation coefficients between the two are greater than 0.74 over all the selected regions except the southern South America. We observe that there are differences between the interannual variations of modeled and satellite-observed LAI, mainly because the Noah-MP does not include the modules that account for the effects of LULCC on LAI. We then compare the interannual variability of regional LAI modeled by Noah-MP with the DGVMs in TRENDY project, and it shows that the Noah-MP has better performance (figure 5).

Figure 4. Performance of Noah-MP in simulating interannual variations of LAI. Annual anomalies of the average of the three satellite-observed LAI data (LAIOBS, pink line) and Noah-MP LAI (LAINoah-MP, blue line) during 2000–2019 integrated over global drylands where the model shows the same increasing (a) and decreasing (b) trends with satellite observations. The shaded pink area shows the spread of three satellite-observed LAI data. (c–n) the same as (a) and (b) but for the 12 selected regions, where the modeled LAI trend is consistent with the satellite-observed LAI trend. Annual anomalies in precipitation are also shown in each panel (P, gray bar). Also shown on top of each panel are the trends in precipitation (mm yr−1), modeled LAI, and satellite-observed LAI (10−2m2 m−2 yr−1) and correlation coefficients between the modeled and satellite-observed LAI (r1) and those between precipitation and the satellite-observed LAI (r2), respectively. Asterisks indicated that the trend is significant (p < 0.05). The study area is the same as in figure 2(a).
Download figure:
Standard image High-resolution image
Figure 5. Performance comparison of the Noah-MP and DGVMS in simulating the interannual variations of LAI. Annual anomalies of the average of three satellite-observed LAI data (LAIOBS, pink line), Noah-MP LAI (LAINoah-MP, blue line) and MMEM LAI of DGVMs (LAIDGVMs, light blue line) during 2000–2019 integrated over for the 11 selected regions. The shaded area shows the ensemble spread of 13 DGVMs in TRENDY project. Also shown on top of each panel are the trends in MMEM LAI, Noah-MP LAI, and satellite-observed LAI (10−2 m2 m−2 yr−1), correlation coefficients between the MMEM LAI and satellite-observed LAI (r1) and those between Noah-MP LAI and the satellite-observed LAI (r2), and standard deviation of MMEM LAI (SD1), Noah-MP LAI(SD2), and satellite-observed LAI (SD3) respectively. Asterisks indicated that the trend is significant (p < 0.05). The study area is the same as in figure 3(a).
Download figure:
Standard image High-resolution image3.2. Drivers of vegetation change over drylands
The LAI changes can be attributed to climate change, elevated CO2 and LULCC in the study. Nitrogen deposition is also a driver for vegetation change, while this factor is not represented in Noah-MP, like most of other LSMs or ecosystem models. In fact, nitrogen deposition played little role in dryland areas (Bobbink et al 2010, Zhu et al 2016). Ours results show that climate change, elevated CO2 and LULCC contribute 55.07%, 44.86% and 0.07% to the LAI changes over areas with a greening trend, respectively, and climate change dominates the LAI changes over areas with a browning trend, followed by LULCC (figure 6(a)). Rising atmospheric CO2 concentration promotes the leaf scale photosynthesis. In addition, the elevated CO2 leads to enhanced plant water use efficiency (Donohue et al 2013, Driscoll et al 2020), because the amount of water loss through transpiration during photosynthesis is reduced due to partial closure of the plant stomata. Hence, the rising atmospheric CO2 concentration generally has a positive effect on LAI changes over drylands (figure 7(b)) and therefore has been regarded as the main driver of the greening over drylands (Burrell et al 2020) and global continents (Zhu et al 2016). Different from a previous study (Burrell et al 2020), our results show that elevated CO2 dominates the trend of LAI over only 13.89% of drylands (figure 6(b)). Water resources should be a major limiting factor for vegetation growth over drylands (Zhang et al 2022). Changes in precipitation explain the year-to-year variations of LAI (p <0.05) over all selected regions except the Tibet Plateau (figures 4(c)–(n)). This indicates that there is a potential linkage between climate change and vegetation change. Our results of the primary drivers are further confirmed by previous regional studies. In the following paragraphs, we will compare the results of model simulation with regional studies according to different dominant factors.
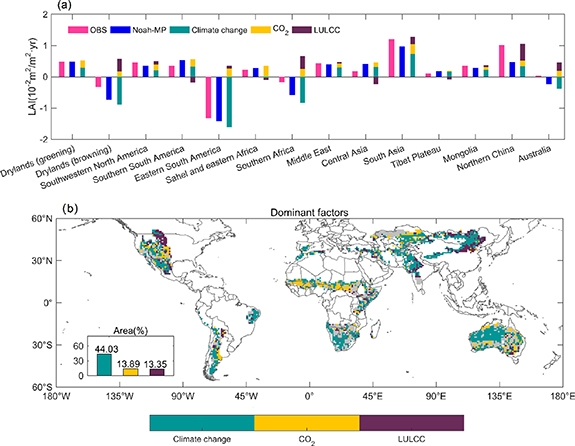
Figure 6. Drivers of LAI change. (a) Contribution of different drivers to the LAI trend over the global greening and browning regions and the 12 selected regions. Note that climate change, elevated CO2 and LULCC contribute 55.07%, 44.86%, and 0.07% to the greening trend (1st column in (a)), respectively, while the browning trend are dominated by climate change followed by LULCC (2nd column in (a)). (b) Spatial distribution of dominant drivers (climate change, CO2, and LULCC) contributing to the increasing or decreasing LAI trends. Regions that Noah-MP differs from satellite observations in the LAI trend are masked in gray.
Download figure:
Standard image High-resolution image
Figure 7. Contributions of the driving factors to LAI change. The contributions of (a) climate change, (b) elevated CO2, and (c) LULCC to linear changes in LAI between 2000 and 2019. Regions that the modeled LAI disagrees with satellite-observed LAI trends are masked in gray.
Download figure:
Standard image High-resolution image
3.2.1. The role of climate change
Modeling results show that climate change is a primary driver of the LAI change in 44.03% of the drylands (figure 6(b)). This is confirmed by previous studies that vegetation changes are primarily driven by precipitation in northern Sahel (Hickler et al 2005, Brandt et al 2014), northwestern India and most regions of central Pakistan (Wang et al 2017, Jin and Wang 2018), southern Mongolia (John et al 2015, Gantsetseg et al 2016), Inner Mongolia (Tian et al 2015, Kang et al 2021), central and southern Australia (Donohue et al 2009, Poulter et al 2014), and by both precipitation and temperature in Middle East (Araghi et al 2019, Gholamnia et al 2019, Alhumaima and Abdullaev 2020), eastern Central Asia (Li et al 2015, Zhou et al 2015, Dubovyk et al 2016) and Tibet Plateau (Zhong et al 2019, Zou et al 2020). Next, we selected three regions to further explain the impact of climate change on vegetation change. Over southwestern Bolivia and southern Argentina the modeling results show that vegetation greening is mainly caused by climate change. Although we have not yet found direct evidence that climate change is the main cause for vegetation greening, many studies show that these regions are less affected by human activities, such as deforestation or reforestation (Aide et al 2013), expansion of agricultural lands (e.g. soybeans) (Song et al 2021) and cattle pasture (Fehlenberg et al 2017), and thus support our results. Over eastern Central Asia we observe a widespread greening trend driven mostly by climate change. It was reported that reclamation during the Soviet era and cropland abandonment and declining livestock numbers after the collapse of the Soviet Union in 1991 have greatly affected vegetation growth in Central Asia (Zhou et al 2015). In this region, the documented evidences that vegetation dynamics in eastern Central Asia was strongly affected by climate change over post-Soviet (Li et al 2015, Zhou et al 2015, Dubovyk et al 2016) are consistent with the modeling result. Australia experiences a greening trend in the southern and eastern regions and a browning trend in central and western regions. The modeling results show that the vegetation changes were mainly driven by climate change in Australia except cropland in the southeast. This is corroborated by previous findings that vegetation change is sensitive to the precipitation in Australia (Donohue et al 2009, Poulter et al 2014). For example, the 2010–2011 the La Niña conditions caused increasing precipitation and led to the greening trends in Australia (Poulter et al 2014).
The eastern South America, eastern coast of Africa, southern Africa, and central and western regions of Australia have experienced a browning trend, and climate change is the dominant factor (figure 6(b)). In these areas, decreasing precipitation is also observed (figure 1(c)). Particularly, the precipitation decreases significantly (p <0.05) at a rate of −14.32 mm yr−1 from 2000 to 2019 in the eastern South America (figure 1(c)) and results in the greatest browning trend; it was reported that drought in 2012 results in serious degradation in this region (Mariano et al 2018).
3.2.2. The role of LULCC
The Noah-MP produces dominant contribution of LULCC to the LAI change over 13.35% of the drylands (figure 6(b)). This can be confirmed by LULCC in North China, Turkey, northern dry Chaco and northern central Mongolia. More specifically, the North China has experienced a significant (p <0.05) greening trend. There is well documented evidence that the vegetation greening mainly resulted from implementation of reforestation projects over North China (Chen et al 2019, Cai et al 2022), which supports the modeling results. Similarly, a significant (p <0.05) greening trend over parts of Turkey is driven mostly by LULCC as modeled by the Noah-MP. This is supported by the evidence of afforestation practices implemented in Turkey for erosion control in arid and semiarid ecosystems, because Turkey suffered heavy land degradation during the last millennia (ÇAliŞKan and Boydak 2017). The greening we observe over northern dry Chaco in South America is dominated by LULCC. This can be confirmed by rangeland expansion in northern dry Chaco (Baumann et al 2017). The northern central Mongolia experienced significant greening trend (p <0.05) driven mostly by LULCC. This is consistent with the conclusion that 'the third campaign for reclaiming virgin lands' development program, in order to increase food security and prevent food crises, leads to greening trend (John et al 2015). In eastern Mongolia, however, the dominant role of LULCC for greening trend may be explained by the evidence that decrease of total number of livestock and population density (John et al 2015).
The Noah-MP produces dominant contribution of LULCC to vegetation greening over the eastern Mexico and eastern Africa except the coastal areas. Moreover, it produces positive effects of LULCC on LAI changes over southern Sahel, eastern Africa, southern Africa and portions of southeastern Australia, although the LULCC is not the dominant factor. The effects of LULCC can be explained by WPE; the documented evidence of WPE in these regions well supports the modeling results (Aide et al 2013, Saha et al 2015, Venter et al 2018, Deng et al 2021). The distribution of six regions mentioned above mostly overlaps with the WPE sites (except the southwestern United States) that has previously been validated (Deng et al 2021). WPE expanded persistently in grasslands and savannas worldwide and usually results in LAI increase (Deng et al 2021). The modeling results show that LULCC is also the largest driver for the greening in northern Great Plains, where grassland or mixture of grassland and cropland dominates (figure 1(b)). In this region, the dominant effects of LULCC may be partly due to WPE and partly due to agricultural intensification, which have been documented in previous studies (Chen et al 2019, Currey et al 2022). As for the southwestern United States, the WPE also occurred (Barger et al 2011). However, the model produces negative impacts of LULCC on the LAI trend (figure 7(c)), probably because the positive effect of WPE on LAI trend is offset by the negative effects of long droughts (Zhang et al 2021); the drier and warmer conditions have resulted in longer fire seasons and larger areas of vegetation loss (Mantgem et al 2009, Dennison et al 2014, Hantson et al 2021).
The modeling results show that LULCC dominates the greening trend in central India and parts of northwestern India, southeastern Pakistan and southeastern Australia (figure 6(b)), where irrigated cropland or dryland cropland is the dominant vegetation type (figure 1(b)). The dominant role of LULCC in these regions can be attributed to agricultural intensification, which has a positive contribution to vegetation greening. This is corroborated by previous findings that cropland greening is mainly attributable to human land-use management (Chen et al 2019), for example, expansion of irrigated area (Ambika et al 2016) and consumption pattern of fertilizer (Lu and Tian 2017).
3.3. Causes to the disagreement between the satellite-based and modeled LAI trends
The modeled LAI trends disagrees with the satellite-based LAI trends over ∼28.74% of the global drylands. Here we select four typical regions (southern California, southern Africa, northwestern Central Asia, and southern India) to investigate the causes to the disagreement.
The satellite-based LAI decreases from 2000 to 2019 in southern California (figure 2(a)), whereas the modeled LAI shows an opposite trend (figure 2(b)). The southern California was under three severe droughts during 2002–2003, 2007–2009, and 2012–2016 (MacDonald 2010, Lund et al 2018). The droughts along with fires and pathogenic outbreaks increased forest and woodland mortality (Dennison et al 2014). For example, over 102 million trees died from 2010 to 2016 on California's drought stricken forests (www.fs.usda.gov/news/releases/new-aerial-survey-identifies-more-100-million-dead-trees-california). Besides, agriculture practices in the Central Valley highly depends on irrigation (Tindula et al 2013) and plays an important role in vegetation changes. However, the version Noah-MP used in this study does not represent these processes by driven only by climate forcing and CO2 concentration.
The satellite-based LAI increases during the period 2000–2019 in portions of the southern Africa (figure 2(a)), while the Noah-MP-modeled LAI decreases (figure 2(b)) because of great decrease in precipitation (figure 1(c)). These areas, including Botswana, Zimbabwe, northeastern Namibia and the eastern south Africa, underwent significant net gains in WPE (Saha et al 2015, Venter et al 2018) and the WPE enhanced vegetation greening and water use efficiency in these areas (Deng et al 2021). The WPE has not been represented in Noah-MP, causing the model to underestimate vegetation greenness.
Desertification of grassland is observed across the northwestern Central Asia (figure 2(a)), while the modeled LAI shows an increasing trend (figure 2(b)). It was reported that the observed browning trend mainly attributes to the drying climate and persistent drought in the northwestern Central Asia (Zhang et al 2018). The Noah-MP may overestimate grassland resiliency to droughts due to uncertainties in the rooting depth (too deep), making the model unable to simulate the LAI trend in this region.
The satellite-based LAI increases significantly from 2000 to 2019 in the southern India (figure 2(a)), where the dominant vegetation type is irrigated cropland (figure 1(b)). The modeled LAI decreases in these regions (figure 2(b)) due mainly to great reduction in precipitation (figure 1(c)). The anthropogenic effects, such as heavy fertilizer use for agriculture production (Lu and Tian 2017) and groundwater extraction for irrigation (Rodell et al 2009), have greatly contributed the greening of the southern India (Chen et al 2019). However, the model does not consider the impact of these human activities on vegetation changes, so it underestimates the increasing LAI trend.
4. Conclusions
In the study, we provide a detailed analysis of the causes of vegetation change over global and regional drylands based on the three long-term satellite LAI data sets and a process-based Noah-MP LSM. The Noah-MP shows better performance in simulating the interannual variability of the average of the three satellite-based LAI data sets over global drylands compared with that of MMEM LAI from the TRENDY project. Moreover, the Noah-MP has an excellent performance in reproducing the observed long-term trend in LAI, and the model agrees well with the satellite-based LAI changes over 71.26% of global drylands. Our results show a limited effect of elevated CO2 relative to the dominant effect of climate change on vegetation change, which should be considered in predictions of trends and interannual variations of global carbon sinks.
Acknowledgments
This study is jointly sponsored by the National Natural Science Foundation of China (42130613) and scientific research fund of Chengdu University of Information Technology (KYTZ202122). Niu is supported by a NASA MAP Project (80NSSC17K0352). This study is also supported by the Jiangsu Collaborative Innovation Center for Climate Change. We thank the TRENDY modeling group for providing the DGVMs outputs.
Data availability statement
The data used in this study are available online: reprocessed MODIS version 6 LAI products (http://globalchange.bnu.edu.cn/research/laiv6); the GLASS LAI product (Version 6) (www.glass.umd.edu/Download.html); the GLOBMAP LAI (Version 3) (https://zenodo.org/record/4700264#.Y-HxoS9BxPb); the GLDAS2.1 atmospheric forcing fields (https://ldas.gsfc.nasa.gov/gldas/forcing-data); the TRENDYv10 outputs (https://blogs.exeter.ac.uk/trendy).