

Abstract
Resilience is the ability of ecosystems to maintain function while experiencing perturbation. Globally, forests are experiencing disturbances of unprecedented quantity, type, and magnitude that may diminish resilience. Early warning signals are statistical properties of data whose increase over time may provide insights into decreasing resilience, but there have been few applications to forests. We quantified four early warning signals (standard deviation, lag-1 autocorrelation, skewness, and kurtosis) across detrended time series of multiple ecosystem state variables at the Hubbard Brook Experimental Forest, New Hampshire, USA and analyzed how these signals have changed over time. Variables were collected over periods from 25 to 55 years from both experimentally manipulated and reference areas and were aggregated to annual timesteps for analysis. Long-term (>50 year) increases in early warning signals of stream calcium, a key biogeochemical variable at the site, illustrated declining resilience after decades of acid deposition, but only in watersheds that had previously been harvested. Trends in early warning signals of stream nitrate, a critical nutrient and water pollutant, likewise exhibited symptoms of declining resilience but in all watersheds. Temporal trends in early warning signals of some of groups of trees, insects, and birds also indicated changing resilience, but this pattern differed among, and even within, groups. Overall, ∼60% of early warning signals analyzed indicated decreasing resilience. Most of these signals occurred in skewness and kurtosis, suggesting 'flickering' behavior that aligns with emerging evidence of the forest transitioning into an oligotrophic condition. The other ∼40% of early warning signals indicated increasing or unchanging resilience. Interpretation of early warning signals in the context of system specific knowledge is therefore essential. They can be useful indicators for some key ecosystem variables; however, uncertainties in other variables highlight the need for further development of these tools in well-studied, long-term research sites.
Export citation and abstract BibTeX RIS

Original content from this work may be used under the terms of the Creative Commons Attribution 4.0 license. Any further distribution of this work must maintain attribution to the author(s) and the title of the work, journal citation and DOI.
1. Introduction
Forests around the globe are experiencing the effects of climate change, atmospheric pollution, and invasive pests and pathogens that may diminish their resilience to ongoing or future perturbations [1, 2]. Resilience is an emergent property that reflects the amount of disturbance an ecosystem can withstand before undergoing a large-scale transition [3]. Sometimes called regime shifts, transitions can be gradual or abrupt changes in ecosystem structure or function that may or may not be reversible, even if the disturbance abates [4, 5]. An example of a reversible regime shift associated with declining resilience is the switch from a mesotrophic to eutrophic lake with phosphorous loading [6], while an irreversible regime shift is the salinization of surface soils due to intensive agricultural management in semi-arid areas [7]. In forests, reversible transitions include the widespread decline of red spruce (Picea rubens) in the eastern US during the mid-20th century, which changed course and began recovery in the early 2000s following reductions in acid deposition coupled with warming temperatures [8–10]. An irreversible transition is the change from canopy- to shrub-dominated ecosystems, as in the case of rhododendron (Rhododendron maximum) expansion in southern Appalachian riparian forests following the loss of American chestnut (Castanea dentata) to a fungal pathogen and the decline of eastern hemlock (Tsuga canadensis) due to an invasive insect pest [11]. Critical transitions in forests can also manifest as functional changes, for example as decades-long declines in nitrogen retention following harvest [12].
Often our understanding of changing ecological resilience is informed by retrospective studies [e.g. 13–16] using two metrics: (1) the time required for ecosystems to recover, and (2) the extent of the return to pre-disturbance conditions [17]. By contrast, early warning signals hold the promise of anticipating the approach of an ecosystem to a critical transition between alternative states [18–20]. Sometimes called leading indicators, early warning signals of changing resilience may forecast impending regime shifts by utilizing dynamics in the statistical properties of ecosystem state variables. These properties include variance (standard deviation), symmetry (skewness), and peakedness (kurtosis), along with the autocorrelation coefficient which reveals the temporal dependency in the values of state variables [21]. Although each of the multiple methods of quantifying early warning signals has limitations [22–26], empirically derived early warning signals remain a compelling means of detecting changing ecological resilience. Their relative simplicity and lack of assumptions about underlying system structure [27, 28], particularly when supported by a deep knowledge of the ecosystem, facilitate robust interpretation of their meaning [29].
We organized theoretical expectations for how change over time in early warning signals can illustrate changing resilience [17] (figure 1). In this conceptual model, temporal increases in standard deviation or autocorrelation (figure 1(A)) signify 'critical slowing down,' in which slow recovery from small perturbations can lead to a regime shift [5, 21, 30]. Increasing trends in skewness or kurtosis (figure 1(B)) indicate 'flickering,' or the vacillation of an ecosystem between alternative regimes [31–33]. Temporal decreases in signals of critical slowing down (variance and autocorrelation) and flickering (skewness and kurtosis; figure 1(C)) indicate increasing resilience as an ecosystem recovers from past disturbance [34], which may have involved the crossing of a critical threshold [32]. An absence of significant trends in early warning signals (figure 1(D)) suggests that resilience is insensitive to current disturbances or that the system is far from a transition.

Figure 1. Conceptual framework for how temporal change in early warning signals can indicate trends in resilience. Early warning signals are grouped into four categories according to their temporal behavior within and across variables, where up arrows indicate increasing trends, down arrows indicate decreasing trends, and horizontal arrows indicate no significant change in resilience. (A) Critical slowing down occurs prior to a transition when both standard deviation and the autocorrelation coefficient show positive increases over time (A1). If one of the critical slowing down early warning signals were to increase while the other either decreases or shows no significant change, then the signal would be ambiguous (A2). (B) Flickering occurs as an ecosystem undergoes transition, and skewness and kurtosis simultaneously increase (B1). The flickering signal is ambiguous if either skewness or kurtosis increases while the other signal decreases or shows no trend (B2). (C) Decreasing trends across early warning signals indicate recovery from past disturbance. (D) Neither critical slowing down nor flickering shows change over time, suggesting that system resilience is stable.
Download figure:
Standard image High-resolution imageDespite the potential for irreversible transformations in forests, early warning signals have rarely been applied in forest ecosystems, with some notable exceptions [35, 36]. Here we examine temporal trends in early warning signals to describe how resilience in a northern hardwood forest might be changing in response to past or ongoing disturbances, using the long-term (>50 year) monitoring and research records from the Hubbard Brook Experimental Forest located in the White Mountains of New Hampshire, USA (figure S1). While Hubbard Brook has demonstrated remarkable resilience to previous forest harvests [37, 38], the legacy of more than 50 years of acid rain, ongoing climate change, and localized disturbances [39–44] may have reduced this resilience enough to push the system toward a transition in ecosystem structure or function [44], motivating the analysis of early warning signals of declining resilience at the site. A shift in ecosystem structure may arise from impacts on late-successional, canopy species such as American beech (Fagus grandifolia) due to beech bark disease and beech leaf disease [45, 46] that may be as irreversible as other instances when pests and pathogens eradicate a foundational species [11, 12]. A change in ecosystem function might manifest as acid rain induced nutrient limitations on primary productivity [45] that may ultimately reverse as the site recovers from decades of nutrient depletion [47]. These losses of resilience and transition into alternative states may feature the non-linear crossing of a threshold or may manifest as a slow, linear response to gradually changing conditions [4, 48].
When analyzing early warning signals of changing resilience at Hubbard Brook, we included calcium (Ca) and nitrate (NO3) concentrations and fluxes (concentration times flow) in stream water as indicators of ecosystem nutrient retention [49]. In nutrient poor ecosystems such as our northern hardwood forest, these two nutrients act as master variables that control forest net primary productivity, biodiversity, and water quality [50–54]. Historical acid deposition has resulted in ecosystem nutrient losses due to leaching from upland soils into streams [42]. Thus, we expected that trends in early warning signals calculated from stream solutes would show critical slowing down (rising variance and autocorrelation) and flickering (increasing skewness and kurtosis) that are emblematic of declining resilience as defined by our conceptual model (figure 1). We also anticipated that the slope of trends in early warning signals for stream solutes would vary depending on whether streams drained watersheds that had not been experimentally treated (i.e. biogeochemical reference), had received nutrient additions in the form of Ca, or had been experimentally harvested [e.g. 33, 55]. In this sense, stream solute concentrations and fluxes provided an integrative proof-of-concept for drawing inferences about temporal trends in early warning signals that were calculated for other ecosystem state variables, e.g. biotic measures of plant, insect, and bird populations. Because early warning signals have rarely been applied to in situ forest data, our analyses serve as a test case regarding the utility of early warning signals as a method for detecting changing resilience in the biogeochemistry and biology of forest ecosystems.
2. Methods
We quantified four early warning signals (standard deviation, the lag-1 autocorrelation coefficient, skewness, and kurtosis) across multiple ecosystem state variables at Hubbard Brook and analyzed how they have changed over time. The datasets used ranged from 25 to 55 years in duration, with early warning signals calculated from detrended data derived from the residuals of nonparametric kernel regression (see supplementary material). Datasets were aggregated to an annual timestep (summed or averaged) and included biogeochemical variables such as stream solute concentrations and fluxes and biological variables such as soil microbial biomass, annual radial tree growth, lepidopteran larval biomass, and migratory bird abundance (table S1). These variables were selected to represent a range of indicators of forest ecosystem structure and function that may vary in their proximity to disturbance drivers, and thus in their capacity to detect a critical transition [56]. We evaluated how ongoing disturbances such as climate change and atmospheric deposition (figure S2) might explain temporal patterns in early warning signals using long-term monitoring records of climate and precipitation chemistry from Hubbard Brook through a combinate of univariate correlations and multivariate analyses. Mean annual temperature (MAT) and total annual precipitation were indicators of climate. MAT was stable until the mid-1990s after which it began increasing [43] while increasing trends in total annual precipitation started in 2003 [57]. Atmospheric deposition chemistry was represented by total annual precipitation fluxes of sulfate, nitrate, and total inorganic N, which peaked in the late 1960s to early 1970s, and have been declining following the passages of the 1970 Clean Air Act and 1990 Clean Air Act Amendments. Precipitation chemistry was also quantified as mean annual precipitation pH, which has been steadily increasing since the 1970s [42, 44]. The supplementary information includes a detailed description of our approach, such as information about the study site, data collection protocols, and data analysis. All data, source code, and outputs from the analysis, including time series of original data, detrended data, and early warning signals can be accessed at https://github.com/Contosta/Early-Warning-Signals-Resilience-Hubbard-Brook.
3. Results
3.1. Early warning signals of changing resilience in ecosystem nutrient retention
Change over time in early warning signals of stream solute concentrations and fluxes as determined with Mann–Kendall tests (see supplementary information) varied among five small watersheds monitored for over 50 years at Hubbard Brook (figure 2). In watershed 6, a biogeochemical reference watershed, most early warning signal metrics for Ca concentration and flux significantly decreased over time (figure 2; table S2), implying increasing resilience (figure 1(C)). Watershed 1, which received a calcium silicate (CaSiO3) addition in 1999, also showed decreases in early warning signals of Ca fluxes indicative of increasing resilience (figure 1(C)) that were statistically significant for skewness and kurtosis (figure 2; table S2). By contrast, experimentally harvested watersheds generally showed increasing trends in early warning signals for Ca concentrations and fluxes that suggest declining resilience (figures 1(A) and (B)). In watershed 2, which was deforested in 1965–1966 followed by herbicide application for the subsequent three summers, all four early warning signals for Ca concentration significantly increased over time, indicating decreasing resilience. Likewise, three of the four early warning signals for Ca concentration in watershed 4, which was strip-cut by thirds in 1970, 1972, and 1974, implied decreasing resilience (i.e. significant positive trends). Watershed 5, which was whole-tree harvested during the winters of 1983 and 1984, similarly exhibited significant increases in autocorrelation, skewness, and kurtosis of Ca concentration, each indicating decreasing resilience.
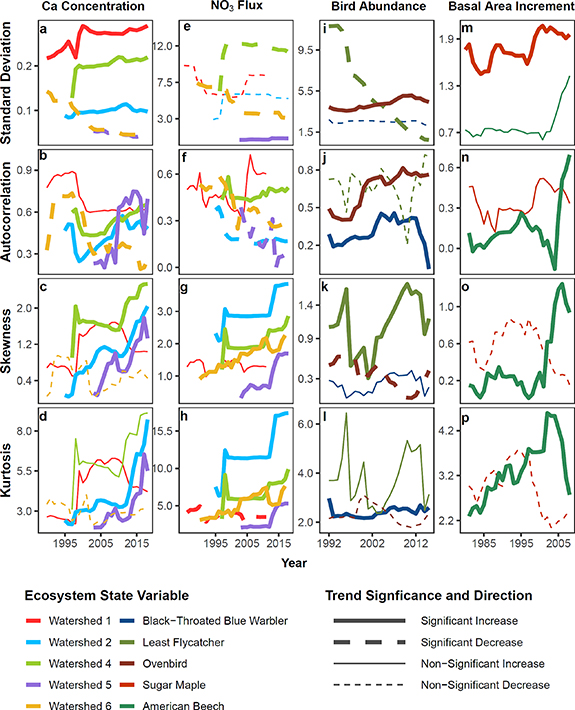
Figure 2. Early warning signals of changing resilience at Hubbard Brook as indicated by standard deviation, the autocorrelation coefficient, skewness, and kurtosis. Stream Ca concentrations within experimental watersheds 1, 2, 4, 5, and 6 (a)–(d). Stream NO3 fluxes within the same watersheds (e)–(h). Note that in harvested watersheds (2, 4, and 5), both pre-treatment years and years immediately following the disturbance were excluded (see supplementary materials). Basal area increment of sugar maple and American beech (i)–(l). Abundances of migratory songbirds; black-throated blue warbler, least flycatcher, and ovenbird (m)–(p). Each panel shows early warning signals calculated on detrended data. Solid lines show increasing trends in early warning signals. Dashed lines show decreasing trends. Bold lines indicate significant change over time, which were determined with a Mann–Kendall test. Because early warning signals were determined using a moving window of 50% of the dataset, only half of the original time series length appears.
Download figure:
Standard image High-resolution imageFor stream NO3 concentrations and fluxes, there was an overall pattern of increasing trends in skewness and kurtosis (implying flickering or declining resilience) in all watersheds including the unmanipulated biogeochemical reference watershed 6 (figure 2; table S2). These trends in early warning signals of stream NO3 alone may not indicate declining resilience. Long-term declines in stream N export punctuated by periodically elevated values can manifest as increased asymmetry (skewness) and longer tails (kurtosis) in the data distribution even if resilience is decreasing, unchanged, or increasing. By way of example, figure S5 illustrates how skewness and kurtosis can increase even as mean and variance decrease.
3.2. Early warning signals of changing resilience in other ecosystem state variables
Ecosystem state variables representative of biological organisms—soil microbial biomass carbon (C) soil microbial biomass nitrogen (N), tree growth, lepidopteran larval biomass, and avian abundance—also showed trends in early warning signals that suggested changing resilience. Note that none of these variables were measured in experimentally manipulated sites, but rather were monitored in reference areas of the forest that experienced exogenous long-term disturbances and episodic stressors (figure S1). Trends for these variables were less coherent than those for stream solute concentrations and fluxes. For example, except for a significant decrease in autocorrelation, there were no trends in early warning signals for soil microbial biomass C, an indicator of overall soil nutrient cycling. By contrast, the standard deviation of soil microbial biomass N, an indicator of N cycling, significantly decreased and both skewness and kurtosis significantly increased (table S2).
Patterns of change over time for basal area increment of two of the dominant tree species at Hubbard Brook, sugar maple (Acer saccharum) and American beech, were also mixed, with basal area increment of American beech showing significant increases in three of four early warning signals (i.e. autocorrelation, skewness, and kurtosis, indicating declining resilience) and sugar maple also showing declining resilience but only for one measure, an increasing trend in standard deviation (figure 2, table S2). For lepidopteran larval biomass, the two early warning signals representative of flickering, skewness and kurtosis, significantly increased while neither standard deviation nor autocorrelation changed over time (table S2). For migratory bird abundance, kurtosis increased for American redstart (Setophaga ruticilla), black-throated blue warbler (S. caerulescens), and black-throated green warbler (S. virens) even as skewness showed no significant change. These same species showed increasing, decreasing, or no trends in standard deviation or autocorrelation, respectively. The three other birds species considered, least flycatcher (Empidonax minimus), ovenbird (Seiurus aurocapilla), and red-eyed vireo (Vireo olivaceus), also exhibited a mix of significantly increasing, decreasing, or no change over time in early warning signals (figure 2, table S2).
3.3. Coherence across early warning signals
More than half of the early warning signals calculated (58%) indicated declining resilience. Another 27% indicated increasing resilience, while 15% showed no trend (figure 3). The significance and direction of these trends varied both within and among ecosystem attributes. Of the 31 ecosystem state variables used for early warning signals analysis, 37% exhibited temporal increases in skewness and kurtosis. Our conceptual model (figure 1(B)) suggests that these positive trends are indicative of declining resilience in the northern hardwood forest at Hubbard Brook and of flickering between alternative states. When differentiated into biogeochemical and biological state variables, increases in skewness or kurtosis likewise represented the plurality of changing resilience indicators. For stream NO3 concentrations and fluxes, 45% of early warning signals calculated across five small watersheds showed flickering or flickering ambiguous behavior. Similarly, 41% of early warning signals derived from migratory bird abundance fit with the flickering category of our conceptual model.

Figure 3. Biogeochemical and biological variables from the Hubbard Brook Experimental Forest grouped into one of four categories of changing resilience according to the temporal behavior of early warning signals (figure 1 defines these categories). If a state variable were to show significant positive increases across all four early warning signals, this would appear as critical slowing down occupying 50% of the trends in early warning signals and skewness comprising the other 50%. Note: ecosystem state variables differed in the number of datasets used to calculate the proportion of early warning signals within each category (n = 31 for all ecosystem state variables included in the analysis; n = 10 for stream Ca concentrations and fluxes; n = 10 for stream NO3 concentrations and fluxes; n = 2 for soil microbial biomass; n = 2 for basal area increment; n= 1 for lepidopteran larval biomass; n = 6 for migratory bird abundance).
Download figure:
Standard image High-resolution imageIncreases in standard deviation or autocorrelation that represent critical slowing down comprised a small proportion of trends, amounting to 20% of the temporal behavior of early warning signals calculated for all 31 ecosystem state variables included in the analysis. Critical slowing down was also less symptomatic of resilience loss within specific biogeochemical and biological attributes. Only 20% of early warning signals calculated for stream Ca and NO3 concentrations and fluxes showed temporal behavior representative of critical slowing down. In the cases of lepidopteran larval biomass and soil microbial biomass C and N, critical slowing down behavior was completely absent, and the lack of change over time in both standard deviation and autocorrelation was classified as no trend (figure 3). In multiple cases early warning signals exhibited decreasing trends, which implied 'recovery' in our conceptual model (figure 1) and in the summary of early warning signals trends (figure 3). This pattern was evident for migratory bird abundance, soil microbial biomass (C and N), and some stream Ca concentrations and fluxes. Thus, while slightly over half of all early warning signals analyzed showed temporal increases that would suggest declining resilience, slightly less than half exhibiting either unchanging or increasing resilience.
3.4. Drivers of changing resilience
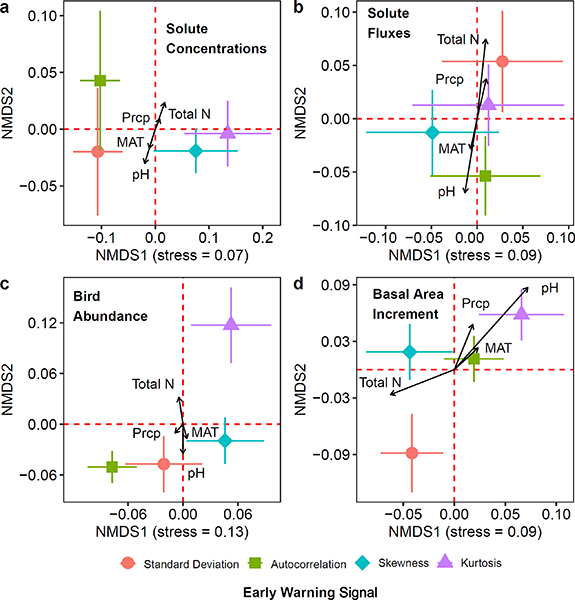
Measures of climate change and atmospheric deposition (figure S2) were significantly correlated with early warning signals in the long-term data at Hubbard Brook (figure 4, tables S3–S7). For both univariate correlations (tables S3–S6) and multivariate analyses (figure 4, table S7), early warning signals were more strongly correlated with precipitation chemistry (Total N, pH) than with climatic drivers (mean annual temperature, total annual precipitation). For stream solutes and fluxes aggregated across watersheds, changing precipitation pH and atmospheric N inputs mapped onto indicators of flickering (figures 4(a) and (b)). Skewness was more associated with mean annual precipitation pH while kurtosis (e.g. see figures 4(a) and (b)) was more correlated with total precipitation inorganic N flux. For multivariate analyses of migratory bird abundance and tree basal area increment, general patterns were not observed between changing atmospheric chemistry and early warning signals of potential regime shifts (figures 4(c) and (d)).
Figure 4. Non-metric multidimensional scaling (NMDS) plots of early warning signals of changing ecological resilience at the Hubbard Brook Experimental Forest for stream solute concentrations (a); stream solute fluxes (b); basal area increment (c), and migratory bird abundance (d). Arrows fit on top of the ordination represent correlations between hypothesized environmental drivers and early warning signals. The direction of arrows indicates the direction of the relationship while the length indicates the strength of the relationship. MAT = mean annual temperature; Prcp = total annual precipitation; pH = mean annual volume weighted precipitation pH; Total N = total annual precipitation nitrogen flux as the sum of NH4–N and NO3–N. Note that ordinations for bird abundance, stream solute concentration, and stream solute flux each included three dimensions in the final ordination solution and associated stress statistic, but only the first two dimensions are shown on the plots. See supplementary materials for a more detailed explanation of the approach used for conducting the multivariate analysis.
Download figure:
Standard image High-resolution image
4. Discussion
4.1. Forest biogeochemistry shows signs of both increasing and decreasing resilience
We used long-term records of stream solute concentrations and fluxes at Hubbard Brook to demonstrate how resilience in ecosystem nutrient retention might vary between reference and experimentally disturbed watersheds. Declining trends in early warning signals of stream Ca concentrations and fluxes in watershed 6, the biogeochemical reference, and watershed 1, which received CaSiO3 additions, align with prior understanding of forest recovery from the long-term legacy of acid rain while also providing new insights into the linkage between Ca and resilience. The recovery of watershed 1 following Ca additions has been well-documented [e.g. 45, 50] and fits with decreasing trends in early warning signals of stream Ca concentrations and fluxes that we report here. By contrast, declining early warning signals of stream Ca in watershed 6 were somewhat surprising given changing growth rates and species composition at this site [45] that suggest resilience loss. In fact, temporal decreases in early warning signals of stream Ca concentrations and fluxes from watershed 6 suggest that the system is not approaching a regime shift and may, in fact, be slowly recovering from decades of acid deposition. Early warning signals analyzed from experimentally harvested watersheds indicated critical slowing down and flickering (table S2), or evidence of declining resilience. These increases in early warning signals of Ca concentrations and fluxes may represent inherently low rates of nutrient cation weathering in tandem with acid deposition [54] from the three experimentally cut watersheds (watersheds 2, 4, and 5) that experienced additional local perturbations in Ca loss associated experimental forest cutting [38]. This combination of pulse (e.g. forest cutting) plus the legacy of press (e.g. acid deposition) disturbances may have rendered these watersheds more vulnerable than reference locations in the forest to the long-term impacts of acidic precipitation [44]. While previous research has also shown that forest regeneration dynamics in experimentally cut areas may be attributable to Ca losses from both acid rain and harvesting [58], these dynamics have not been explicitly considered from a resilience perspective.
Trends in early warning signals of stream NO3 told a different story than Ca. Early warning signals for stream Ca concentrations differed between unharvested and harvested watersheds, but this did not occur for stream NO3. All of the watersheds in the analysis except for watershed 1, which received CaSiO3 additions, showed significant increases in both the skewness and kurtosis of stream NO3 fluxes and concentrations that imply flickering within the system (figures 1 and 3). This coherence in early warning signals of stream NO3 affirms previous research reporting that the site is transitioning into an alternative biogeochemical regime, from eutrophic, where N is abundant, toward oligotrophic, where N is relatively scarce [59]. The flickering behavior of early warnings signals of soil microbial biomass N (figure 3; table S2) suggests the ubiquity of this transition at Hubbard Brook, with implications for future forest productivity that are poorly understood [59]. Beyond confirming prior documentation of N oligotrophication at the site, the flickering behavior we report suggests loss system of ecosystem resilience over time. The earliest harvest experiment at Hubbard Brook, the clear cut and herbicide application at watershed 2, showed incredible resilience of the N cycle to harvesting and removal of plant biomass [37]. Increasing trends in skewness and kurtosis from harvested and biogeochemical reference watersheds shown in this study indicate declining resilience such that a repeat experiment at watershed 2 might result in very different outcomes with regards to N biogeochemistry.
4.2. Conflicting patterns of changing resilience in northern forest biology
Early warning signals of ecosystem attributes representing soil nutrient cycling, net primary productivity, primary consumers, and secondary consumers exhibited some symptoms of declining resilience such as critical slowing down and flickering. They also showed decreasing trends or lack of change over time, implying increasing or unchanging resilience, respectively. The positive trends in skewness and kurtosis of lepidopteran larval biomass (figure 3; table S2) imply declining resilience and flickering for caterpillars that match recent reports of decreasing insect populations at Hubbard Brook [60] and in many other areas [61]. This pattern is also consistent with previous studies at the site, which have described 20- to 40-fold interannual variation in lepidopteran larval biomass that may be driven by a combination of extreme winter cold and long, warm summers [62, 63]. Interannual variation in phytochemistry, particularly N, may also have influenced early warning signals of caterpillar resilience. We showed that total rates of annual NO3 deposition were negatively correlated with both the skewness and kurtosis of lepidopteran larval biomass (tables S5 and S6). Investigations at Hubbard Brook and elsewhere have affirmed the linkages among N inputs, soil N availability, and lepidopteran abundance [64, 65]. At Hubbard Brook, observed decreases in soil N availability that arise from N oligotrophication [59, 66] may result in lower foliar N concentrations that lead to decreased caterpillar biomass [64]. Here, for the first time, we suggest declining resilience in lepidoptera in response to changing N biogeochemistry and other stressors at the site, as shown by positive trends in skewness and kurtosis.
Our results also indicate flickering in American beech basal area increment and critical slowing down for sugar maple basal area increment (figure 2; table S2). Both are foundational, long-lived, late successional species of northern hardwood forests, and sugar maple is a key component of the regional forest economy and cultural identity. Outside of the experimental watersheds, biomass accumulation for both of these species has plateaued since ∼1980 [67]. This slowing growth may be the natural result of forest maturation [68]. However, the relationships we observed between changing precipitation chemistry and early warning signals of basal area increment, either alone (tables S3–S6) or in multivariate analyses (figure 4; table S7), also fit with current understanding of how shifts in acid deposition, soil nutrient status, and soil nutrient depletion interact to influence the growth of these species [69]. For sugar maple, decades of acid deposition and subsequent soil Ca depletion may account for declining growth rates [50]. In the case of American beech, the arrival of beech bark disease at Hubbard Brook in the 1970s has led to lower growth rates and increased mortality in canopy trees [45]. When combined with current understanding of the interactive effects of sugar maple decline and beech bark disease, indicators of declining resilience suggest a possible transition in forest structure with implications for biogeochemical functions such as soil nutrient cycling [70] and possible impacts on biological diversity and the abundance of particular wildlife species [71]. Early warning signals of decreasing resilience of sugar maple and American beech also suggest that these species may not be able to recover quickly from future disturbances.
Although we observed flickering in the statistical behavior of variables as disparate as soil microbial biomass N, basal area increment of American beech, and lepidopteran larval biomass that may have implications for secondary consumers, changes in annual bird abundance at Hubbard Brook did not always show clearly interpretable patterns. Two of the six species we examined, American redstart and least flycatcher, were abundant at Hubbard Brook in the 1970s, but subsequently declined and have mostly disappeared from the area. In the analyses here, they showed significant, negative trends in standard deviation (figure 2, table S2), which, according to theory, could indicate a 'critical speeding up' that can precede local species extirpation [72], though this concept is not well-established. Declines in skewness for both species, in fact, point to a transition that has already occurred [32] due to a change in forest structure as the forest aged from mid-successional to older, more mature forest stands [73]. One bird species whose population has started declining in recent years, the black-throated blue warbler, showed positive trends in autocorrelation, skewness, and kurtosis (figure 2; table S2), which may be indicative of critical slowing down or flickering (figure 1). However, the black-throated green warbler showed similar trends in early warning signals as the black-throated blue warbler (table S2), even as its abundance has been increasing over time at Hubbard Brook. Interannual variation in avian populations is a function of complex interactions among fecundity in the previous season, adult density, nest depredation, habitat quality, insect food resources, weather conditions in overwintering grounds, and survival during migration [62, 74, 75]. These complex interactions may obscure the direct impacts of acid deposition and climate change on bird abundance [18]. Contributing factors outside of Hubbard Brook may also render birds and other migratory wildlife poor candidates for analysis of changing resilience within the site. These findings highlight the importance of detailed, ecosystem-specific knowledge in choosing variables and interpreting trends in early warning signals to avoid drawing inappropriate conclusions [21, 29].
4.3. Interpreting early warning signals from long-term observations
This study used early warning signals to examine whether and how resilience has changed at Hubbard Brook, and what this change might portend for the biogeochemistry and biology of the future northern hardwood forest. Temporal trends in critical slowing down and flickering were neither coherent across ecosystem state variables, nor were they unambiguous. Early warning signals exhibited temporal behavior that implied critical slowing down or flickering (increasing trends), recovery from perturbation (decreasing trends), unchanging forest resilience (no pattern across early warning signals). This lack of synchrony among signals, even within specific state variables, illustrates well-known difficulties of using them to measure and interpret changing resilience in situ [24, 26].
In additional to their lack of coherence, another challenge to the application of early warning signals is that they do not always perform as theory predicts [22, 23]. Analysis of early warning signals in ecological data may result in false positives, suggesting an approach to a critical threshold that does not exist [23, 24]. Early warning signal assessments may also generate false negatives, failing to detect a regime shift that has already occurred [24–26]. The periodicity, length, and variability of time series data all influence the extent to which early warning signals can detect declining resilience [25, 26]. Decisions that guide the analysis, such as whether and how to detrend the data and the length of the sliding window over which to calculate early warning signals, also affect the power to detect an approaching regime shift and the likelihood of false positives [32]. Several model-based approaches have been proposed to overcome these shortcomings [76]. For example, time-varying autoregressive state-space models can detect critical slowing down [77]. Yet these and other dynamic linear models still require subjective decisions related to data transformation and detrending; they are also prone to generating both false positives and false negatives [77]. More complex models tend to be system-specific, limiting their broad applicability [27].
Even with known limitations, empirically-derived early warning signals remain a compelling means of detecting changing resilience. Our study demonstrates their utility in identifying clear resilience shifts that are both positive and negative, particularly for stream Ca and NO3 concentrations and fluxes. Although acid deposition caused ecosystem Ca losses at Hubbard Brook, this historic Ca depletion only impacted resilience when combined with forest harvest. In contrast, the coherence of early warning signals of stream NO3 concentrations across watersheds implies that loss of resilience—which may be due to N oligotrophication—is a widespread phenomenon regardless of management history. Our analysis also illustrates the potential of applying early warning signals analyses to long-term, in situ observations of forests. The alignment we observed between temporal trends in early warning signals calculated from the monitoring record at Hubbard Brook and our current understanding of the system suggests that they might be used in other forest ecosystems to gain insights into changing resilience.
5. Conclusion
Research at Hubbard Brook has demonstrated the historical capacity of the forest to recover ecosystem form and function following large-scale experimental manipulations and natural disturbances. Cumulative stress caused by decades of climate change, acid deposition, and invasive pests may have diminished some of this resilience such that a repeat of an experimental forest harvest or a recurrence of an extreme natural disturbance such as a hurricane or ice storm may set the ecosystem on a novel trajectory that might include changing species assemblage, vegetation structure, biomass production, or biogeochemical cycling [2]. This study demonstrated the potential to anticipate ecosystem resilience to these future shocks using generic early warning signals in tandem with ecosystem-specific knowledge. The insights gained from our analysis are critical given unprecedented changes in the Earth system and the myriad biogeochemical and biological functions the forest performs.
Acknowledgments
This work was supported by funding from the National Science Foundation from the Division of Research on Learning in Formal and Informal Settings (DRL-1713204 to S G; DRL-1713219 to P H T; DRL-1713222 to P M G) and from the Division of Earth Sciences (EAR-1562127 to M A V). The paper is also a contribution of the Hubbard Brook Ecosystem Study. Hubbard Brook is part of the Long-Term Ecological Research network supported by the National Science Foundation through the Division of Environmental Biology (DEB-1637685). The Hubbard Brook Experimental Forest is located on unceded Abenaki Land. It is currently operated and maintained by the U.S. Forest Service, Northern Research Station, Madison, Wisconsin.
Data availability statement
The data that support the findings of this study are openly available at the following URL/DOI: https://github.com/Contosta/Early-Warning-Signals-Resilience-Hubbard-Brook.
Code availability statement
All software used is provided in the Methods and is also located in the online repository https://github.com/Contosta/Early-Warning-Signals-Resilience-Hubbard-Brook.
Supplementary data (1.7 MB DOCX)