

Abstract
Irrespective of water resource abundance, agriculture in sub-Saharan Africa (SSA) is predominantly rainfed. Along with fertilization, irrigation could support smallholder farmers with stabilizing crop yields, increasing incomes, and achieving food security. A key barrier to irrigation uptake is inadequate rural electricity supply for pumping and distributing water, besides other infrastructure deficits. Here we devise a spatially explicit integrated modelling framework to show that over one third of unmet crop water requirements of 19 major crops in smallholder cropland of SSA could be supplied with standalone solar photovoltaic (PV) irrigation systems that can be paid back by farmers within 20 years. This accounts for 60 km3 yr−1 of blue irrigation water requirements distributed over 55 million ha of currently rainfed harvested area (about 40% of the total). Crucially, we identify 10 million ha with a profit potential >$100 ha−1 yr−1. To finance such distributed small-scale infrastructure deployment and operation, we estimate an average discounted investment requirement of $3 billion yr−1, generating potential profits of over $5 billion yr−1 from increased yields to the smallholder farmers, as well as significant food security and energy access co-benefits. We demonstrate the critical importance of business models and investment incentives, crop prices, and PV & battery costs in shaping the economic feasibility and profitability of solar irrigation. Yet, we find that without strong land and water resources management infrastructure and governance, a widespread deployment of solar pumps may drive an unsustainable exploitation of water sources and reduce environmental flows. Our analysis supports public and private stakeholders seeking to target investments along the water–energy–food–economy–sustainable development nexus.
Export citation and abstract BibTeX RIS

Original content from this work may be used under the terms of the Creative Commons Attribution 4.0 license. Any further distribution of this work must maintain attribution to the author(s) and the title of the work, journal citation and DOI.
1. Introduction
Agricultural systems are the backbone of human society, providing food, energy, and income for billions. Yet, they are highly vulnerable to environmental and socio-economic stressors [1]. This vulnerability is most crucial in the developing world: in sub-Saharan Africa (SSA) about 80% of the agricultural production comes from smallholder farmers [2]. More than half of the population depends directly or indirectly on agriculture as their labour and income source [3, 4]. Most farmers practice rainfed agriculture (covering >90% of cropland [5]) under unpredictable and erratic rainfall patterns [6, 7]. Along with a low degree of mechanization [8] and very limited fertilization [9] (both leading causes of the yield gap in SSA), the lack of artificial irrigation is also shown [10] to be an important driver of low agricultural productivity and food insecurity [11].
Large surface gravity irrigation schemes such as the Office du Niger in Mali, the Koka irrigation project in Ethiopia, or the Gezira in the Sudan account for the bulk of irrigated area in SSA. Yet, they have shown limited benefits for the farmers in the face of large investments, mostly due to inadequate scheme maintenance and ancillary constraints to smallholder agricultural productivity growth [12]. In addition, recent research shows [13] that many recent dam projects in Africa are associated with the establishment of large-scale farming, rather than having a direct tangible benefit for smallholder farmers.
In the few smallholder-farmed irrigated areas, diesel-powered water pumps are prevalent [14] and—because of their recurrent need for fuel—their operation largely relies on both farmers' finances and public diesel price subsidies [15, 16]. This in turn further burdens national utilities with debt [17], perpetuates reliance on fossil fuels and contributes to local pollution. In addition, climate change—with both delayed wet seasons and more frequent and intense hydrological extremes [18, 19]—combined with the steeply growing regional population [20] and food demand [21], are reasons for immediate action in such adaptation-constrained agricultural systems. Without further action, the region is projected to fall short of feeding its rising population and will fail the SDG2 (zero hunger) target of eliminating undernourishment by 2030 [22].
To promote a transformation of the agricultural system, increase food production and to increase farmer revenues while saving land [23, 24], electrical-powered irrigation is an important input factor [25–33], besides other critical infrastructure and agricultural practices, such as fertilization [10]. Not only is electricity a fundamental input for on-demand water pumping and thus to operate pressurized irrigation systems, but also for processing crop yields to increase their value and preserving them in cold storage facilities. In addition, a strong potential for complementary use of electricity infrastructure between residential and agricultural energy services may exist [34]. Yet, still today most households (about 75% of rural sub-Saharan Africans [35]) and businesses [36] lack reliable electricity access—where intermittency during the day or on a seasonal basis can also be disruptive.
Solar photovoltaic (PV) water pumping is a promising solution to support uptake of irrigation by small-holder farmers [37–41], also as part of the emerging concept of agrivoltaics [42]. According to the International Finance Corporation [43], in SSA the lifetime cost of solar irrigation is one third to 50% lower than that of diesel-based pumping [44, 45], despite upfront costs still being higher (an important barrier for poorer farmers lacking capital). Yet, in cropland cultivated with profitable cash crops the payback time of up-front costs can be as little as about one year [41]. Success stories of rapid irrigation technology uptake have already been observed e.g. in India and South East Asia, where switching from rainfed to irrigated agriculture has allowed farmers to increase their yield significantly in the second half of the twentieth century [46, 47]. This transition has recently gained new momentum and government support in SSA with the rise of solar water pumping. Several studies indicate that the economic prospects for solar pumping are particularly favourable in the context of SSA [48–51] due to the large availability of aquifers and surface water basins [52] combined with high solar irradiance and increasingly cheap PV-powered pumps [53].
To assess the regional economic feasibility of solar irrigation in SSA and inform policymakers and financiers while also evaluating local specificities and differences, it is key to capture the interconnections between the technological, environmental, and the income and food generation potentials of such a technological transition. Previous integrated agronomic, hydrological and technological studies [54–56] in the literature have sought to quantify the techno-economic feasibility of electrical-powered irrigation in different countries or sub-regions of SSA. For instance, Izar-Tenorio et al [57] estimate that small-scale, electricity-powered irrigation may be techno-economically viable in several Ethiopian, Rwandan, and Ugandan districts. Another study by Xie et al [56] estimates a potential for expanded irrigated area of 6–14 million ha in SSA drylands. In parallel, Schmitter et al [39] find that about one fifth of rainfed land in Ethiopia is suitable for solar pump-based irrigation.
Here we devise an open-source, spatio-temporally explicit nexus modelling framework to analyse the economic feasibility of solar irrigation in SSA and some of its potential benefits. Here by economic feasibility we refer the 'degree to which the economic advantages of something to be made, done, or achieved are greater than the economic costs' [58]. To achieve these aims, our analysis builds on a bottom-up agro-hydrological water crop model to estimate the physical water needs to close the currently open irrigation gap (thus avoiding crop water stress), a pumping energy model to appraise infrastructure requirements and costs, and an economic model to quantify the potential costs and induced economic returns, as well as an additional set of co-benefits. Our analysis can support public and private actors working along the water–energy–food–economy nexus wishing to identify economically feasible areas, quantify the potential net economic benefit of developing solar irrigation, and foster sectoral investment.
2. Materials and methods
The analysis presented in this paper is based on an open-source modelling framework (figure 1) that leverages an array of spatially explicit datasets on agriculture, water, energy, costs, and infrastructure, summarized in table SI2, together with a set of numerical parameters (table SI3). The analysis is run at a 0.25° regular grid spatial resolution unit with a monthly scale for water needs assessment and an hourly resolution for PV and pumping systems operation modelling. The modelling framework is divided into four main modules, briefly described here and a comprehensive account of which is found in the SI appendix.

Figure 1. Framework of the analysis. Each round-edged box represents a module of the modelling framework, from the definition of water pumping requirements to their conversion in monetary costs, to the estimation and comparison of solar irrigation total costs and benefits. Blue boxes depict input data; red boxes depict output data; yellow boxes identify the results of the analysis.
Download figure:
Standard image High-resolution imageFirst, we use the Watercrop evapotranspiration model [59] (see SI appendix) to estimate irrigation requirements in terms of (blue) water needs to close the irrigation gap and we calculate the related energy needs to pump water from sources and distribute it to the fields. The analysis considers 19 major crops (table S1) covering about 140 million ha of smallholder farmed cropland, i.e. about half of the entire African continent's agricultural production (on average over the 1961–2019 period) and one third of its total harvested area [60] (while the total rainfed harvested area of SSA stands at 227 million ha [61]). The basket of study crops is chosen in order to consider the most relevant crops for smallholder farmers and cover at least half of the primary production, while also being limited by the variables required as input to the models (e.g. planting and harvesting dates, crop coefficients, crop prices). To carry out this calculation, we use the most up-to-date spatially-disaggregated datasets of crop distribution [61] and productivity, surface and groundwater resources availability [62, 63], while also capturing temporal variability of resource availability. Cropland (harvested) area is delimited to that identified as smallholder farming, based on field size data [64]. This constraint matches the purpose of analysing the potential of solar irrigation for unleashing development opportunities for the rural poor.
In the second module, we carry out a bottom-up sizing and costing of both technological requirements (water pumps; solar PV modules; batteries; irrigation system). Energy requirements are modelled by considering reliance on the least energy-intensive water supply source available locally. Note that in the context of our analysis the PV investment costs considered are breakeven costs with diesel (as derived from Xie et al [45]), as in many countries diesel prices are currently subsidized and may thus make it more challenging for PV to compete with diesel pumps. Our cost assessment advances from simplifications adopted in previous literature by characterising the costs of solar irrigation systems into greater detail. For instance, we leverage a database of real market prices of water pumps and their installation and operation costs to model pump costs for different wattage and aquifer depth levels, and we size and estimate PV costs based on local energy needs, solar irradiation availability and its variation across seasons, and local PV costs (see table SI4 and SI appendix for a detailed account). Sensitivity analysis over crucial cost and technology parameters and assumptions, such as PV and battery costs and water storage tank availability, is carried out.
Third, we estimate both the additional costs from cropland management regime shift (from rainfed to irrigated), such as additional required inputs (e.g. fertilizers, pest management, soil drainage) and labour, and the potential additional revenues from irrigation-increased yields based on production and transport cost-adjusted farm gate prices. To estimate irrigation regime shift cost, we refer to the GTAP v10 database [65] which contains marginal production costs for eight major crop typologies. To estimate potential additional revenues, we first calculate the crop yield growth in response to closing the irrigation gap using the Doorenbos and Kassam [66] empirical relations (see SI appendix). Then, assuming 20 year median wholesale national crop prices as derived from the FAO (and carrying out sensitivity analysis using 20 year maximum and minimum prices) and a partial economic equilibrium, we calculate potential revenues and transportation costs through a simple spatial model of transportation by truck to the nearest wholesale market and the related costs.
Fourth, we seek to compare the estimated location-specific solar panel, pump, and irrigation infrastructure installation and operational costs with the additional revenues linked to the adoption of solar irrigation technology and the costs implied for the farmers. The aim is to evaluate the local economic feasibility of solar PV infrastructure installation through an evaluation of the spatial variability in the net present value of cashflows relative to investment into solar irrigation and the derived payback time (see SI appendix). Note that this analysis is carried out with a baseline discount rate of 15% (sensitivity analysis is carried out) and an assumed system lifetime of 20 years.
With upfront costs being one of the most prominent entry barriers to irrigation for farmers, we also investigate the potential role of 'smart' business models [67, 68] designed to amortise the initial investment (e.g. through loans and microcredit, or governmental subsidy) by defining four additional scenarios: (i) the 'smart investment' scenario, assuming all costs are covered by 'smart' business models; (ii) a scenario where only PV system upfront costs are amortized; (iii) a scenario where only the pump and irrigation system upfront costs are amortized; and (iv) a scenario where all investment cost are faced upfront by farmers.
In addition, we evaluate the sensitivity of solar irrigation requirements and techno-economic feasibility to different CMIP6 (the 6th phase of the Coupled Model Intercomparison Project) anthropogenic climate change scenarios. We run the analysis based on SSP245 and SSP585 multi-model median downscaled outputs [69]. These are two global greenhouse gas emission trajectories leading to moderate to vigorous global warming by 2050. In our modelling framework, climate change is incorporated through two main channels: (i) its impact on evapotranspiration needs, and therefore on water needs for irrigation gap closure; and (ii) its impact on water sources recharge and discharge.
Finally, to go beyond the sole economic feasibility, we use crop nutrient tables to quantify the potential of widespread solar irrigation adoption in terms of increased food production and related nutrients availability, as well as co-benefits for SDG7.1 of universal access to electricity (see SI appendix).
3. Results
3.1. Closing the irrigation gap with solar pumping systems: requirements
To meet the crop evapotranspiration needs and close the irrigation gap in currently rainfed cropland (green water-irrigated only) of SSA, we estimate additional crop blue water demand of 67 km3 yr−1, corresponding to a total yearly blue water withdrawal of 175 km3 yr−1 (inclusive of losses) from surface and ground water bodies. Note that the blue water withdrawal (i.e., gross irrigation requirement) is significantly larger than the blue water demand (i.e. net irrigation requirement) because of water use inefficiencies in the withdrawal and in irrigation systems. This requirement is distributed over about 140 million ha (as derived from MapSPAM input data; figure 2) of smallholder rainfed harvested area (physical area equivalent for multiple growing seasons and crop rotation dynamics) of SSA where currently an irrigation water deficit occurs.

Figure 2. Spatio-temporal distribution of: (A) monthly irrigation blue water requirements to close the crop evapotranspiration gap (km3/month). (B) Monthly energy requirements to pump the estimated water requirements (TWh/month); (C) density of required solar pump (pumps/sq. km of cropland); (D) density of required solar photovoltaic capacity to power water pumps (kW km−2 harvested area); (E) average local required battery capacity (kWh/kW of PV).
Download figure:
Standard image High-resolution imageSub-regional monthly estimates in figure 2(A) highlight spikes in different months of the year that correspond to growing and simultaneously drier seasons of major crops: for instance, in East Africa the main sowing season of staple crops occurs around May and harvest takes place around October (light blue line's spike), while this pattern is anticipated by few months in highly cultivated areas of West Africa, such as Nigeria, Cameroon, and Togo (dark blue line's spike) [70]. To pump those water volumes and irrigate rainfed fields, we estimate 11 TWh yr−1 of electricity requirements, corresponding roughly to the yearly power output of a 3 GW hydropower plant (assuming an average annual capacity factor of 40%).
The spatially explicit results of figure 2 allow identification of hotspots of crop evapotranspiration needs and solar pumping infrastructure requirements: among those areas, large areas in West Africa (28 km3 yr−1, 5.7 TWh yr−1, and 14 million solar pumps), mostly over Nigeria and over the Sahelian strip; the northern part of Mozambique and Tanzania (with 15 km3 yr−1, 1.6 TWh yr−1, and 9.3 million solar pumps required, respectively); the southern part of the DR Congo (7 km3 yr−1, 0.5 TWh yr−1, and 3.9 million solar pumps), and riparian areas of Lake Victoria (2.8 km3 yr−1, 0.6 TWh yr−1, and 1.6 million solar pumps), stand out. A summary of irrigation water and pumping energy requirements by country and by major crops is found in tables SI7 and SI8.
The sensitivity of results from relaxing the small field size constraint suggest (figure SI2(A)) that the estimated regional unmet crop water (and pumping energy) needs do not change drastically as a result of including large-scale cropland patches in the analysis, reflecting the dominance of smallholder farming in SSA. Specifically, field size data suggests that non-smallholder rainfed agricultural land only accounts for 15 million ha, or 10% of the total rainfed harvested area.
On the other hand, as seen from figure SI2(B), environmental flows preservation [71] (in terms of monthly withdrawals not exceeding local groundwater recharge and surface water discharge) represents a significant challenge for sustainably meeting the estimated unmet crop water demand, at least with the existing water infrastructure and management schemes assumed by the analysis. Specifically, we estimate that rainfed agricultural land where environmental flow sustainability constraints might be exceeded (see figure SI11) by less than 25% if irrigation gap closure was pursued without additional actions (e.g. cropping pattern change, land management solutions, fertilization) only accounts for 53 million ha, or 38% of the total rainfed harvested area. Thus, both infrastructure investment (such as reservoirs to convey and store water to mitigate seasonality dynamics) and water resources governance are deemed crucial complementary conditions for the sustainability of a widespread uptake of solar pumps (see section 4).
3.2. Costs, yield gain, and profit potential: the economic feasibility of solar irrigation
The resource and technology results presented so far describe the gross technical requirements under a baseline scenario, i.e. a status-quo analysis assuming current cropping patterns, climate, and water availability. In what follows, the economic feasibility of such physical requirements is assessed. At a region-wide scale, we estimate that over one third of smallholder farmers' unmet irrigation water needs in rainfed cropland (summing to about 60 km3 yr−1 distributed over 55 million ha of harvested area, potentially satisfying 23 km3 yr−1 of crop evapotranspiration needs) could be financially-sustainably equipped with solar irrigation, provided investment conditions are met. This represents about 40% of the total smallholder rainfed harvested area in SSA. This translates into a discounted investment requirement of $62 billion assuming a 20 year lifetime horizon (averaging at $3 billion yr−1), in turn generating potential profits of up to $5.2 billion yr−1, with the largest economic potential in Central and West Africa (figure 3(A)). Altogether, for SSA this corresponds to 11 million solar pumping systems with payback times of less than 20 years. The estimated feasibility areas, number of feasible systems, total investment needs and revenues and profit potentials are summarized table SI7 for each country included in the analysis.

Figure 3. The economic feasibility of solar irrigation in sub-Saharan Africa. (A) Investment requirements, revenue generation potential, and potential profits, for SSA as a whole (left bar) and by sub-region. Figures only include (harvested) areas where solar irrigation is estimated to be economically feasible. Costs are inclusive of upfront capital + operations & maintenance of PV modules with battery, water pumps, irrigation system, and additional production costs, as well as transport to market costs, all amortized over 20 years. (B) Potential costs and profits across economically feasible solar pumping sites in SSA. The y-axis reports the potential local costs/profits per hectare of cropland (harvested) area in response to the adoption of solar irrigation (in log-scale) as a function of the cumulative sum of currently rainfed (harvested) area (x-axis). Note that the x-axis is truncated to display only rainfed cropland area where solar pumping is found to be economically feasible.
Download figure:
Standard image High-resolution imageHowever, profit generation potential from solar irrigation adoption is unequally distributed across agricultural land (figure 3(B)), with about only 10 million ha of rainfed harvested area having potential to generate at least $100 ha−1 yr−1 of profits under current cropping patterns and historical crop prices. This figure grows to 20 million ha of land if a threshold of $50 ha−1 yr−1 is considered. 30 additional million ha show very little profit potential by solar irrigation adoption only, whilst in the additional 100 million ha rainfed harvested area of SSA (not plotted in figure 3(A)), solar irrigation is not found to be economically feasible, at least without further action (e.g. fertilization and cultivated crop shift).
The necessity of lowering risks and the cost of capital is confirmed by a sensitivity analysis on the impact of considering different discount rates (7.5%, 25%, and 40%) than the baseline (15%)—presented in figure SI3. The results show that the discount rate has a significant impact on the lifetime costs, revenues, and profits of potential solar pumps in SSA, and therefore on the number of sites where solar irrigation is estimated to be economically feasible, ranging from around 11 million pumps and $5.2 billion yr−1 of profits under a 7.5% discount rate down to 8 million pumps and about $2.5 billion yr−1 of profits under a 40% discount rate.
Sensitivity analysis for the change in the cost of PV (break even cost with diesel, thus suggesting e.g., a change in the price of diesel, as well as cost change in PV manufacturing costs) reveal the great importance of such cost components (figure SI6), and thus also the potential of incentives. For instance, a 10% reduction in PV & battery costs leads to a near doubling of the number of economically feasible pumps (from 11 to almost 20 million), irrespective of an only marginal decrease in yearly discounted costs. Moreover, sensitivity analysis for crop price variability (an important variable given commodity prices volatility) reveals (figure SI7) that potential profits (and thus economic feasibility) from solar irrigation are also rather sensitive to crop prices. Compared to the baseline scenario of 10 year median prices, 10 year minimum prices imply 35% lower profits and nearly 2.5 million less economically feasible pumps. Conversely, of 10 year maximum prices benefit the feasibility assessment, with 1.3 additional solar pumping systems and 25% higher profits.
As illustrated in the methods, we operate additional scenarios to assess the relevance of business models for the economic feasibility of solar irrigation. The results—presented in figure SI4—reveal that incentives have a notable impact on the number of economically feasible sites. Overall, a business model amortising all upfront costs more than doubles the number of feasible solar irrigation systems, with incentives on the PV system representing the key drivers of such observed impact. This is a crucial finding—consistent with previous literature contributions [72, 73]—highlighting the need of lowering upfront barriers if decentralized solutions are to become widespread in SSA. Finally, we also evaluate an array of other sensitivity scenarios, including consideration and exclusion of battery storage from the PV system, solar PV value added tax (VAT) and import costs exemption, as well inclusion of a water storage tank (see SI).
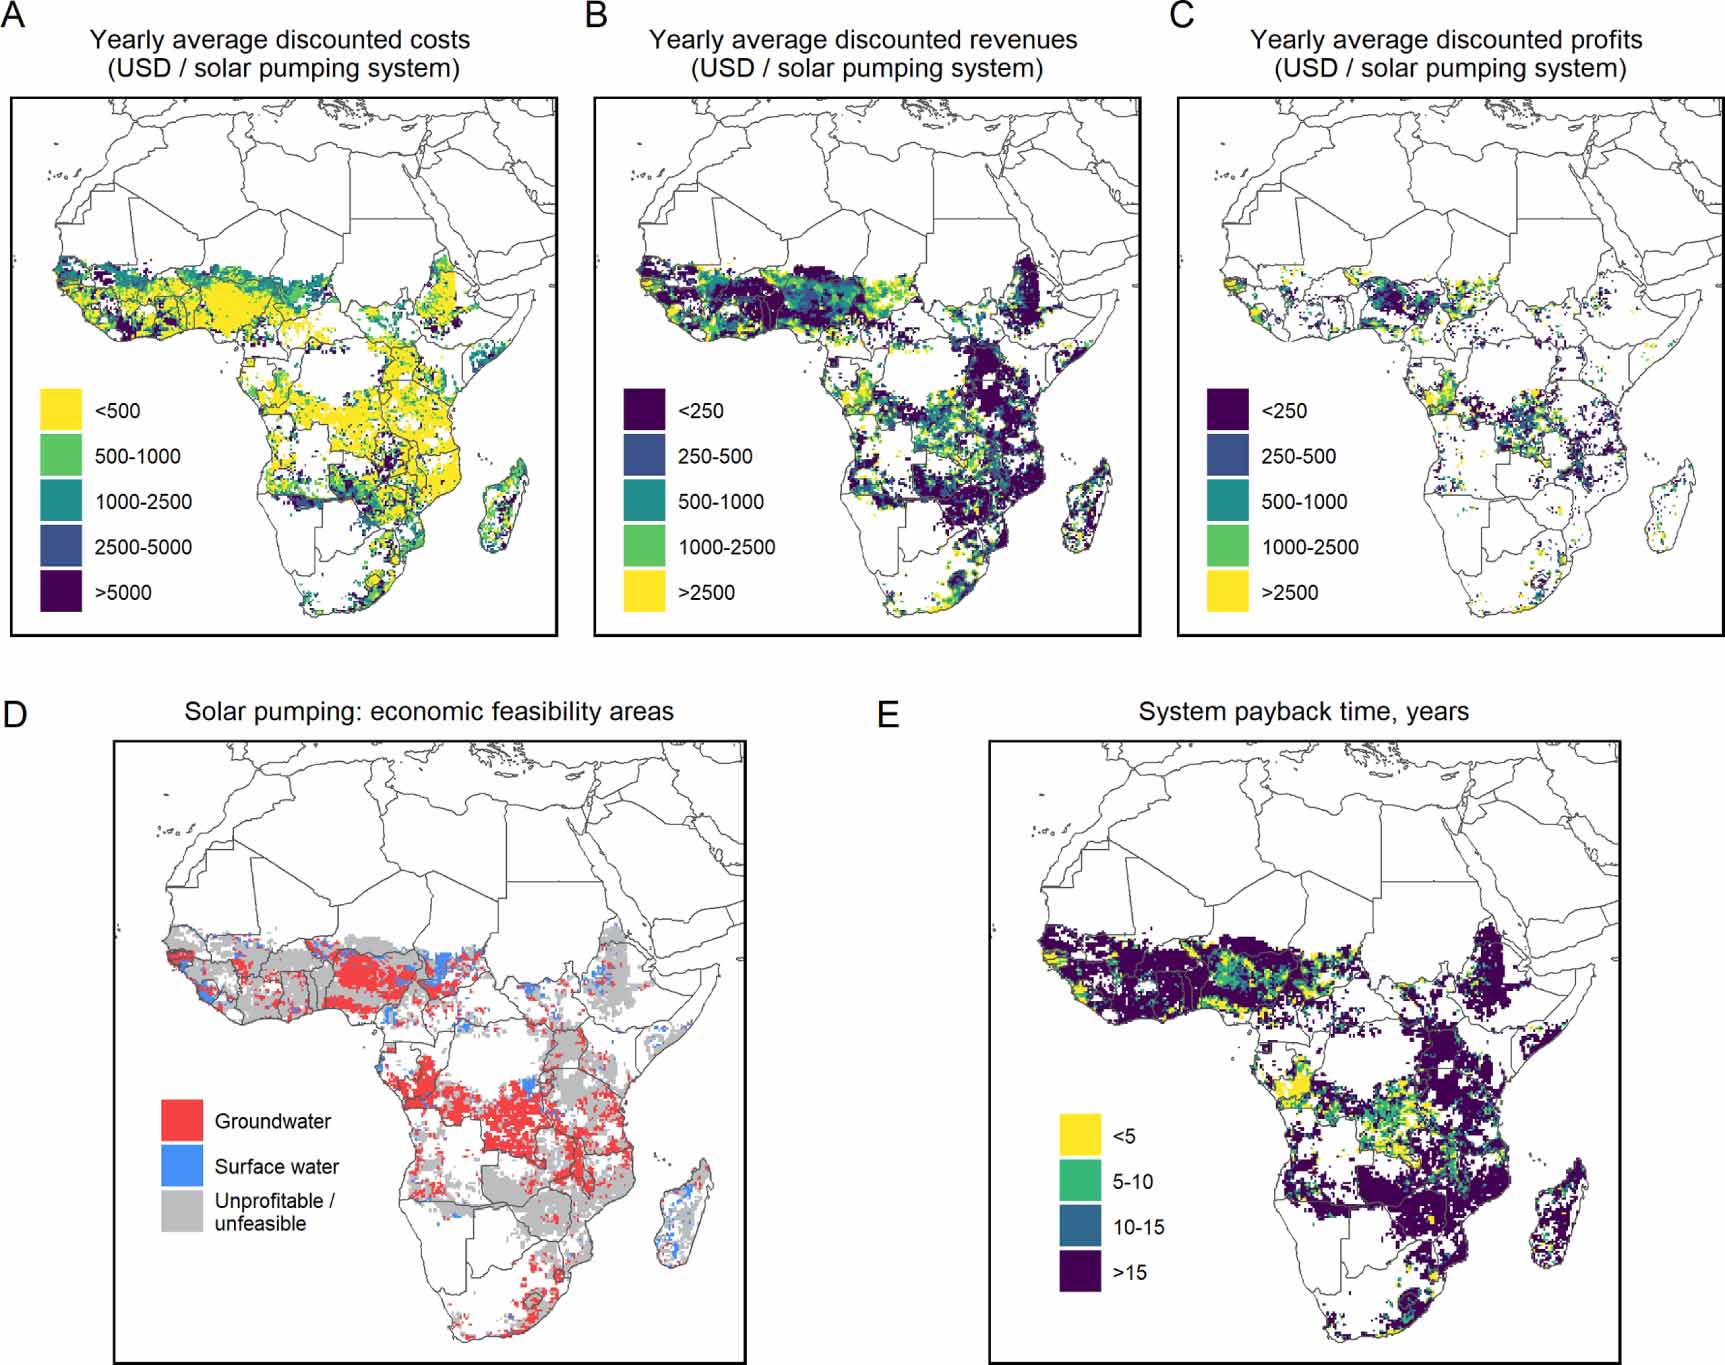
When looking at the spatial distribution of economic estimates (figure 4), we find solar irrigation to be feasible and profitable in large part of the southern Democratic Republic of the Congo, the Congo Republic, vast areas of Nigeria, regions along Sahel, as well as croplands in Tanzania and Malawi. Other scattered feasibility areas are distributed across the continent, e.g., districts of Kenya, Ethiopia, Zimbabwe, Madagascar, Angola, South Africa, South Sudan. Conversely, sites found not to be suitable for solar irrigation (figure 4(D)) consist of areas where either water sources are hard to access (e.g. deep groundwater wells and remote surface water sources), PV potential is reduced, currently cultivated crops would not benefit substantially from the input of irrigation systems in terms of yield response and thus revenue generation potential, or remote areas where overall costs are higher than potential revenues.

Figure 4. Local economic analysis of solar water pumping systems assuming a 20 year system lifetime and a 15% discount rate. (A) Yearly average discounted cost of a system inclusive of the pump, the PV system, and the battery, including initial investment and installation and O&M costs, as well as production and transport cost of yield to market. (B) Yearly average discounted revenues from increased crop productivity due to new irrigation assuming current cropping pattern and recent national crop prices. (C) Difference between yearly average discounted revenues and costs (for profitable areas only). (D) Economic feasibility areas and optimal water pumping sources. (E) Local solar pumping systems estimated payback time, in years.
Download figure:
Standard image High-resolution imageFinally, it is relevant to examine the distribution of the modelled technological and economic indicators to understand the range of values and variability that emerge in different locations where solar pumping is found to be an economically feasible investment.
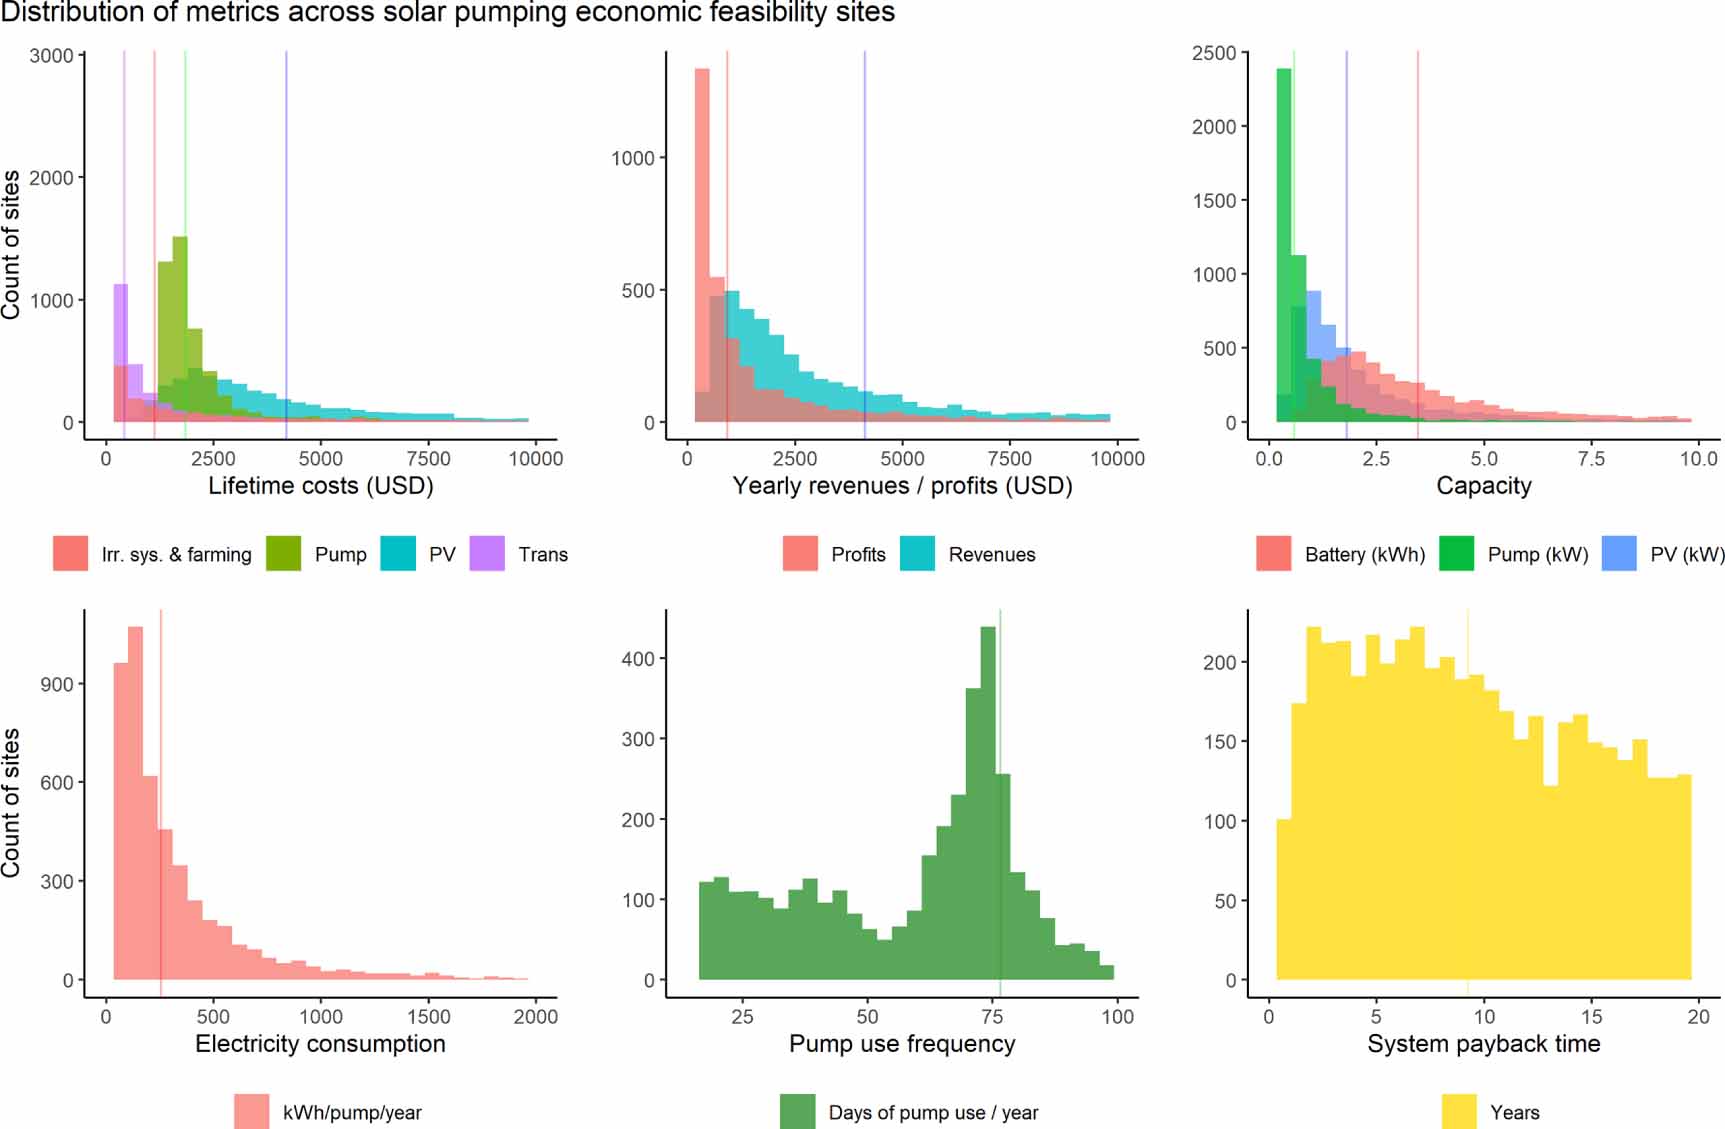
An analysis of the distribution of key indicators from the local techno-economic analysis (figure 5) suggests that the mean size of a pumping system in our analysis is about 0.6 kW, with a solar module of 1.8 kW and a battery of capacity 3.5 kWh. This translates into a mean lifetime discounted system cost of about $7600 (of which $4200 for the PV system; $1850 for the pump; $1150 for the irrigation system and farming costs; and $430 for transport) in turn generating mean revenues and profits for around $4100 and $930 yr−1, respectively. Notably, we calculate a mean utilization rate of about 75 days per year (under the modelling assumption that irrigation is performed every second day during the cropping season). This usage pattern translates into a mean electricity consumption of about 255 kWh/pump/yr. Finally, the mean system payback time of economically feasible sites is estimated to be below 10 years.

Figure 5. Distribution of solar pumping sites metrics across economic feasibility areas (A) Histogram of cost components; (B) histogram of revenues and profits; (C) histogram of technological requirements; (D) histogram of electricity consumption; (E) histogram of pump use frequency; (E) histogram of system payback time. Vertical lines describe the mean values in each variable distribution.
Download figure:
Standard image High-resolution image3.3. Co-benefits: food security and energy access
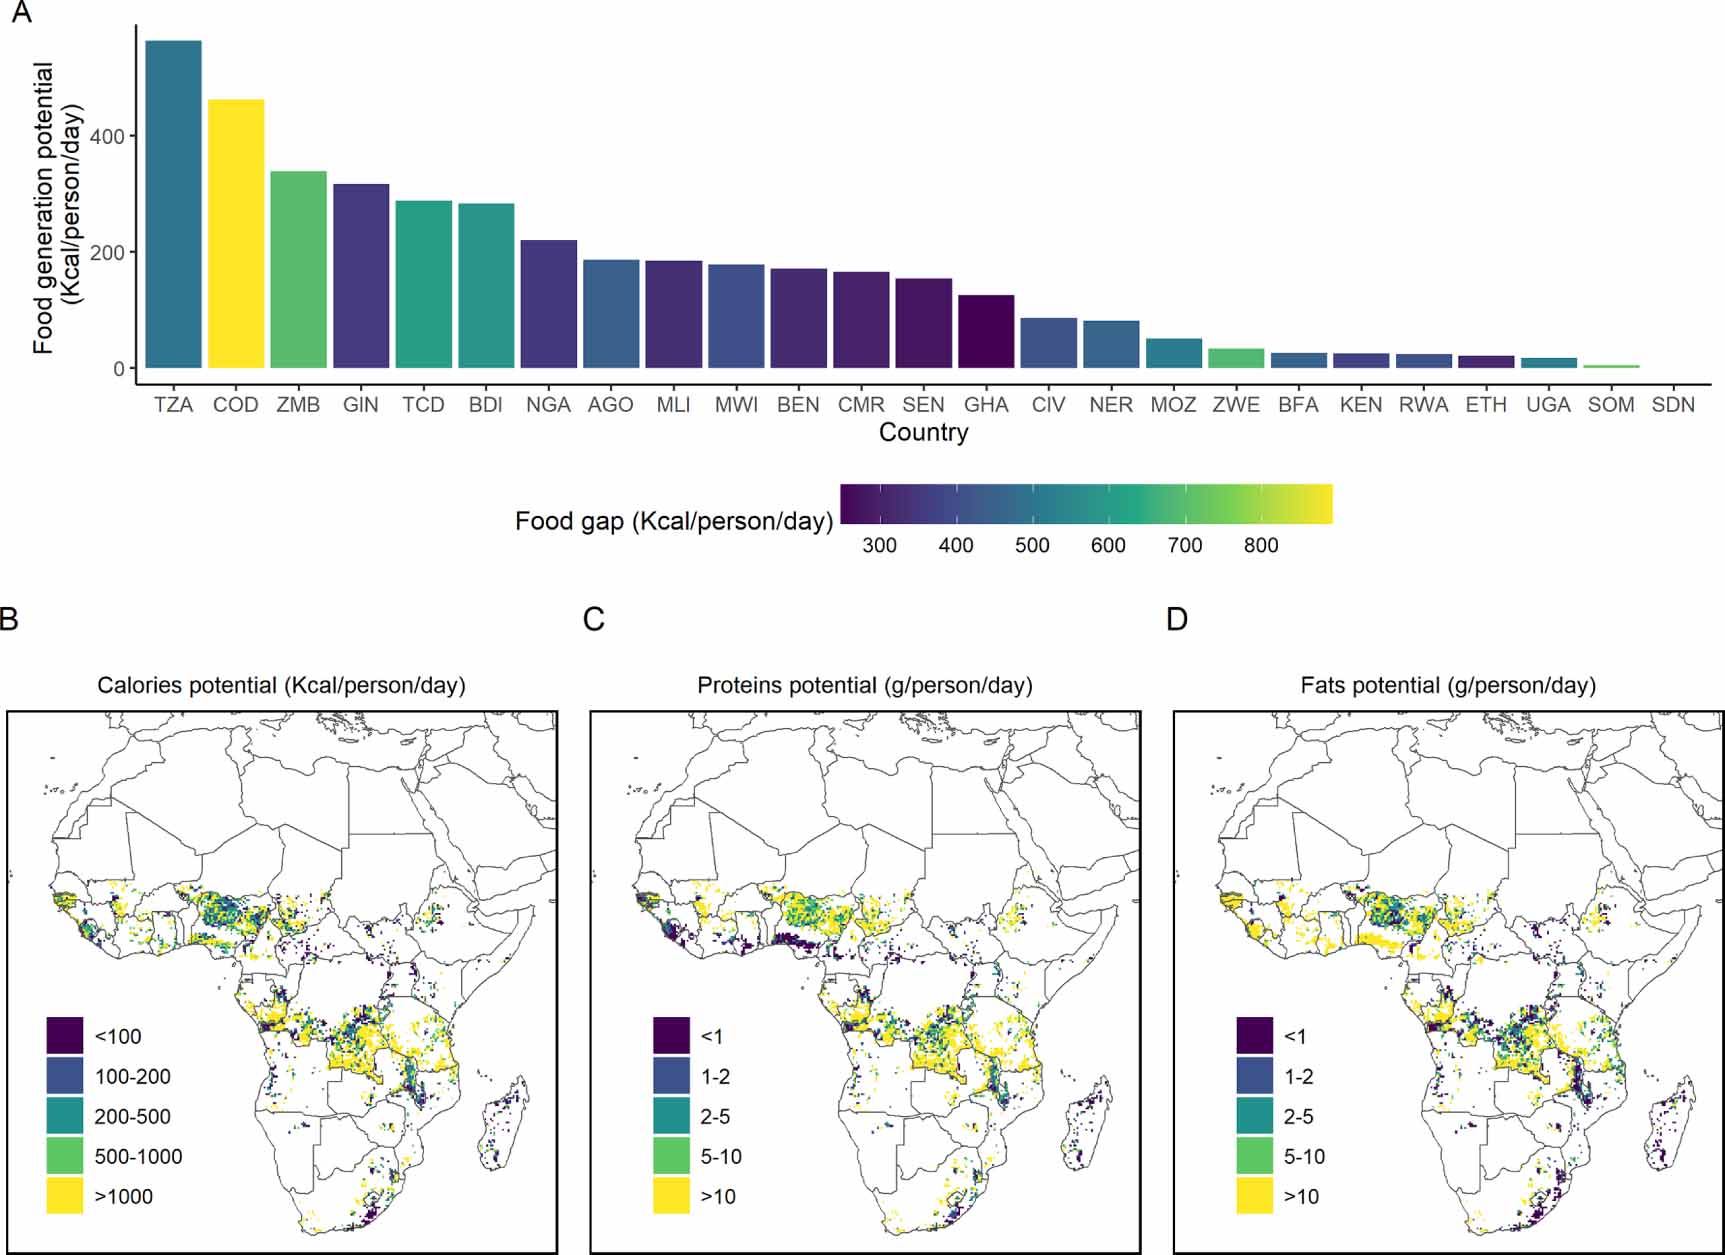
To complement the techno-economic analysis, we estimate potential co-benefits of large-scale solar pumps adoption, restricting this assessment to areas where solar irrigation is estimated to be economically feasible. Firstly, to determine co-benefits to SDG2, we calculate that the transition could positively impact food security, generating an additional 187 kcal and about 3 and 7 protein and fat grams per capita per day, respectively across SSA (based on FAO representative crop nutritional contents, table SI5). Considering that these are regional average values, these represent significant gains if compared to the average requirements of 2000 kcal/day, 50 g proteins/day, and 60 g fats/day [74]. Such potential gains are also very relevant from a food self-sufficiency point of view, which is a strategic priority for many developing countries.
As seen from figure 6 (the numbers are also summarized in table SI9), we find substantial inequality in terms of food production growth thanks to solar pumps adoption across SSA countries, with some nations, such as the Republic of Congo [COG] (+2000 kcal/person/day), Tanzania [TZA] (+700 kcal/person/day) and Guinea [GIN] (+440 kcal/person/day), showing significant potential to close their national caloric gaps and even increase their food exports, while others with substantial food gaps, like Somalia, Zimbabwe, Liberia, Central Africa, Republic and Uganda (see table SI9), requiring larger imports than the estimated yield growth potential to achieve national food security.

Figure 6. Food security implications of solar pumping adoption: country-level results for calories vs. food gap. The figures only depict of areas where solar pumping is found to be economically feasible. (A) Country-level (ISO3 codes) bar plot of potential total caloric generation potential due to crop yield growth induced by irrigation (x-axis) and current caloric gaps [60] (fill colour). (B), (C), (D) Maps of potential calorie generation potential (Kcal/person/day), protein generation potential (g/person/day) and fat generation potential (g/person/day). Note: country names are reported as ISO3 codes. The numbers of panel A are summarized in table SI9.
Download figure:
Standard image High-resolution imageFinally, across SSA, we estimate more than 33 GWh/day of potential residual power (electricity output from economically feasible solar pumping systems' PV module which is not used for water pumping) i.e., about 12.5 TWh yr−1, distributed as shown in the maps in figure SI10. To give a reference, the yearly total (i.e. inclusive of all sectors) final electricity consumption of Nigeria, the most populous country of SSA (206 million people, nearly half of which live without access to electricity), is 27 TWh yr−1 [75].
3.4. Climate change implications
Figure 7 (panel (A)) demonstrates that the total unmet crop evapotranspiration needs in currently rainfed cropland range from about 67 to about 95 and 100 cubic kilometres per year in SSP245 and SSP585 scenarios in 2050, respectively. In addition, with growing climate change impacts the proportion of sites where solar irrigation is not found to be feasible for economic or environmental barriers grows (figure 7(B)) from 64% to about 70%. An unbounded pumping scenario displays significantly larger (82%) share of feasible sites and groundwater resources exploitation than an environmental flows preservation scenario (55% of sites).

Figure 7. Climate change implications for irrigation and solar pumping feasibility in baseline climate, SSP245 and SSP585 scenarios. (A) Climate change impact on unmet rainfed crop evapotranspiration needs; (B) climate change impact on solar irrigation feasibility and shares of optimal withdrawal source in unbounded and environmental flows preservation scenarios; (C) climate change impact on pumping energy needs in unbounded and environmental flows preservation scenarios in sites where solar irrigation is economically feasible (in each scenario); (D) unmet groundwater irrigation demand due to climate change in the environmental flows preservation scenarios; (E) climate change impact on food yield potential due to solar irrigation adoption from cropland (harvested) area that is economically suitable for solar irrigation; (F) climate change impact on cropland (harvested) area that is economically suitable for solar irrigation.
Download figure:
Standard image High-resolution image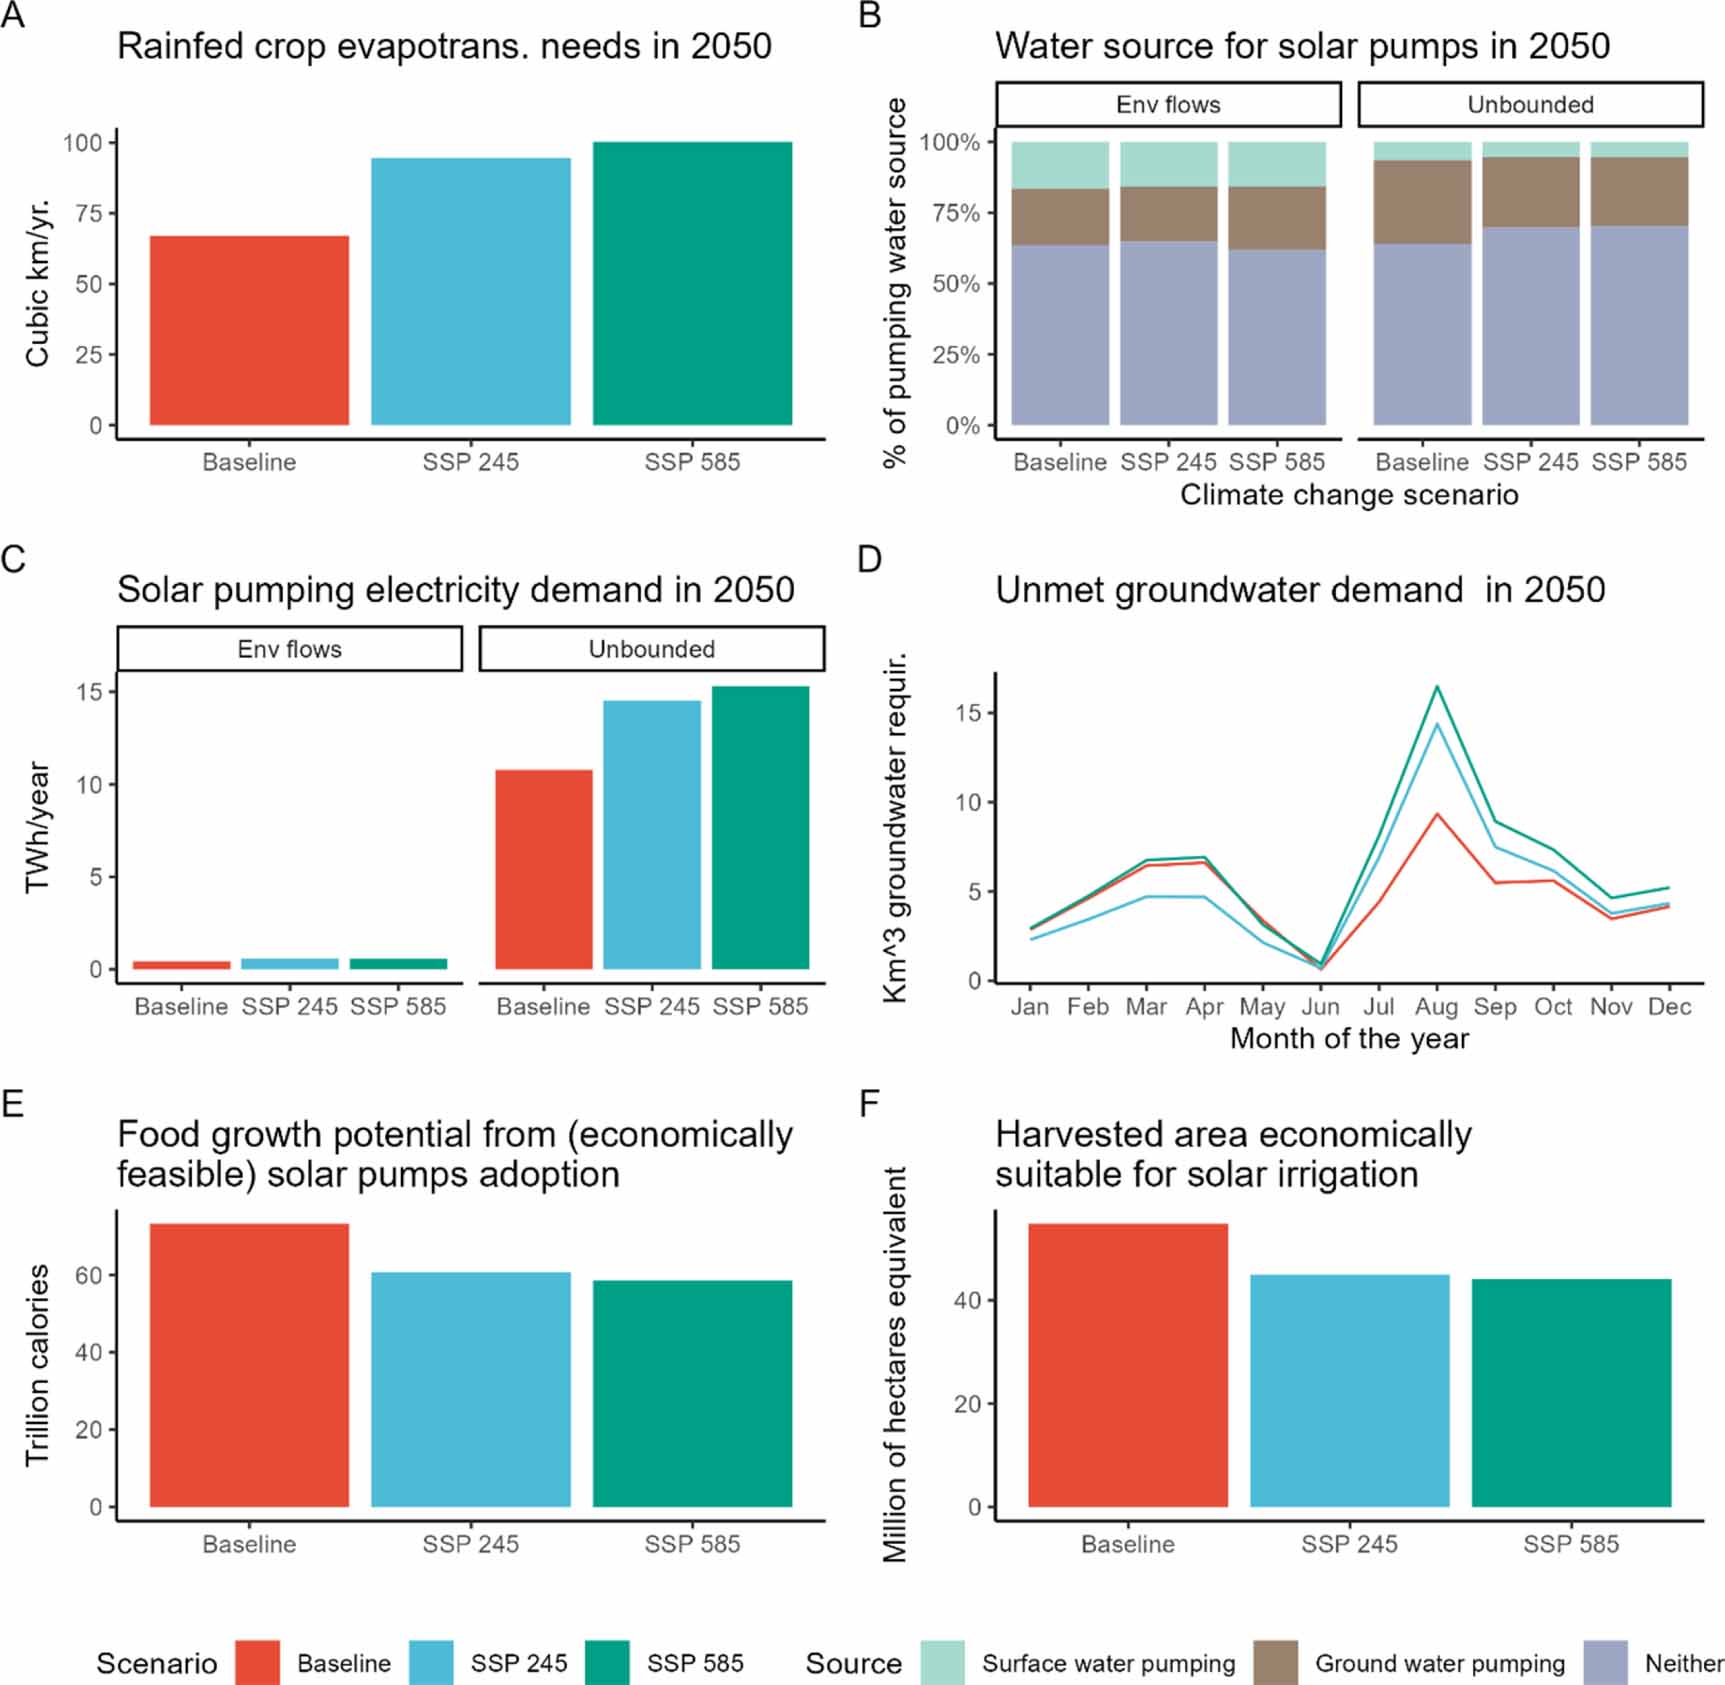
In terms of the implied electricity demand for water pumping in the three climate scenarios for the two variants (figure 7(C)), we observe a striking difference in pumping rates (and thus energy consumption) between an unbounded pumping and environmental flows preservation scenario (from 11 to 0.5 TWh yr−1) because of potential overexploitation of ground water aquifers and surface water sources. Moreover, we estimate a considerable energy demand growth with climate change compared to under historical climate conditions observed in the unbounded pumping scenario (growing to 14–15 TWh yr−1).
To conclude, we quantify the monthly gap between the groundwater withdrawal needs for irrigation gap closure and the maximum amount of extractable water, showing that the gap grows substantially with growing global warming (from 57 to 61–76 km3 yr−1), and reaches critical levels in high demand periods (figure 7(D)), e.g. from 9 to 14–17 km3 in August. Finally, the analysis reveals that both the harvested area extent suitable for solar irrigation and the additional potential food yield decline (from 55 to about 45 million ha and from 73 to 59–61 trillion Kcal yr−1, respectively) under warming climate futures, reduces food security and development prospects (figures 7(E) and (F)).
4. Discussion
4.1. The techno-economic feasibility of solar pumps
Our study estimates that SSA is facing an unmet blue water demand of 67 km3 yr−1 over smallholder farmed rainfed cropland for the 19 crop types considered. This estimate compares well with previous studies, e.g. the value obtained by Rosa et al [30] under a baseline scenario assuming irrigation expansion over rainfed areas to cope with water stress and increase production and, thus, the number of people fed. Our analysis suggests that over one third of such unmet water needs—distributed over about 55 million ha of (harvested) area—could be supplied with solar irrigation (with 10 million ha with a profit potential >$100 ha−1yr−1). This translates into a requirement of 11 million solar pumping systems. For reference, Indian farmers currently irrigate their fields with more than 30 million agro pump-sets [76], of which about 8 million are off-grid. Of those, according to the most recently available survey, about 250 thousands are solar pumps, and the Indian government has set an ambitious objective of achieving 2 million solar pump installations by the end of 2022 [77].
To finance those installations, a region-wide cumulative discounted investment requirement of $62 billion is estimated assuming a 20 year lifetime horizon, in turn generating potential additional (on top of baseline crop yield) revenues of over $8 billion yr−1. Areas where solar pumps cannot be paid back within 20 years are not deemed suitable and thus excluded from these gross figures. In addition, we estimate that the transition could positively impact food security and general access to energy services. Altogether, these results suggest that solar pumps bear significant economic feasibility potential. This goes in the same direction of previous analysis, e.g. Dalberg and Efficiency for Access Coalition [78] estimates that the market for solar water pumps in SSA will expand to as many as 2.8 million households and a value of $1.6 billion per year by 2030.
While electricity access is crucial directly on farms, it is also a core issue (SDG7.1) for most other sectors in rural SSA, and primarily for residences, education, healthcare, and small and medium enterprises. In our analysis, we size PV systems based on the site-specific water pumping needs. However, on certain hours of the day and seasons of the year when irrigation is not required, such PV systems might be employed for other purposes, especially if PV modules are transportable. We estimate about 12.5 TWh yr−1 of residual power output not used for pumping and potentially usable for other energy services such as crop processing and home uses, provided appliances are available to households and farmers. Nonetheless, it is important to bear in mind that this excess PV output is unevenly distributed over space and time depending on the irrigation schedule and is thus likely not sufficient to cover all needs at home and on the farm for farmers. Nonetheless, it might provide an important first step along the energy ladder [79, 80] and enable some additional energy services such as raw crop processing.
4.2. Unleashing investment and promoting sectoral governance: policy outlook
Once techno-economic potential is demonstrated, the challenge moves to the implementation side. In fact, despite promising prospects [39, 81–84], the uptake of solar pumps in SSA is still very low. The current implementation of solar irrigation in many parts of SSA is driven by donors including European countries, non-governmental organizations, World Bank, and other UN agencies.
To put solar irrigation infrastructure on the ground at a large-scale and achieve the potential estimated in this study, private capital (also as part of public–private partnerships) is indispensable. As demonstrated by recent research [72, 73] and through our business models simulation analysis, upfront costs, capital cost, and private discount rates represent a key barrier for successful large-scale uptake of decentralized energy infrastructure in the region, including solar irrigation systems. In turn, these factors depend on the quality of national and regional regulatory frameworks and institutional arrangements. To achieve rapid solar technologies uptake in SSA and mirror examples such as India [85], techno-economic potential is in fact not sufficient. Public–private local research and development (R&D) programs [85] in the sector—both nationally and regionally—are a necessary condition for tapping the estimated techno-economic potential: enabling regulatory, market and governance conditions are in fact crucial to ensure a lower cost of capital and market penetration of private capital for decentralized service supply technologies [73].
It is the responsibility of public decision-makers to create the right policies, incentives, and investment environment for private companies to develop, install, and manage this infrastructure and deploy solar irrigation on a large scale and farmers to invest and gain capacity to use these. Future uptake will largely depend on government subsidies and regulatory reform [86, 87], as well as on the use of smart business models [88] by solar pump supplying companies, as it is estimated that it generally takes 6–12 months of income for a typical farming household to cover upfront system costs [78].
Another key challenge to ensure increased solar pumps uptake and sustained utilization is the consideration of technical knowledge and materials availability, including technical skills to be able to repair the system when it breaks, as well as social norms and structures, such as the acceptability of solar irrigation and the establishment of shared ownership models for groups of farmers and smallholder consortia. This goes beyond the sole infrastructure uptake issue, but it also includes consideration of capacity development over farming practices, including irrigation management, fertilization, pest control, crop rotation, and extensification–intensification trade-offs. Only when all these dimensions are accounted for by both public decision makers promoting a transformation of the agricultural system and private retailers providing and installing systems can a successful uptake and positive development impacts be experienced.
Finally, besides uptake and private use of solar pumps by farmers, several institutional and socio-environmental aspects are of great importance, despite being beyond the scope of this paper. Irrigation infrastructure, in particular when sprinklers and pumps are used, requires intensive maintenance and water withdrawals need to be monitored by dedicated public authorities to avoid 'tragedy-of-the-commons' issues [89] such as overuse of water, declining groundwater tables, and salinization. Sustainable irrigation requires strong institutions responsible for developing and enforcing rules to avoid unsustainable water use practices, which will be a key development priority for SSA policymakers [90].
5. Conclusions
Our study represents an important advance compared to previous large-scale regional assessments of the economic feasibility of solar irrigation. The analysis seeks to map local-to-regional feasibility of solar irrigation in SSA to inform policymakers and financiers while capturing the interconnections between the technological, environmental, and the income and food generation potentials of such a technological transition.
The code and underlying data of the analysis are made publicly available for replication and testing of different assumptions and scenarios. A caveat is that, while inclusive of a discount rate, the economic figures are subject to risk adjustment considerations from private investors and price shifts in response to a growing supply under a fixed demand, at least in the short run.
To advance our analysis, future research might explore scenarios of cropland extension and changing cropping patterns to better inform investigations of future water and energy needs and estimations of impacts of climate change on both the water and energy requirements for irrigation, and cost-benefit analyses of solar pumping in different areas. In addition, besides irrigation, agricultural mechanization and fertilization, as well as the adoption of different seed varieties and land management practices are all crucial factors that should be considered in future studies assessing integrated investment strategies to close the yield gap in SSA [10]. The interactions between these factors and impacts are complex, as they likely entail not only local transformations but also, for instance, variability in local to global inputs and crop prices. A structural, forward-looking analysis is beyond the scope of this paper but would represent a very valuable advance to the results presented here.
Data availability statement
The data and source code that support the findings of this study are openly available at the following URL: https://github.com/giacfalk/solar_irrigation.
Conflict of interest
The authors declare no competing financial interests.
Supplementary methods and results (1.2 MB PDF)