

Abstract
An ensemble of 28 models from the 6th Coupled Model Intercomparison Project was used to project future changes in annual mean precipitation over East China during 2046–2065 relative to 1995–2014 under the SSP2-4.5 scenario. A precipitation increase of 0.16 mm d−1 is projected over North China by the multi-model ensemble (MME) mean. However, large model uncertainty exists over South China (SC), reducing the fidelity of the MME mean projection. Thus, a clustering-based MME probabilistic projection is presented that projects four possible SC precipitation changes in the future. Precipitation increases are projected in Cluster 1, Cluster 3 and Cluster 4 for 0.51 mm d−1, 0.2 mm d−1 and 0.23 mm d−1, respectively, with occurrence probabilities of 14.3%, 35.7% and 25%, respectively. Conversely, the projected Cluster 2 precipitation decrease is 0.01 mm d−1 with an occurrence probability of 25%. The differences in precipitation change are mainly contributed by dynamic effect due to different circulation changes across clusters. During extended summer, different circulation anomalies over western North Pacific (WNP) among clusters arise from the sea surface temperature anomaly (SSTA) warming patterns over the equatorial central-eastern Pacific, which explain the different precipitation increases over SC. During extended winter, a strong zonal SSTA gradient between the South China Sea and adjacent WNP is projected in Cluster 2, stimulating a zonally vertical cell with anomalous descent over SC and resulting in markedly decreased precipitation. A similar but much weaker zonal SSTA gradient and circulation anomaly are projected in Cluster 3. Distinct meridional SSTA gradients over the WNP are projected in the rest clusters, stimulating shifted descents with a weak effect on SC precipitation.
Export citation and abstract BibTeX RIS

Original content from this work may be used under the terms of the Creative Commons Attribution 4.0 license. Any further distribution of this work must maintain attribution to the author(s) and the title of the work, journal citation and DOI.
1. Introduction
Influenced by a series of dynamic processes from local to large scales, precipitation change in the context of global warming varies greatly by region, posing a serious challenge to precipitation projections (Lee et al 2021). Studying how precipitation will change in the future is of great significance because such information is a precondition for estimating the potential impacts of climate change (Chen et al 2011).
Climate models are useful tools for projecting precipitation changes, although uncertainties due to model inaccuracies are inevitable (Chen et al 2014, Li et al 2021, Zhu et al 2021). Uncertainties in precipitation projections are mainly due to three factors: model uncertainty, emission scenario, and natural internal variability (Hawkins and Sutton 2009, Deser et al 2012). Although natural internal variability plays a significant role in 21st century near-term projections (Ting et al 2009, Deser et al 2012, Huang et al 2020), model uncertainty dominates the uncertainties in middle-term and long-term projections (Zhou et al 2020, Chen et al 2020). The multi-model ensemble (MME) mean is a promising way to reduce model biases as it has been shown to outperform any single model in simulating the present-day climate (Gleckler et al 2008). Regional precipitation projections, however, usually show large discrepancies among models, and different models sometimes project completely contrary precipitation patterns. If a large inter-model spread exists, the MME mean becomes less reliable since it is likely to project a distorted precipitation pattern and intensity, and incorrectly filter out useful information. Moreover, the MME mean is usually conducted grid-point-by-grid-point, neglecting the physical interdependence between grid-points and resulting in a loss of information regarding coordinated changes between grid-points (Knutti et al 2010). For example, Madsen et al (2017) indicated the issue of inflated uncertainty in regional MME climate projections made on the assumption that all grid-points reach extreme values simultaneously.
Another way to interpret the MME is by clustering of ensemble members, thus reducing the number of ensemble members into relatively few groups. This method is frequently used to identify weather and climatological regimes in ensemble forecasting (Tracton and Kalnay 1993, Molteni et al 1996), and to process variables with large spatiotemporal variances, e.g., precipitation (Johnson et al 2011). Although not as concise as one single MME mean, clustering could provide a big picture when more diverse details are needed.
Given the above problems, using an ensemble of 28 state-of-the-art models that participate in the 6th Coupled Model Intercomparison Project (CMIP6), we aim to project the near-future changes as well as the uncertainty in annual mean precipitation over East China, and analyze the physical processes driving this inter-model uncertainty. The structure of this paper is as follows. Section 2 describes the data and methodology. Section 3 provides the projected precipitation changes and the possible physical processes responsible for the model uncertainty. The conclusions and discussions are summarized in section 4.
2. Observational data, models and methodology
2.1. Observational data
The observational precipitation data covering mainland China on a 1° × 1° grid were obtained from the CN05.1 dataset, produced by the National Climate Center of the China Meteorological Administration from over 2400 observation stations over China (Wu and Gao 2013); this dataset has been widely used in previous studies (Yin et al 2014, Yang et al 2021, Gao et al 2023).
2.2. Models and their performance in simulating present-day precipitation
The monthly outputs of 28 CMIP6 models from historical and SSP2-4.5 scenario simulations were used. The models' detailed information is summarized in table 1. All datasets were interpolated into 1° × 1° grids using the bilinear interpolation method.
Table 1. The institutions responsible for, countries of origin and resolutions of the 28 CMIP6 models.
| Model | Institution and country | Resolution (lat × lon) |
|---|---|---|
| ACCESS-ESM1-5 | Commonwealth Scientific and Industrial Research Organization, Australia | 1.25° × 1.875° |
| AWI-CM-1-1-MR | Alfred Wegener Institute, Helmholtz Centre for Polar and Marine Research, Germany | 0.9375° × 0.9375° |
| BCC-CSM2-MR | Beijing Climate Center, China | 1.125° × 1.125° |
| CAMS-CSM1-0 | Chinese Academy of Meteorological Sciences, China | 1.125° × 1.125° |
| CESM2 | National Center for Climate Research, USA | 0.9375° × 1.25° |
| CMCC-CM2-SR5 | Centro Euro-Mediterraneo sui Cambiamenti Climatici, Italy | 0.9375° × 1.25° |
| CNRM-CM6-1 | National Centre for Meteorological Research, France | 1.4062° × 1.4062° |
| EC-Earth3 | EC-Earth-Consortium, Sweden | 0.7031° × 0.7031° |
| FGOALS-f3-L | Chinese Academy of Sciences, China | 1.0° × 1.25° |
| FGOALS-g3 | Chinese Academy of Sciences, China | 2.25° × 2.0° |
| FIO-ESM-2-0 | First Institute of Oceanography, China | 0.9375° × 1.25° |
| GFDL-ESM4 | NOAA, Geophysical Fluid Dynamics Laboratory, USA | 1.0° × 1.25° |
| GISS-E2-1-G | NASA, Goddard Institute for Space Studies, USA | 2.0° × 2.5° |
| HadGEM3-GC31-LL | Met Office Hadley Centre, United Kingdom | 1.25° × 1.875° |
| IITM-ESM | Indian Institute of Technology Madras, India | 1.875° × 1.875° |
| INM-CM5-0 | Institute for Numerical Mathematics, Russia | 1.5° × 2.0° |
| IPSL-CM6A-LR | Institute Pierre Simon Laplace, France | 1.25° × 2.5° |
| KACE-1-0-G | National Institute of Meteorological Sciences and Korea Meteorological Administration, South Korea | 1.25° × 1.875° |
| MCM-UA-1-0 | Department of Geosciences, University of Arizona, USA | 2.0° × 3.75° |
| MIROC6 | Atmosphere and Ocean Research Institute, The University of Tokyo, Japan | 1.4062° × 1.4062° |
| MIROC-ES2L | National Institute for Environmental Studies, The University of Tokyo, Japan | 2.8125° × 2.8125° |
| MPI-ESM1-2-HR | Max Planck Institute for Meteorology, Germany | 0.9375° × 0.9375° |
| MPI-ESM1-2-LR | Max Planck Institute for Meteorology, Germany | 1.875° × 1.875° |
| MRI-ESM2-0 | Meteorological Research Institute, Japan | 1.125° × 1.125° |
| NESM3 | Nanjing University of Information Science and Technology, China | 1.875° × 1.875° |
| NorESM2-LM | Norwegian Climate modelling Consortium, Norway | 1.875° × 2.5° |
| NorESM2-MM | Norwegian Climate modelling Consortium, Norway | 0.9375° × 1.25° |
| UKESM1-0-LL | Met Office Hadley Centre, United Kingdom | 1.25° × 1.875° |
The models' performances in simulating the present-day (1995–2014) climatological annual mean precipitation over East China were evaluated with a Taylor diagram and the Taylor Skill score (TS score, figure 1). The simulated present-day precipitation patterns were comparable to the observations, with a pattern correlation coefficient exceeding 0.92 and TS score exceeding 0.79, suggesting that these models are suitable to project future changes in precipitation over East China.

Figure 1. (a) Taylor diagrams of the simulated climatological annual mean precipitation over East China for the 1995–2014 period. (b) Weights of 28 CMIP6 models calculated using the rank method according to the Taylor skill score.
Download figure:
Standard image High-resolution image2.3. Methodology
The near-future changes in annual mean precipitation over East China during 2046–2065, relative to 1995–2014, under the SSP2-4.5 scenario were projected with an ensemble of 28 models. Two kinds of MME mean approaches were employed: the simple arithmetic mean (AM), and rank-based weighting mean (Rank-mean). In the Rank-mean approach, the models were ranked by their performance and given different weights in simulating the present-day climatological precipitation measured by the TS score (Chen et al 2011). The uncertainty associated with the MME mean projection was tested using the signal-to-noise ratio (Zhou and Yu 2006, Li and Zhou 2010).
In addition to the MME mean projection, clustering-based MME probabilistic projections were employed, in which clustering analysis was performed on the 28 projected precipitation change patterns using Ward's agglomerative hierarchical clustering method (Ward 1963, Gong and Richman 1995). The principle of Ward's clustering method is to minimize the total within-cluster variance. The clustering process starts from 28 clusters (28 models in the ensemble), and the initial distance between clusters is set as the squared Euclidean distance between their spatial patterns. In implementation, the two-dimensional precipitation change field projected by each model was treated as the respective vector (41 × 35 = 1435 grid points). Then, in each step, the two closest clusters are merged, and the distances are updated using the algorithms described in Müllner (2011) and Gong and Richman (1995), as follows:
where  is the newly merged cluster consisting of clusters
  and
and  ,
,  is an unused cluster,
  is the cardinality of its argument,
  , and
, and  is the distance between the two clusters. An objective method to determine the stopping level of the clustering process is to inspect the distance between merged clusters. The clustering process stops when this distance jumps markedly, i.e., when a 'kink' appears in the 'elbow method' (Thorndike 1953). After clustering, the ensemble mean within each cluster is calculated to represent this cluster. The occurrence probability of each cluster is defined using the relative frequency as the ratio of the number of models within this cluster to the total number of models.
3. Projected future precipitation changes and associated uncertainty
3.1. Model-projected future precipitation changes
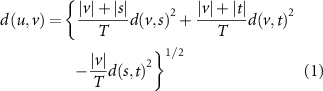
The changes in annual mean precipitation over East China during 2046–2065, relative to 1995–2014, under the SSP2-4.5 scenario were projected by the 28 individual models. Obvious differences are found among the models, especially in South China (SC). Three typical projections by GISS-E2-1-G, HadGEM3-GC31-LL and GFDL-ESM4 are shown in figures 2(a)–(c). GISS-E2-1-G projects a north-increasing-south-decreasing pattern. HadGEM3-GC31-LL projects a more or less uniformly increasing pattern with stronger increases over the Yellow River basin and SC. GFDL-ESM4 projects a north-decreasing-south-increasing pattern, generally opposite to the GISS-E2-1-G projection.
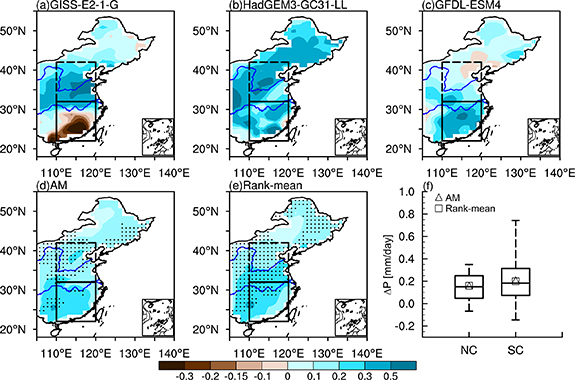
Figure 2. Spatial patterns of annual mean precipitation changes (units: mm d−1) over East China during 2046–2065 relative to 1995–2014 under the SSP2-4.5 scenario as projected by (a)–(c) the 3 typical CMIP6 models and the (d) arithmetic mean (AM) and (e) rank-based weighting mean (Rank-mean) of the 28 CMIP6 models. The dashed box indicates North China (NC, 32° N–42° N, 110° E–120° E), and the solid box indicates South China (SC, 22° N–32° N, 110° E–120° E). (f) Boxes indicate the inter-model spread (i.e. the 25th and 75th quantiles), the horizontal lines indicate the median values, and the whiskers show ensemble ranges of regional averaged precipitation changes over NC and SC. The dotted areas (d), (e) indicate that the signal-to-noise ratio is larger than 1.
Download figure:
Standard image High-resolution imageIn addition to individual model projections, the MME means obtained using the AM and Rank-mean (rank-based weights are shown in figure 1(b)) methods are shown in figures 2(d) and (e). Both MME means provide similar precipitation patterns featuring uniform increases with larger increase over SC. The uncertainty associated with the MME mean projection was tested with the signal-to-noise ratio. A precipitation increase of approximately 0.16 mm d−1 is projected over North China (NC, 32° N–42° N, 110° E–120° E) by the MME mean with a relatively small inter-model spread from −0.07 mm d−1 to 0.35 mm d−1. However, this is not the case over SC (22° N–32° N, 110° E–120° E) owing to the large inter-model spread from −0.15 mm d−1 to 0.74 mm d−1 (figure 2(f)). Since a large inter-model spread exists over SC, neither the AM projection nor the Rank-mean projection is reliable, not exceeding the signal-to-noise ratio test. This suggests that alternative MME projection schemes need to be proposed instead of the MME mean.
To preserve the useful information in the MME and interpret it appropriately, we performed clustering-based MME probabilistic projection. Clustering analysis was performed on the precipitation patterns projected by the 28 individual models, and the models were finally classified into 4 clusters according to the 'elbow method' criterion. Future precipitation changes over East China exhibit four possible patterns (figure 3). Cluster 1, whose occurrence probability is 14.3%, projects a more or less uniformly increasing pattern with a larger increase over SC of approximately 0.51 mm d−1. Cluster 2, whose occurrence probability is 25%, shows a distinctively north-increasing-south-decreasing pattern, projecting decreased precipitation over SC of approximately 0.01 mm d−1. Cluster 3, whose occurrence probability is 35.7%, is similar to Cluster 1 but with an obviously weak magnitude, projecting a precipitation increase over SC of approximately 0.2 mm d−1. Cluster 4, whose occurrence probability is 25%, is also a pattern of uniform increase but with larger increase over the Huai River basin, projecting increased precipitation over SC of approximately 0.23 mm d−1. The differences in projected precipitation change over SC reflect large model uncertainty in future precipitation projections over the East Asian monsoon area. Next, we will explore the possible physical processes that result in the different precipitation changes over SC among the four clusters.
Figure 3. (a)–(d) Spatial patterns of projected annual mean precipitation changes (units: mm d−1) over East China during 2046–2065 relative to 1995–2014 under the SSP2-4.5 scenario using the clustering-based MME probabilistic projection method. (e)–(h) The regional mean values of annual, extended summer (MJJASO), and extended winter (NDJFMA) mean precipitation changes (units: mm d−1) over South China in the 4 clusters. The occurrence probability (a)–(d) of each cluster is represented in the upper-right corners. The white hatched areas (a)–(d) indicate regions where the changes are statistically significant at the 10% level using a two-tailed Student's t test.
Download figure:
Standard image High-resolution image3.2. What drives the different precipitation changes over SC?
To explore the physical processes responsible for the different precipitation changes over SC in the future, the annual mean precipitation was divided into extended summer mean precipitation from May to October (MJJASO) and extended winter mean precipitation from November to the following April (NDJFMA) respectively for further investigation. Remarkable differences are found among the four clusters in both the summer and winter precipitation results (figure 3(e)–(h)). In extended summer, the projected precipitation increases for 0.73 mm d−1 in Cluster 1, 0.17 mm d−1 in Cluster 2, 0.24 mm d−1 in Cluster 3, and 0.35 mm d−1 in Cluster 4, respectively. In extended winter, the projected precipitation increases for 0.32 mm d−1 in Cluster 1, 0.15 mm d−1 in Cluster 3, and 0.1 mm d−1 in Cluster 4, while it decreases for 0.19 mm d−1 in Cluster 2.
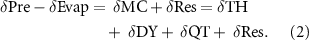
To investigate the physical processes associated with the different precipitation changes over SC, the atmospheric moisture budget was examined. According to the moisture budget equation, precipitation (Pre) is balanced by evaporation (Evap), the vertically integrated atmospheric moisture transport convergence (MC), and the residual term (Res) that includes sub-monthly transient eddies, and the surface boundary gradient term, which is usually neglected (Trenberth and Guillemot 1995, Seager and Henderson 2013). Moreover, the MC term can be decomposed into a dynamic component term (DY) due to changes in circulation, and a thermodynamic component term (TH) due to changes in specific humidity to facilitate studying the specific dynamic and thermodynamic effects, and the quadratic term of covariance between changes in humidity and winds (QT) (Li et al 2015):
Here,  represents the changes of the future relative to the present-day.
The summertime physical processes were investigated first. Precipitation increases over SC are projected in all 4 clusters but with significantly different magnitudes (figure 4(a)–(d)). The largest increase is projected in Cluster 1 for 0.73 mm d−1, followed by a moderate increase in Cluster 4 for 0.35 mm d−1, and weak increases in Cluster 2 for 0.17 mm d−1 and in Cluster 3 for 0.24 mm d−1. In Cluster 1, the change of MC contributes 69% of the precipitation increase, whilst in Cluster 2, Cluster 3 and Cluster 4, the evaporation change dominates the precipitation increase, contributing 81%, 61% and 67%, respectively (figure 4(u)). Although evaporation is an important contributor to the precipitation increase, they show similar changes among the four clusters (figures 4(e)–(h)). By contrast, vast differences are found in MC changes among the four clusters (figures 4(i)–(l)), with comparable spread to the precipitation spread (figure 4(u)). That indicates that the different magnitudes in precipitation increases over SC could be attributed mainly to the difference in moisture transport convergence and, secondarily, to the difference in evaporation changes.
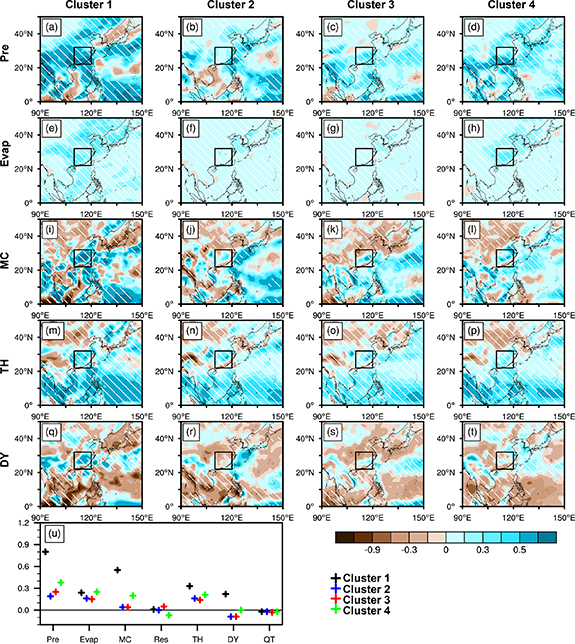
Figure 4. Spatial patterns of extended summer mean changes in (a)–(d) precipitation (Pre, units: mm d−1), (e)–(h) evaporation (Evap, units: mm d−1), (i)–(l) vertical integrated moisture transport convergence (MC, units: mm d−1), (m)–(p) the thermodynamic component (TH, units: mm d−1) and (q)–(t) the dynamic component (DY, units: mm d−1) in the 4 clusters. (u) The regional mean values over South China of the Pre, Evap, MC, TH, DY, quadratic term (QT) and residual term (Res) in the 4 clusters, respectively. The white hatched areas (a)–(t) indicate regions where the changes are statistically significant at the 10% level using a two-tailed Student's t test.
Download figure:
Standard image High-resolution imageFurthermore, MC term is decomposed into DY and TH contributions (figures 4(m)–(t)). Although the TH terms mainly contribute to the MC increases in all 4 clusters, they show relatively difference among four clusters. By contrast, huge spreads are found in DY terms among four clusters, which agree well with the corresponding different MCs between clusters. Thus, the different MCs are mainly the result of the difference in DY terms and secondarily the result of the difference in TH terms. Combined, the above results show that the dynamic effect resulting from different circulation changes predominates the different precipitation increases over SC. This is consistent with the previous study about the uncertainty source of projected SC precipitation change (Seager et al 2010, Zhou et al 2017, Tian et al 2019, Chen et al 2020b). Quantitatively, the DY terms over SC in the four clusters agree well with the corresponding precipitation changes. These changes in DY are 0.22 mm d−1 in Cluster 1, corresponding to a strong precipitation increase, 0.01 mm d−1 in Cluster 4, corresponding to a moderate precipitation increase, and −0.09 mm d−1 in Cluster 2 and −0.09 mm d−1 in Cluster 3 that combined with evaporation and TH effect contributes to a weak precipitation increase (figure 4(u)).
To demonstrate the four different circulation changes that are responsible for the different summertime precipitation changes over SC, four clusters of changes in summer 850 hPa horizontal winds are shown in figures 5(a)–(d). In Cluster 1 (figure 5(a)), an anomalous anti-cyclonic circulation is found over the western North Pacific (WNP), which transports moisture from the South China Sea (SCS) by the anomalous south-westerly winds along its north-western edge and leads to moisture convergence over SC; this condition is favorable to increased precipitation over SC. Similar anomalous anti-cyclonic circulation is found in Cluster 4 but with a weak magnitude over WNP (figure 5(d)), resulting in a moderate precipitation increase over SC. In contrast, in Cluster 2 and Cluster 3 (figures 5(b) and (c)), anomalous cyclonic circulation is found over WNP, which is associated with the anomalous north-easterly winds along its north-western edge, preventing moisture transport and suppressing precipitation over SC.
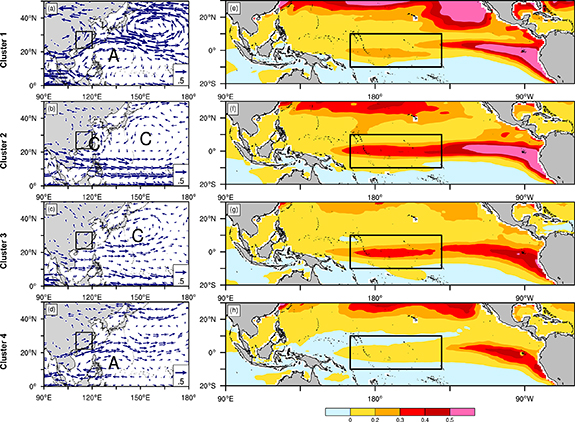
Figure 5. Spatial patterns of extended summer mean changes in (a)–(d) 850 hPa horizontal winds (unit: m s−1), and (e)–(h) sea surface temperatures (SST) minus the global mean SST anomaly (unit: °C) in the 4 clusters. The characters 'A' and 'C' (a)–(b) indicate the centers of anomalous anticyclonic and cyclonic circulations, respectively. In (e)–(h), the solid box indicates the equatorial central Pacific (10° S–10° N, 165° E–140° W). The bold arrow (a)–(d), and shaded areas (e)–(h) indicate regions where the changes are statistically significant at the 10% level using a two-tailed Student's t test.
Download figure:
Standard image High-resolution imageFurthermore, what causes the different circulation changes over WNP among the four clusters? The four clusters of changes in sea surface temperature (SST) are shown in figures 5(e)–(h). In Cluster 1, anomalous warming is found over the equatorial eastern Pacific, known as the El Nino-like SST anomaly (SSTA). This typical El Niño-like SSTA could stimulate anomalous WNP anti-cyclonic circulations, as it has been indicated in previous studies (Zhang et al 1999, Weng et al 2007). In Cluster 4, similar SST warming was found but with a weak magnitude; this warming may have been responsible for the weak anomalous WNP anti-cyclonic circulation. In contrast, in Cluster 2 and 3, the El Niño-like SSTA obviously extends westward, i.e., causing anomalous warming over the equatorial central Pacific (CP). The warming magnitudes are 0.21 °C in Cluster 2 and 0.16 °C in Cluster 3, higher than those in Cluster 1 (0.11 °C) and Cluster 4 (0.002 °C). The CP-El Niño-like SSTA could stimulate anomalous cyclonic circulation over WNP through Gill-type responses (Yuan et al 2012, Chen et al 2020). In summary, the different circulation changes observed over WNP in extended summer among clusters may have been due to the different SST warming patterns over the equatorial Pacific.
The physical processes contributing to the spread in extended winter precipitation changes are analyzed and the results are shown in figure 6. Precipitation increases over SC are projected in Cluster 1 for 0.32 mm d−1, 0.15 mm d−1 in Cluster 3, and 0.1 mm d−1 in Cluster 4, respectively, Cluster 2 shows markedly decreased precipitation for 0.19 mm d−1 (figure 6(b)), and this difference is contributed by the MC effect (figure 6(j)). As shown in figure 6(u), the evaporation is projected to similarly increase across clusters, while obviously decreased MC in Cluster 2 is different from the other clusters, which agrees well with the spread of precipitation changes. Further, the MC is further decomposed into DY and TH terms. This decomposition shows that the TH contributes to the increased precipitation over SC (figures 6(m)–(p)) but the DY contributes to the decreased precipitation in the four clusters (figures 6(q)–(t)). Among then, the stronger negative contribution in DY is projected in Cluster 2, that mainly explains its different MC from the other clusters (figure 6(u)). Therefore, the comparison among the four clusters shows that the different winter precipitation changes over SC are attributed mainly to the dynamic effect associated with circulation changes. Quantitatively, the DY term is −0.33 mm d−1 in Cluster 2 and it contributes to the precipitation decrease. The DY term is −0.15 mm d−1 in Cluster 1 in combination with evaporation and TH effect contributes to a strong precipitation increase. The DY contribution of −0.08 mm d−1 in Cluster 3 and −0.13 mm d−1 in Cluster 4, respectively, in combination with evaporation and the TH effect, contribute to weak precipitation increase over SC (figure 6(u)).
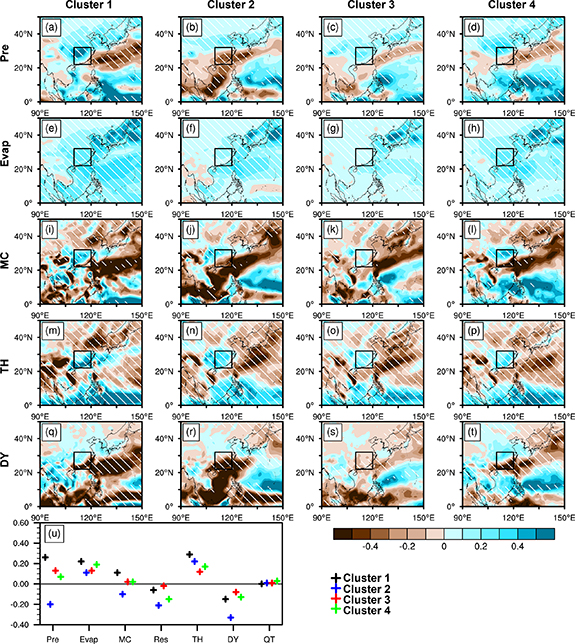
Figure 6. Same as figure 4, but for the extend winter.
Download figure:
Standard image High-resolution imageIn addition, the residual term that mainly includes sub-monthly transient eddy has a negative contribution in Cluster 2 and Cluster 4 (figure 6(u)), which partly explains precipitation decreases over SC. The change of transient eddies is projected to decrease in the subtropics during winter half year that is mainly associated with the transient eddy moisture transport in response to global warming (Seager et al 2010, Wu et al 2011) due to the westerly jet weakening in the region (Liang and Zhang 2021). As demonstrated by He (2023), the weakened southern branch westerly jet on the southern side of the Tibetan Plateau plays a key role in suppressing winter precipitation in the subtropical East Asian.
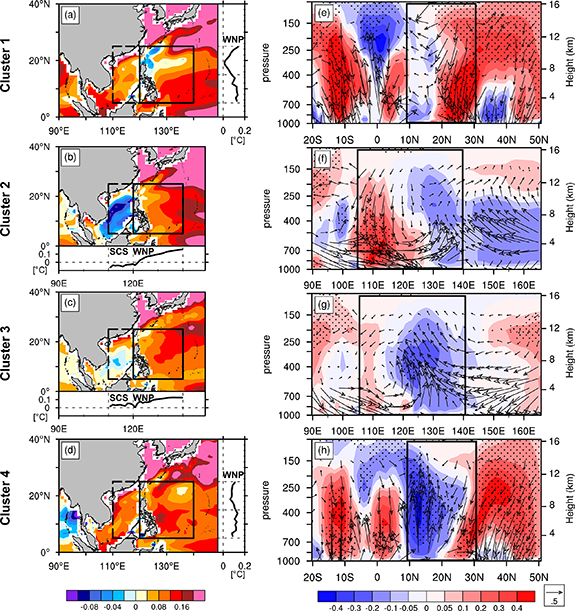
To explore physical processes that are responsible for the different winter precipitation changes over SC, four clusters of changes in SST, and vertical motion are shown in figure 7. The precipitation decrease over SC observed in Cluster 2 is possibly associated with the notably zonal SSTA gradient between the SCS and adjacent WNP (figure 7(b)) driving an anomalous zonal circulation with a descending branch at the SCS and SC (figure 7(f)) and suppressing the precipitation over there (figure 6(r)). Similar SSTA gradients (figure 7(c)) and associated anomalous zonal circulations (figure 7(g)) are found in Cluster 3 but with a much weaker strength, resulting in weak precipitation suppression over SCS (figure 6(s)). Different from the zonal SSTA gradients observed in Cluster 2 and Cluster 3, meridional SSTA gradients over the WNP are found in Cluster 1 (figure 7(a)) and Cluster 4 (figure 7(d)), and these gradients drive anomalous meridional circulation with a descending branch at 20° N–30° N (figure 7(e) and (h)), suppressing the precipitation from southern coastal China extending to the WNP region (figures 6(q) and (t)). Overall, the different winter precipitation changes observed among the clusters may have been associated with the vertical motions stimulated by different SSTA gradients over the SCS and adjacent WNP.
Figure 7. Future changes in extended winter mean (a)–(d) sea surface temperature (SST) minus global mean SST anomaly (unit: °C), (e) and (h) zonal mean ω anomalies (shadings, unit: Pa s−1 × 10⁻²) averaged over the region (120° E–140° E) and corresponding wind vector (v, ω) anomalies in the latitude-pressure cross sections, (f)–(g) meridional mean ω anomalies averaged over the region (5° N–25° N) and corresponding wind vector (u, ω) anomalies in the longitude-pressure cross sections (arrows, unit: m s −1 × 10⁻³) in the 4 clusters. In (a)–(d), the dashed box indicates the South China Sea (SCS, 5° N–25° N, 110° E–120° E) and the solid box indicates the western North Pacific (WNP, 5° N–25° N, 120° E–140° E). The solid lines indicate ((a) and (d)) the zonal mean values over the WNP and (b), (c) the meridional mean values over the SCS and WNP. The colored (a)–(d), and dotted areas (e)–(h) indicate regions where the changes are statistically significant at the 10% level using a two-tailed Student's t test.
Download figure:
Standard image High-resolution image
4. Conclusions and discussion
In this study, future changes in annual mean precipitation over East China during 2046–2065 under the SSP2-4.5 scenario were projected with an ensemble of 28-models. Large model uncertainty was found in the projection over SC, and the possible physical processes that are responsible for the model uncertainty were further explored. The main findings are summarized as follows.
- (1).An annual mean precipitation increase of 0.16 mm d−1 is projected over NC by the MME mean with a relatively small inter-model spread. However, a large inter-model spread exists in the projection over SC, and this spread reduces the reliability of the MME mean projection. Thus, a clustering-based MME probabilistic projection is proposed and employed. This method projects four possible precipitation changes over SC in the future. In Cluster 1, precipitation increases by 0.51 mm d−1 with an occurrence probability of 14.3%; in Cluster 2, precipitation decreases by 0.01 mm d−1 with an occurrence probability of 25%; in Cluster 3, precipitation increases by 0.2 mm d−1 with an occurrence probability of 35.7%; and in Cluster 4, precipitation increases by 0.23 mm d−1 with an occurrence probability of 25%.
- (2).The possible physical processes responsible for the four different precipitation changes over SC were explored in extended summer and winter separately. Dynamic effects due to different circulation changes predominate these different precipitation changes in both extended summer and winter. In extended summer, eastern Pacific-El Niño-like SSTAs are projected in Cluster 1 and Cluster 4, stimulating anomalous WNP anti-cyclonic circulations that are favorable for increasing precipitation over SC. In contrast, CP-El Niño-like SSTAs are projected in Cluster 2 and Cluster 3, stimulating anomalous WNP cyclonic circulations that are unfavorable for increased precipitation over SC. In extended winter, the prominently decreased precipitation projected in Cluster 2 differs from the projections of the other three clusters, and may have been associated with the anomalous descent in an anomalous zonal circulation stimulated by a strong zonal SSTA gradient between the SCS and adjacent WNP. Cluster 3 exhibits a similar SSTA gradient but with a much weaker strength, resulting in weak precipitation suppression. Distinct meridional SSTA gradients are projected in Cluster 1 and Cluster 4, stimulating a shifted descent that has negligible effect on SC precipitation.
The clustering-based MME probabilistic projection gives a variety of possible precipitation change patterns, which could provide richer projection information to the decision-makers as an ideal supplement to the traditional MME mean method. In this study, only 28 CMIP6 models with single-realization were involved for simplification. The projection using more realization simulations (table S1) were calculated. It showed similar results, just with small numerical differences. In particular, it effectively retains the north-increasing-south-decreasing pattern of precipitation change in Cluster 2 (figure S4). More available ensemble members need to be involved in the ensemble to provide more reliable projection in the future.
Acknowledgments
We appreciate the editors', anonymous reviewers', Professor Shuiqing Yin's and Professor Wenxia Zhang's suggestions for improving our study. This study was jointly supported by the National Key Research and Development Program of China (2020YFA0608201) and the National Natural Science Foundation of China (41875136).
Data availability statements
The datasets used in this study can be downloaded from the following sources: the CMIP6 datasets are available through the Earth System Grid Federation (https://esgf-node.llnl.gov/projects/esgf-llnl/). The CN05.1 observational data are available at http://ccrc.iap.ac.cn/resource/detail?id=228 and can also be obtained by contacting Wu and Gao (2013). The scipy.cluster.hierarchy software package (https://docs.scipy.org/doc/sc-ipy/reference/cluster.hierarchy.html) was used to support the hierarchical clustering analysis in this study.
All data that support the findings of this study are included within the article (and any supplementary files).
Supplementary data (0.6 MB DOCX)