

Abstract
How climate change will affect the spatial coherence of droughts is a key question that water managers must answer in order to adopt strategies to mitigate impacts on water resources. Water transfers from regions with excess to those in deficit are fundamental to such strategies, but only possible if both regions are not simultaneously under drought conditions—these relationships could change in a warming world. Here, we use future simulations (under RCP8.5) of streamflow (186 catchments) and groundwater level (41 boreholes) from the Enhanced Future Flows and Groundwater (eFLaG) dataset to analyse the projected change in the spatial coherence of hydrological droughts at a national scale, with Great Britain as an example. Joint and conditional probabilities of two regions being in drought simultaneously are used to characterise the spatial coherence. The results are sensitive to various uncertainties, including the way drought is defined. However, some key findings emerge. In particular, for droughts defined based on current conditions, our results show that the spatial coherence of streamflow droughts for the 'far future' (2050–2089) is expected to increase during the summer everywhere in the country. During the winter, however, spatial coherence may only increase in the South-East, where the sharpest rise in winter droughts is likely to occur. The coherence between groundwater and streamflow droughts shows a more mixed picture, dependant on season and region. One important observation is that, in the South-East during the summer, the proportion of streamflow droughts that coincide with groundwater droughts is expected to decrease. These results provide a valuable insight for water managers to help inform their long-term strategy to overcome future impacts of droughts, including the feasibility of inter-region water transfers and conjunctive use (surface and groundwater) schemes. This flexible methodology has the potential to be applied in other parts of the world to help shape strategic regional and national investments to increase resilience to droughts.
Export citation and abstract BibTeX RIS

Original content from this work may be used under the terms of the Creative Commons Attribution 4.0 license. Any further distribution of this work must maintain attribution to the author(s) and the title of the work, journal citation and DOI.
1. Introduction
Droughts are slow-evolving large-scale phenomena (Wilhite and Glantz 1985) and understanding their spatial coherence is critical for effective water resource management. Water managers interested in quantifying drought risk need to understand not just the occurrence/characteristics of drought at a location but also across large areas—especially where bulk transfers of water are a component of water management strategies. To this end, many international studies have sought to quantify the coherence of drought nationally (e.g. Vicente-Serrano 2006, Haslinger and Blöschl 2017) or at continental scales (e.g. US: Brunner and Gilleland 2021; Europe: Hannaford et al 2011, Lloyd-Hughes 2012). However, most studies have focused on historical patterns, with few studies on how coherence may change in the future under climate change projections.
The UK has a long history of water resource planning and the issue of drought spatial coherence is of profound importance in contemporary water resource management. Water managers from private, regional water providers have been tasked with working together on long-term water resource planning at regional and national scales (Environment Agency 2020). Inter-regional water transfers—where a region in drought receives water from a neighbouring region not suffering from water shortage—have long been considered as a potential solution in situations of extreme drought in the UK (e.g. Water UK 2016) and around the world (e.g. Sinha et al 2020). However, these entail huge investments in infrastructure and hence a thorough assessment of the space-time coherence of present and future droughts is first needed to identify regions between which such transfers would be feasible. Using groundwater to boost water supply in the event of streamflow drought (and vice versa) is an alternative/complementary water management practice (de Wrachien and Fasso 2002, Zhang 2015), but it requires prior evaluation of the joint occurrence of riverflow and groundwater droughts.
Previous studies in the UK have investigated the spatial coherence of past meteorological (e.g. Folland et al 2015, Tanguy et al 2021) and groundwater droughts (Bloomfield et al 2015, Marchant and Bloomfield 2018). However, comparatively few studies have looked at future changes in spatial coherence under anthropogenic warming and none to our knowledge have looked at future changes in simultaneous streamflow and groundwater droughts. Rahiz and New (2012) examined future changes based on then-current projections but focused on meteorological droughts. Rudd et al (2018) and Murgatroyd and Hall (2020) examined future coherence in hydrological drought using MaRIUS climate projections (Guillod et al 2017), but these studies were limited to two contiguous regions. National-scale assessments were also made by Dobson et al (2020) and Murgatroyd et al (2022), but they studied the resilience of specific alternative water supply strategies under future climate conditions rather than the spatial coherence of droughts per se. To date, no studies have examined spatial coherence under the latest and improved UK Climate Projections (UKCP18, Murphy et al 2019), and key scientific gaps also remain in terms of looking at the UK as a whole, seasonal differences and the coherence of both streamflow and groundwater.
In this study, we aim to fill these gaps by providing a comprehensive analysis of how climate change might affect the spatial coherence of hydrological droughts at national and seasonal scales in Great Britain (GB), both at an inter-regional level for streamflow and an intra-regional level for streamflow vs. groundwater. While this is of specific 'on the ground' relevance to water management in the UK, the approach is a flexible one aimed at addressing coherence between any given region, rather than for specific pairwise transfers, and across different times of year. This could be applied in any location for which hydrological climate projections exist.
2. Data and methods
2.1. eFLaG dataset
Our study uses drought events extracted from the Enhanced Future Flows and Groundwater (eFLaG; Hannaford et al 2022a, 2022b) dataset, which describes the nationally consistent transient hydrological (streamflow and groundwater) projections for the UK, based on UKCP18, which correspond to an RCP8.5 emission scenario, the upper bound of projected global emission scenarios. Bias-corrected projections are used to produce streamflow simulations for 186 catchments across GB using four hydrological models: G2G (grid-to-grid; Bell et al 2007), GR4J (Génie Rural à 4 paramètres Journalier; Perrin et al 2003), GR6J (Génie Rural à 6 paramètres Journalier; Pushpalatha et al 2011) and PDM (probability distributed model; Moore 2007). Groundwater levels are simulated for 41 boreholes (out of 51, figure 1(a)) using AquiMod (Mackay et al 2014). An ensemble of 12 different climate model simulations are used to generate daily streamflows and groundwater levels for 1989–2079 (full details in Hannaford et al 2022a). Three time-slices are considered in this study: baseline (BL; 1989–2018), near future (NF; 2020–2049) and far future (FF; 2050–2079). For the BL period, we have also simulated observations (SOs; 1989–2018), where eFLaG models were driven by observed data from the HadUK dataset (Hollis et al 2019).

Figure 1. (a) Map of water regions (WRs) used in this study with their respective acronyms. The numbers displayed in black correspond to the number of catchments used in each WR, whereas the numbers in red correspond to the number of boreholes within each WR. Boreholes marked by an asterisk were not used in this study as the numbers in these WRs were too small to consider them representative of the whole WR. (b) Map of additional regions used in this study with their corresponding acronyms.
Download figure:
Standard image High-resolution image2.2. Drought event extraction
We calculate drought events for all catchments and boreholes using a percent exceedance threshold applied to monthly accumulated streamflow/groundwater level based on the methodology in Rudd et al (2017). We estimate 'moderate droughts' using the 70th percent exceedance threshold (streamflow Q70 and groundwater level L70) and 'extreme droughts' using the 90th percent exceedance threshold (streamflow Q90 and groundwater level L90). Please note that the 70th (90th) percent exceedance corresponds to the 30th (10th) percentile. Q70 and Q90 (L70 and L90) represent the monthly streamflow (groundwater level) exceeded 70% and 90% of the time, respectively. When the monthly streamflow (groundwater level) falls below Q70 (L70) or Q90 (L90) for a month, we consider that month in drought, otherwise not. Percent exceedance thresholds are calculated for each month's climatology (one per month). Note that the threshold method does not provide information on drought severity. To understand future drought changes, the time-slice from which the percent exceedance threshold is calculated is very important (Wanders and Wada 2015). In this study, we have adopted two distinct approaches: (i) a traditional approach where we calculate percent exceedance thresholds from the SO and apply them to all the different scenarios (BL, NF and FF)—we get droughts that are defined based on current conditions; or (ii) a more novel approach where different percent exceedance thresholds are calculated for each time-slice and each ensemble member—we get drought thresholds that are time-varying (i.e. transient) and defined based on each scenario's conditions. We use both methods to define the Q70 (L70) and Q90 (L90) thresholds, which give us four different drought estimation methods, summarised in table 1. Full details of the drought extraction method can be found in the supplementary information (ST1). The choice of method will depend on the context and the questions we are trying to answer (section 4).
Table 1. Summary of the four drought estimation methods used in this paper, with their corresponding acronym.
| Unique threshold based on SO | Time-varying threshold based on time-slice and ensemble member | |
|---|---|---|
| Threshold for moderate droughts (streamflow: Q70, groundwater: L70) | Unique monthly threshold for moderate droughts based on current conditions (UQ70 for streamflow, UL70 for groundwater level) | Time-varying monthly threshold for moderate droughts (VQ70 for streamflow, VL90 for groundwater level) |
| Threshold for extreme droughts (streamflow: Q90, groundwater: L90) | Unique monthly threshold for extreme droughts based on current conditions (UQ90 for streamflow, UL90 for groundwater level) | Time-varying monthly threshold for extreme droughts (VQ90 for streamflow, VL90 for groundwater level) |
Using the four different methods, we present streamflow (groundwater) drought occurrences for the four hydrological models (Aquimod model), their 12 ensemble members and the three time-slices (BL, NF, FF) for 186 catchments (41 boreholes) across GB.
Please note that we only discuss results for 'moderate' droughts in the main manuscript. Conclusions for 'extreme' droughts are very similar and are shown in the supplementary information (ST2).
2.3. Drought spatial coherence analysis
Our analysis groups the study catchments and boreholes within seven water regions (WRs, figure 1(a)); for England and Wales these correspond to the water resource zones used by the water companies. For groundwater, the study was limited to the South and South-East of England (SSE, figure 1(b)) due to data availability.
To identify regional streamflow drought occurrence, we consider the whole WR in drought if 75% of the catchments within that WR are in drought for any month. Our results are not very sensitive to the percentage selected, as we tested for 50%, 60%, 70% and 80% of the catchments within a WR (not shown). For groundwater droughts, given the small number of boreholes in some WRs, we considered the WR to be in drought when >50% of the boreholes were in drought.
To understand the spatial coherence of streamflow drought events we calculate (i) conditional probabilities, which are the probability of one region being in drought under the condition that another region is in drought, and (ii) the joint probability of two regions being simultaneously in drought. We calculate conditional and joint probabilities of each pair of WRs for each hydrological model, ensemble member and time-slice for all seven WRs, evaluated at both annual and seasonal timescales. Conditional and joint probabilities were also calculated for the groundwater and streamflow drought within each of the WRs.
3. Results
3.1. Future droughts (relative to current conditions)
Figure 2 shows maps of the number of months in drought for each time-slice based on two ensemble members of the future projections of streamflow and groundwater drought occurrences using the UQ70 and UL70 methods (table 1).

Figure 2. Maps showing the number of months in drought for each study catchment (first four columns) and borehole (last column) within the three time-slices (baseline, near future and far future). Each time-slice has a total of 360 months (12 months × 30 years). The drought events were extracted for 'moderate droughts' using methods UQ70 and UL70 for streamflow and groundwater level simulations from the four streamflow models (G2G, GR4J, GR6J, PDM) and Aquimod respectively. This figure shows the number of months in drought for two example ensemble members from the original 12: (a) RCM number 7 and (b) RCM number 13.
Download figure:
Standard image High-resolution imageOur results confirm conclusions from previous studies (e.g. Prudhomme et al 2012, Rudd et al 2019, Parry et al 2023) suggesting that streamflow droughts are likely to increase in frequency and duration with climate change especially in the summer (not shown). This is observed in simulations from all four models and all 12 climate ensemble members (only two shown in figure 2), although the intensity of predicted change varies. Some catchments, in particular in WRE and WRSE, are expected to suffer from an almost continuous state of moderate streamflow drought (with UQ70). Therefore, what is considered a moderate drought (Q70) based on current conditions might become 'normal' in some catchments in the FF.
For groundwater, the results are more nuanced and dependent on the ensemble member considered. For regional climate model (RCM7) (figure 2(a)), there is no clear trend, whereas for RCM13 (figure 2(b)), a notable increase in number of months in drought in the future can be observed. This is consistent with observations in Parry et al (2023) who found divergence in the trajectory of streamflow and groundwater drought, with some boreholes showing negligible projected change or moderate decreases in drought severity. Figure SF1 shows the time series of drought events extracted for all catchments and boreholes, for the same two example RCMs.
3.2. Spatial coherence of future streamflow droughts
In order to analyse drought spatial coherence in a more systematic way, we have looked at conditional and joint probabilities of each pair of WRs being in drought simultaneously (section 2.3).
All simulations agree that the spatial coherence of streamflow drought is likely to increase in the future, though there are slight differences in the results based on the ensemble member and hydrological model analysed. Figure 3(a) summarises the results by showing the ensemble mean conditional probabilities of droughts between two WRs. G2G and GR4J predict a more asymmetrical increase in the conditional probabilities than the other models: the probability of WRs WRN, WRW and Wales (hereafter called 'North-West England and Wales', or NWW, figure 1(b)) being in drought given that WRs WCWR, WRSE and WRE (hereafter called 'South and South-East', or SSE, figure 1(b)) are in drought will increase much more than the other way around (figure 3(a)). However, this can be a consequence of droughts just generally becoming more common in the SSE (figure 2), resulting in a near-permanent drought state in some catchments (with UQ70). We also observe that the various WRs within NWW and SSE are likely to suffer drought simultaneously more often. The Scottish region stands out as its droughts display an apparent disconnect with the other WRs, both in the present and future (figure 3(a)). This is in agreement with findings in previous studies (e.g. Tanguy et al 2021) which observed that Scottish precipitation behaves differently from the rest of the country. The Scottish region is also the largest—with western and eastern Scotland being very different hydroclimatically—and with the highest number of study catchments, which may bring down the number of months the whole WR is considered to be in drought.
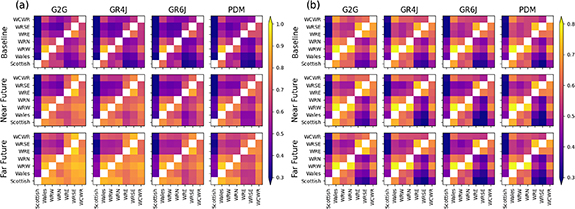
Figure 3. Conditional probabilities of each WR (in y-axis) being in streamflow drought given that another WR (in x-axis) is in drought (streamflow), calculated as the mean of the probabilities for the 12 climate ensemble members. Each subplot represents the matrix of conditional probabilities calculated for the droughts simulated by a specific model (each column) and for a given time-slice (each row). For example, the top-left square of the top-left subplot shows for the G2G model, for the BL simulated streamflows, the probability of the Scottish region (x-axis) being in drought given that the WCWR water region (y-axis) is in drought. Droughts are defined according to the method (a) UQ70 and (b) VQ70 (see table 1).
Download figure:
Standard image High-resolution imageThe general picture is different if we look at droughts defined relative to each time-slice (VQ70; figure 3(b)). In figure 3(b), we are looking at the 30% driest months within each specific time-slice and for each ensemble member. Here, we observe no potential increase in spatial coherence over time (no change in conditional probabilities) and this is the case consistently over all climate ensemble members (only the ensemble mean shown in figure 3(b)). Also, in addition to the Scottish region that shows low coherence with the rest of the country, we can observe some blocks of regions that show little coherence: low conditional probability of NWW being in drought when WRSE and WRE (i.e. the 'South-East', hereafter referred to as SE, figure 1(b)) are in drought.
The values of joint probabilities also show a likely increase in drought spatial coherence in the future when using method UQ70 (figure SF2(a)); and no likely change when using method VQ70 (figure SF2(b)).
3.3. Seasonal analysis of drought spatial coherence
We observe some notable differences when analysing droughts seasonally. Figure 4 shows the evolution of the joint probabilities of two WRs being in moderate drought (streamflow) simultaneously for each season (UQ70) shown as boxplots displaying the model and ensemble spread. The spatial coherence of droughts is likely to increase significantly in the future everywhere in the country in the summer (figure 4(c)) and to a lesser extent in the autumn (figure 4(d)). However, it is not projected to change significantly in the winter (figure 1(a)) and spring (figure 1(b)), except between WRE and WRSE (within the SE) where the coherence will likely increase.

Figure 4. Joint probabilities of each WR (columns) being in drought simultaneously with every single other WR, for (a) DJF: winter, (b) MAM: spring, (c) JJA: summer, and (d) SON: autumn. Droughts are defined according to the method UQ70 (see table 1). The boxplots show the spread given by the four hydrological models and the 12 climate ensemble members. The boxplot caps show the 5th–95th percentile extent and the two fliers show the 0–100th percentile spread. The three colours for the boxplots show the time-slices: blue for the baseline, purple for the near future and pink for the far future.
Download figure:
Standard image High-resolution imageIf we consider transient thresholds for droughts (VQ70), no significant change in spatial coherence is likely for any of the WRs and seasons (figure SF3). However, the same 'blocks' of regions with little spatial coherence identified previously from figure 3(b) (SE vs. NWW) can also be found and are maintained throughout seasons.
3.4. Groundwater vs. streamflow drought coherence
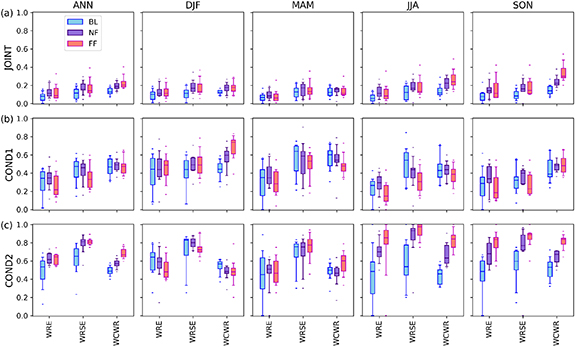
Figure 5 shows drought coherence between streamflow and groundwater within the same WR in the SEE, using current conditions to define droughts (UQ70 and UL70). When we look at the joint probabilities of groundwater and streamflow droughts (figure 5(a)), we can see that the coherence is likely to increase slightly in the winter and autumn, but barely changes in the spring and summer.
Figure 5. Drought coherence between streamflow and groundwater within each WR: (a) joint probability of the two resources (streamflow and groundwater) to be in drought simultaneously; (b) conditional probability of having a groundwater drought given that we have a streamflow drought (COND1); and (c) conditional probability of having streamflow drought given that we have a groundwater drought (COND2). The columns correspond to the seasons: ANN: annual; DJF: winter; MAM: spring; JJA: summer; SON: autumn. Droughts are defined according to the methods UQ70 and UL70 for streamflow and groundwater level, respectively (see table 1). The boxplots show the spread given by the 12 climate ensemble members. The boxplot caps show the 5th–95th percentile extent and the two fliers show the 0–100th percentile spread. The three colours for the boxplots show the time-slices: blue for the baseline, purple for the near future and pink for the far future.
Download figure:
Standard image High-resolution image
The likelihood of having a groundwater drought given a streamflow drought (figure 5(b)) remains either unchanged or decreases slightly in most WRs and seasons (except for WCWR in the winter, where it may increase). Notably, in the summer, a decrease in the proportion of streamflow droughts that coincide with groundwater drought is predicted for the FF. This is probably due to the divergence in streamflow and groundwater projections, especially in the summer. If we look at the probability of groundwater droughts to also be streamflow droughts (figure 5(c)), a significant increase in the summer and autumn, but little change in the winter and spring is likely.
When time-varying thresholds are used to define droughts (VQ70 and VL70), we expect no change in coherence between streamflow and groundwater droughts in the future (figure SF4). This suggests that the physical processes dynamically linking the two stores will remain unchanged.
4. Discussion
4.1. Drivers of changes in drought spatial coherence in GB
The regional and seasonal differences in expected changes in spatial coherence of hydrological droughts can be explained by a combination of changes in the climate drivers in UKCP18 projections and differences in catchment characteristics across GB. Studies using UKCP18 project wetter winters and warmer/drier (Murphy et al 2019, Pope et al 2022) and longer (Cotterill et al 2023) summers in the future. This is consistent with the findings in our study pointing to more spatially coherent summer (and autumn) streamflow droughts, driven by the combined effect of reduced precipitation and increased evaporative demand (from increased temperature, Robinson et al 2022) across the country. The expected persistence of drought spatial coherence over SE into winter and spring can be attributed to the slow-responding nature of most catchments in that region (high baseflow index, Coxon et al 2020). Despite projected wetter winters, the large deficit accumulated during the summer and delays in recharge season are expected to make it difficult for these catchments to fully recover from the summer drought during the winter. In future summers, SEE is expected to have a decreased proportion of streamflow droughts coinciding with groundwater droughts due to sensitivity to seasonal changes in precipitation and potential evapotranspiration (Parry et al 2023). Streamflow droughts are more affected by shorter-term rainfall deficits in the summer, whilst groundwater droughts appear to be offset by the wetter signal during the recharge season (winter) in climate projections.
4.2. Choice of definition of droughts
Stahl et al (2020) raised the issue of the high diversity of drought definitions and choice of thresholds, particularly for climate adaptation studies. Figures 3, SF2, SF5 and SF3 show that the results are profoundly different depending on how streamflow droughts are defined: large potential increase in coherence of streamflow droughts if we use a fixed current threshold (UQ70) or no change in coherence with a time-varying threshold (VQ70). Which results are more relevant will depend on the framing of the problem: (i) for drought managers who want to plan for droughts at least as severe as those experienced in the current climate, the results shown in figures 3(a), SF2(a) and 5 are more relevant (i.e. likely increase in drought spatial coherence), reducing the scope for inter-regional water transfers as a water management solution. This is generally the approach taken by water managers in their long-term planning, typically by perturbing current conditions and analysing the change by the use of stochastic simulations, by the UK's many private water companies, for sets of isolated locations (e.g. Water UK 2016). Our approach has the added advantage that the simulations are transient and fully spatially coherent. (ii) If the focus is more on progressive changes in drought, and we are interested in the spatial coherence of droughts relative to their own time-slice, then figures 3(b), SF2(b) and SF3 become more relevant. The blocks of regions with little spatial coherence (SE vs. NWW)—which are likely to be maintained in the future—can be key to identify potential candidate catchments for inter-regional water transfers. This approach is similar to the one recommended by Wanders and Wada (2015) who argued that a transient threshold takes into account the non-stationarity of the climate and adjusts the definition of drought to gradual changes in the hydrological regime as a response.
4.3. Implications for water management
The spatial coherence of streamflow droughts is projected to increase significantly at national scale during the summer and autumn and for the whole year within SE (section 3.3). This can inform future water resources management strategies—for water companies drought planning in particular—as it suggests that inter-regional (streamflow) water to the SE from other parts of the country would most likely not be viable in the summer months in the future. This is highly relevant as summer is the month when demand is greatest and drought impacts tend to cluster (e.g. Rey et al 2020, Turner et al 2021). Other seasons, notably winter and spring, could offer inter-regional transfer potential. Spring is a critical time for droughts and winter is key for replenishment in SE (e.g. Folland et al 2015). Winter transfers have been considered in some previous studies (e.g. to supply London: Khadem et al 2021).
The analysis of intra-regional coherence between streamflow and groundwater (though limited to SEE due to data availability) showed that the prospect of conjunctive use of the two sources of water in the summer (when demand is highest) would only be potentially possible for compensating some streamflow droughts with groundwater but not the other way around (section 3.4 and figures 5(a) and (b)). Given that regional water transfers in the summer are also unlikely to be possible, to face water demand during groundwater droughts in future, other water management options will need appraising (reservoirs, winter transfers, reducing demand, etc).
The approach used here deliberately focuses on large-scale water resource regions, to make it generalisable by looking at all possible transfers. In reality, most transfers are developed on a smaller scale between particular water resource zones within and between these regions. To study more specific transfer options, the methodology would need to be replicated for particular water resource zones that are involved in planning at a finer scale. Several studies have examined future transfer options between catchments where real transfers are planned (e.g. Rudd et al 2018) or have sought to model these transfers explicitly using water supply system modelling (e.g. Dobson et al 2020, Murgatroyd et al 2022). For example, Dobson et al (2020) found that candidate regions for water transfer should be at least 100 km apart and that, under climate change projections, water restrictions would be multiplied by four by 2100. However, to date, past studies have not considered seasonal differences and have not been undertaken using coherent, transient hydrological projections based on the latest UKCP18 data, so this study provides datasets and methodologies for future work.
Beyond applications for water companies, our results are important for increasing general readiness and planning for future droughts in other sectors, such as environmental, recreational, agriculture, etc (e.g. Ivits et al 2014, Parsons et al 2019).
The methodology applied here is transferable to any other region of the world with coherent transient simulations of riverflows and groundwater levels for the future.
4.4. Limitations
As with any climate change study, our results have large uncertainties, captured here by the 12 climate ensemble members and four hydrological models. However, more of the uncertainty could be represented by using different initial conditions, larger ensembles and more hydrological models. For full consideration of the uncertainties involved in eFLaG projections, see Hannaford et al (2022a), Parry et al (2023) and Aitken et al (2023).
In addition, only one carbon emission scenario is used in the eFLaG data. 'RCP8.5' is the most pessimistic emission scenario considered by the Intergovernmental Panel on Climate Change (2014), but it is generally deemed appropriate for climate impact assessments focusing on extreme conditions (Murgatroyd and Hall 2020) and might be considered a prudent choice from a policy perspective (Arnell et al 2021). A lower-emission scenario would most likely predict less change in the future. However, even if droughts do not increase as sharply in the future, the analysis with time-varying threshold to define droughts (VQ70/VL70 and VQ90/VL90) (figures 3(a), SF2(a), SF3 and SF4) could still be relevant for water managers: we have identified blocks of regions (SE and NWW) which do not tend to suffer streamflow droughts simultaneously and this pattern is expected to remain unchanged in the future. This result is likely to still be valid under different emission scenarios and could be relevant for water managers dealing with future demand-and-supply scenarios.
Lack of data availability limited our study of groundwater vs. streamflow drought coherence to SEE only. However, this region contains the driest and most populated part of the country, with water demand expected to increase steadily in coming decades (Rees et al 2020). Therefore, the greatest water management challenges are faced in that region.
Finally, this study is an academic exercise focused on theoretical aspects rather than a detailed evaluation and does not consider existing anthropogenic water supply and demand and drought impacts; these factors should be taken into account for any comprehensive study on water management solutions for future water scarcity.
5. Conclusion
In this study, we have investigated how the spatial coherence of streamflow and groundwater droughts are likely to evolve with climate change by analysing the likelihood of separate regions/water stores going into drought together, with GB as a case study. We have considered two ways of defining droughts: (i) a fixed and unique threshold for the whole period of study based on current conditions, and (ii) a time-varying threshold that uses three successive 30 year periods in the near-past and future to define the time-slice-specific threshold.
When droughts are defined using current conditions, method (i), we found that the spatial coherence of hydrological droughts is expected to increase significantly in the future, especially in the summer (and the autumn to a lesser extent), resulting in national scale droughts on most years in the FF (2050–2079). However, in the winter and spring, the spatial coherence of streamflow droughts will likely only increase between the two most South-Eastern WRs in England, remaining low in the rest of the country. For that same region, we found that the proportion of streamflow droughts, which are also groundwater droughts, is expected to decrease in the FF, particularly in the summer. The SE is the area of the UK that will likely suffer the biggest increase in streamflow drought frequency and duration throughout the year. These results are valuable to inform future water resource management strategies, suggesting that inter-regional water transfers in the summer may not be a viable option, though they might be possible in the winter and spring from North-Western to South-Eastern regions. However, compensating streamflow deficits using groundwater might be a possibility for some summer droughts in the South-East.
When droughts are defined respective to each time-slice, method (ii), no change in coherence of droughts—both spatially for streamflows and between groundwater and streamflow—over time is expected. However, spatial differences in coherence are identified. In particular, we observe that the two most South-Eastern regions are highly coherent between them in terms of streamflow droughts, but disconnected to Wales and North-Western England. Our study suggests that this bipole (SE vs. NWW) is likely to be maintained in the future, if we consider a time-varying threshold to define droughts. Moreover, for coherence of streamflow and groundwater droughts, the relationships were also expected to be maintained in the future for the South and South-East (where data was available).
The two methods lead to different conclusions. It is therefore important to carefully consider the assumptions underlying each method. However, both are valid ways of analysing future change and the choice of method depends entirely on the framing of the problem being addressed (i.e. whether considering future changes relative to current norms of what constitutes a drought, or progressive changes in drought, as a relative phenomenon, against the backdrop of a slowly changing climate).
This flexible method, aimed at addressing drought coherence between any given region, could be applied to any location for which hydrological climate projections exist, with the potential to inform regional and national water resource management strategies. However, the climatic, hydrological and water management context in other locations will be different, and more work will be needed to look at specific examples to consider transferability.
Acknowledgments
This study was funded by the Met Office-led component of the Strategic Priorities Fund Climate Resilience programme (www.ukclimateresilience.org) under contract P107493 (CR19_4 UK Climate Resilience), and under UK NERC project Climate change in the Arctic-North Atlantic Region and Impacts on the UK (CANARI, Grant Number: NE/W004984/1). We would like to thank the two anonymous reviewers for their valuable feedback which has contributed to improve the quality of the manuscript.
Data availability statement
The data that support the findings of this study are openly available at the following URL/DOI: https://doi.org/10.5285/1bb90673-ad37-4679-90b9-0126109639a9.
Supplementary data (2.2 MB PDF)