

Abstract
Rates and drivers of natural forest regeneration are areas of uncertainty for policy, forest management and climate change mitigation. In this study, the rate of deforestation and the rate and drivers of natural regeneration are described for 56 million hectares of village land in Tanzania, a country undergoing rapid deforestation. To determine the regeneration and deforestation rates, remote sensing (RS) data for 500 randomly selected points were reviewed for a 34 year period from 1987 to 2021 using Google Earth Engine. Over this period, regeneration, involving a transition from forest to non-forest and back to forest was detected on 4.8% of village land (95% CI: 3.1%–7.1%), while 0.8% of land transitioned from non-forest to forest (95% CI: 0.2%–2.04%). 22% of village land was deforested (95% CI: 18.6%–26.1%), equivalent to a mean annual net loss of 0.35 million hectares of forest. Using a combination of RS data, field plots and structured interviews, the land cover change trajectories of 180 regenerating plots, in 10 sampling clusters, were assessed to identify regeneration drivers and assess biomass and tree species accumulation rates. Agricultural fallows are the regeneration driver in 47% of plots (95% CI: 39.8%–54.8%). Other common regeneration drivers include abandonment of cultivated areas for reasons apart from fallowing, conservation and post wood-extraction abandonment in 19% (95% CI: 13.9%–26%), 18.3% (95% CI: 13%–24.8%) and 12.8% (95% CI: 8.3%–18.6%) of plots, respectively. The mean carbon sequestration rate was 1.4 Mg C ha−1 y−1, equivalent to 4.3 Tg C y−1 (95% CI: 3.9–4.7 Tg C y−1) across the 3.15 million hectares of regenerating village land forest. The mean species accumulation rate was 1.08 species y−1 (95% CI: 1.0–1.2). Regeneration time, location and precipitation have the greatest influence on biomass and species richness. The study highlights the potential for natural regeneration to contribute to global and national climate and biodiversity goals and to sustainable, productive forest management. The importance of cooperation and policy-alignment between the forest, agriculture and land sectors are under-scored.
Export citation and abstract BibTeX RIS

Original content from this work may be used under the terms of the Creative Commons Attribution 4.0 license. Any further distribution of this work must maintain attribution to the author(s) and the title of the work, journal citation and DOI.
1. Introduction
Increasing forest area, through natural regeneration, can benefit climate, biodiversity and local livelihoods [1–3]. Globally, forest regrowth is estimated to sequester 1300 Tg C y−1 [4]. Regenerating forests, including forest fallows in shifting-agriculture, provide ecological services and products vital to the livelihoods and climate resilience of millions of people [5–7]. Natural regeneration is also integral to the Bonn Challenge goal of restoring 350 million hectares of land by 2030 6 . However, rates and drivers of natural forest regeneration are uncertain despite being important for forest policy, forest management and climate change mitigation, and have received less attention than rates and drivers of deforestation, particularly in Africa [8–10].
With ∼48 million hectares of forest [11], Tanzania is a country in the early transition phase of the forest transition model, a trajectory from deforestation to reforestation that has been observed in many countries [12, 13]. Typical of countries in the early transition phase, the deforestation rate is increasing, while the regeneration rate is uncertain. Estimated regeneration rates for Tanzania range widely from 5–8000 ha y−1 (1990–2010, 11) to 25 342 ha y−1 (2000–2012, 14). Tanzania's forest reference emission level (FREL) excluded consideration of forest re-growth due to insufficient data [15].
There is also uncertainty on biomass increment rates in regenerating African forests with reported average rates for miombo and Acacia woodlands ranging from 1.2 Mg ha−1 y−1 to 4.2 Mg ha−1 y−1 over the first 14–35 years of re-growth [16–18]. Biomass accumulation rates are used to quantify the role of forests as carbon sinks [19] and to set sustainable harvesting rates [20], including for charcoal [21, 22], an important energy source across Africa [23]. While biomass accumulation rates are known to be affected by biophysical factors, land use history and connectivity [18, 24], there is also uncertainty around the relative influence of factors that trigger, enhance or inhibit regeneration [9, 25, 26].
With a focus on village land, in Tanzania, the study objectives are:
- 1.To assess the natural forest regeneration rate;
- 2.To assess the relative contribution of regeneration drivers;
- 3.To determine biomass and species accumulation rates, and their determinants, in naturally regenerating forests; and
- 4.To estimate carbon sequestration and sustainable harvesting rates in naturally regenerating forests.
2. Definitions, study area and methods
Figure 1 summarises the study's workflow.

Figure 1. An overview of the workflow of the study.
Download figure:
Standard image High-resolution image2.1. Definitions
For this study, forest is defined as an area of ⩾0.5 ha with ⩾10% canopy cover of trees ⩾3 m in height [15]. Natural regeneration is defined as a change in land cover from non-forest to forest, in an area that was historically forest, through natural growth, excluding anthropogenic tree-planting (based on [27]). Conversely, deforestation is defined as a change in land cover from forest to non-forest [28]. The regeneration rate describes the proportion of land covered in naturally regenerating forest. The regeneration rate is a sample-based estimate derived from remote sensing (RS) data. Regeneration drivers are the triggers that directly result in the conversion of land from non-forest to natural forest. Often, this will be the cessation of an activity such as cultivation. Regeneration drivers often comprise an absence of human activity, in contrast to the presence of human activities that characterise most deforestation drivers [29]. Underlying the direct regeneration drivers, are complex, multi-scale interactions between economic, policy, demographic and biophysical influences [30].
2.2. Study area
The study area is village land in mainland Tanzania (figure 2(a)). Village land is legally defined as 'land, other than reserved land, which the villagers have...been regularly occupying and using ... including land lying fallow' [31]. As there is no published map of village land, it was mapped as a residual class excluding government-owned protected areas (including all mangrove forest) and plantations, urban areas, and private estates. The village land map was overlain onto the land use/land cover map prepared by the National Forest Resources Monitoring and Assessment of Tanzania [11]. The map is mainly derived from Landsat data and uses a vegetation classification system compatible with the FAO Global Forest Resources Assessment. Vegetation types include lowland deciduous forest, woodland, bushland and thicket [11]. Village land classified as grassland (3.2 Mha) or lowland and montane forest (0.6 Mha) by [11] were excluded as being inappropriate for sustainable forest-product harvesting (Objective 4). The study area covers 56 295 277 ha, 61% of mainland Tanzania.
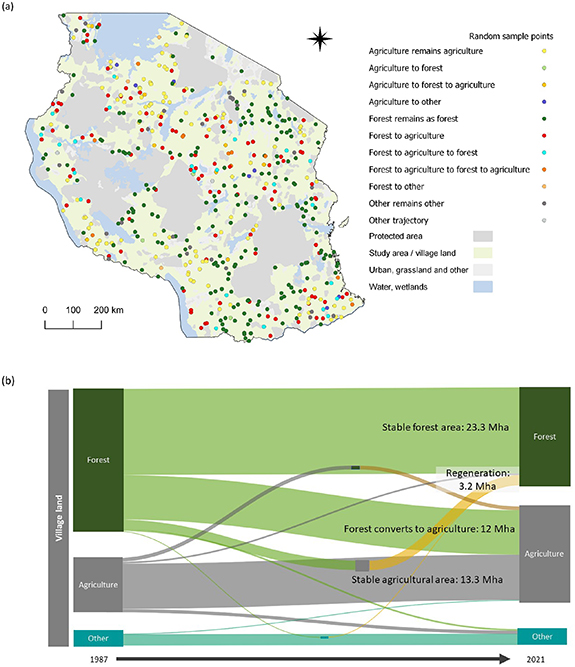
Figure 2. Land cover change trajectory results. (a) Map of land cover change trajectories for 500 randomly selected remote sensing sample points across village land in mainland Tanzania; and (b) Sankey chart showing land cover change transition on village land in Tanzania from 1987 to 2021. The width of the flows is proportional to the area of land transitioning between classes. For land that transitions, once or more, through an intermediary class (e.g. forest or agriculture), the transitioning flow overlaps the stable flow for the intermediary class, such as the regeneration flow's midway overlap with the stable agriculture flow. The timing of land cover change varies between sample points and is not to scale in the chart. 'Other' includes areas of settlement, road, grassland and wetland. See S1.1 for detailed class descriptions. Made with SankeyMATIC https://sankeymatic.com/.
Download figure:
Standard image High-resolution image2.3. Land cover change trajectories
Using Google Earth Engine (GEE) [32], land cover change trajectories of 500 15 m radius, randomly located points were reviewed visually, based on 1987–2021 data from Landsat 5, 7 & 8, PALSAR 1 & 2 and Sentinel 2 (figure 2(a)). High-resolution images from Google Earth Pro were also used. For each year that one or more images were available per remote sensing sample point (RSSP), land cover was classified using standardised land cover classes such as forest, woodland, bushland and agriculture (S1.1). Three assessors carried out independent analyses of a subset of RSSPs, followed by a joint review, until reaching 90% consistency [33]. RSSPs were classified into one of 21 land cover change trajectory classes and, where applicable, the year(s) when deforestation events and/or the first indication of regeneration occurred, were documented. The median starting year for the analysis was 1987. A 1987 Landsat 5 image was available for 49% of RSSPs. On average, for each RSSP, there was one or more usable image for 26 of the years between 1987 and 2021 (Range: 14–34 years). Confidence intervals were calculated in r using the binom.test tool.
2.4. Field survey sampling strategy
For the field survey, a clustered sampling strategy was applied with ten clusters in separate administrative districts (figures 3(a), S1.11). Clustered sampling has been widely used in forest biomass research [34]. The first ten RSSPs to be classified as regeneration from Step 2 (figure 1), were used to identify the sampling clusters (Step 3). This provides a random sampling basis for the identification of the clusters. For each cluster, 19 additional points of natural regeneration were selected by visually reviewing the land surrounding the original RSSP (Step 4). The land cover change trajectory of each field survey sample plot (FSSP) was documented from 1987 to 2021 using the GEE datasets [35]. For each sampling cluster the study area was limited to land within ±150 m in elevation, relative to the original sample point. FSSPs were selected as close as possible to the original point with at least 25 m between FSSPs. The field survey was carried out between 4 October 2021 and 23 November 2021, before the rainy season.
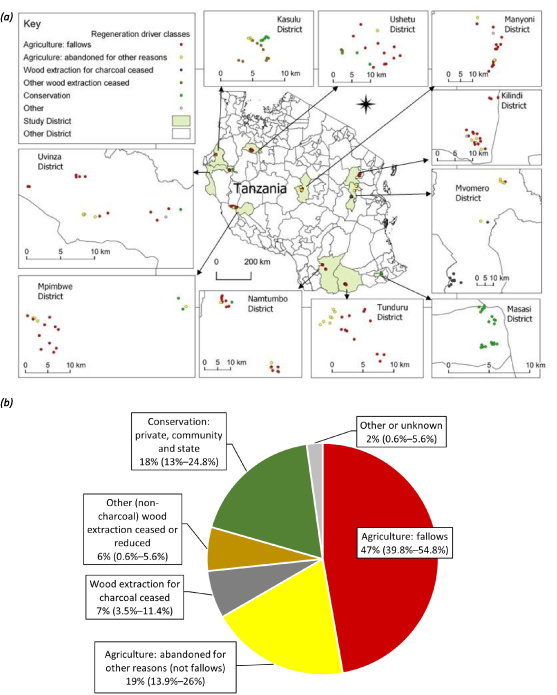
Figure 3. Distribution and frequency of regeneration drivers (a) Map of field survey sample points showing main regeneration driver at each point; (b) frequency of regeneration drivers (95% confidence interval).
Download figure:
Standard image High-resolution image2.5. Vegetation plots
Each FSSP is a 0.07 ha 15 m horizontal radius circular plot. Plot centre coordinates were recorded using handheld Garmin 64s GPS units. The diameter breast height (dbh) and species were recorded for all stems >5 cm. Stump diameter was measured at 30 cm or, if height was <30 cm, the top height and diameter. All trees with <5 cm dbh and ⩾135 cm height, were measured in a 1 m horizontal radius sub-plot at the centre of the main plot. Data was recorded on mobile phones using the Open Data Kit (ODK) tool [36] and uploaded as network allowed. The method is based on Tanzania's national forest inventory protocols [37]. Horizontal plot radius was adjusted for slope in the field. 360° photographs were taken of each plot. Observations of canopy cover and height, and land use were documented with additional information on features of interest.
2.6. Structured interviews (SIs)
At each FSSP, people knowledgeable about the local area were interviewed ( = 3 informants/FSSP; range: 1–5). The 642 interviewees included district and/or village government representatives at 80% of FSSPs. Where possible, the landowner (29% of FSSPs) was interviewed. In 58% of FSSPs, one or more person considered themselves to be 'very familiar' with the land. The SIs were carried out in, or close to, the FSSP. Interviews were conducted in Swahili. Responses were recorded on ODK forms, available in Swahili and English.
Interviews covered the land use/cover history of the plot, including questions on cultivation, livestock, charcoal, tree-cutting for timber, fuelwood and building-materials, fire, wildlife-herbivory and physical events such as floods and landslides (S1.5).
2.7. Calculating stand parameters
2.7.1. Vegetation type
Plots were classified into four vegetation types, based on species composition: Acacia-Commiphora bushland, Itigi bushland-thicket, lowland deciduous forest and miombo woodland (MW) [37].
2.7.2. Height
Tree-height (H) was estimated for all stems, for the bushland and lowland forest classes, using equations (1) and (2), respectively. Height was not measured for all trees but is a required variable for the optimal biomass models for bushland and lowland forest [38].
Equation 1 Diameter to height model for Acacia-Commiphora bushland [39]
Equation 2 Diameter to height model for lowland forest [39]
2.7.3. Above ground biomass (AGB)
AGB (Y) values include alive and standing dead trees (>135 cm height). Biomass cleared during the preceding 3–4 years, based on stumps, is also included. AGB was calculated using the equations:
Equation 3 Model to predict biomass for Acacia-Commiphora bushland [40]

Equation 4 Model to predict biomass for bushland-thicket [41]

Equation 5 Model to predict biomass for miombo woodland [42]

Equation 6 Model to predict biomass for lowland forest [38]

where Y = biomass (Mg); W = wood density (g cm−3); D = diameter at breast height (cm); H = height (m).
Species-specific wood-density estimates were extracted from the BIOMASS package in R [43].
To exclude biomass that accumulated before the regeneration time, remnant biomass was calculated and deducted (S1.7), affecting 119 trees in 51 FSSPs out of a total of 9757 trees in the 180 FSSPs.
2.7.4. Tree species richness (SR)
Number of species of alive and dead trees and stumps in the sub-plot and main plot.
2.7.5. Stem density
Disaggregated count of alive and dead stems >135 cm height, and of stumps, extrapolated to a per hectare value.
Stand parameters were calculated in R [44].
2.8. Regeneration time
Regeneration time was determined using the RS data, the results of the SIs and field survey observations. Interviewees reported the year in which cultivation or other human activities last occurred. For the 167 points with both RS and SI regeneration starting years, 57% differed by ⩽5 years. The year in which regeneration was first detected using the RS data was usually later than the SI-reported year that cultivation, or another activity, stopped, likely reflecting the time taken for regeneration to be detectable using RS.
2.9. Random forest (RF) for regression
The influence of 10–11 variables (table 1) on AGB and SR was assessed using the RFs for Regression package [45]. Vegetation was only considered for the 'all plot' analysis. Number of trees was set to 601. Number of variables at each split used the default value of 1/3 of the number of variables. The variable 'District' was included as a proxy for other place-based influences. As only six points were in the Itigi bushland-thicket class, it was merged with the Acacia-Commiphora bushland class, for this analysis.
Table 1. Variable descriptions and random forest regression results for above-ground biomass and species richness.
| Rank for influence on biomass | Variable | Mean accuracy decrease (%IncMSE): how much the RF model accuracy decreases, if we exclude the variable. Highest values per vegetation class are in bold | Variable description | Data source | Number of plots in which the variable was present (% plots) or summary statistics (time, precipitation) | |||||||
|---|---|---|---|---|---|---|---|---|---|---|---|---|
| Above ground biomass | Species richness | |||||||||||
| All | BA&BT | CL | MW | All | BA&BT | CL | MW | |||||
| All variables | 34.1 | 19.9 | 39.4 | 31.0 | 63.4 | 20.9 | 42.8 | 52.9 | ||||
| 1 | Time | 24.3 | −1.1 | 8.5 | 37.9 | 10.2 | 9.8 | 0.7 | 8.0 | Years since the most recent regeneration period began | Remote sensing |
= 14.85 y, σ = 6.3 y, max = 30 y, min = 3 y, n = 180 |
| 2 | Precipitation | 22.3 | 13.9 | 15.9 | 3.1 | 22.4 | 10.6 | 11.3 | 18.8 | Mean annual precipitation (mm) | Precipitation WorldClim V1 Bioclim |
= 992 mm y−1, σ = 191 mm y−1, max = 1308 mm y−1, min = 582 mm y−1, n = 180 |
| 3 | Sampling cluster | 17.4 | 10.1 | 13.7 | 5.1 | 39.4 | 8.6 | 23.0 | 28.8 | Sampling cluster, representing location-specific factors and correlated with precipitation | Interviews and maps | N/A |
| 4 | Deforestation driver | 12.9 | 2.9 | 0.6 | 6.9 | 9.5 | 6.4 | −1.0 | 6.9 | Index for the proximate deforestation driver (prior to the most recent regeneration period): 1 = cultivation, 2 = tree cutting (refugee camp, tobacco), 3 = charcoal, 4 = livestock, 5 = landslide or flooding | Interviews and observations | Cultivation = 154 (86%), tree-cutting = 13 (7%), charcoal = 10 (6%), livestock = 2 (1%), landslide/flooding = 1 (1%) |
| 5 | Vegetation | 9.6 | N/A | 15.1 | N/A | Vegetation class: Bushland (including thicket), Lowland Forest or Woodland | Classification based on species composition | N/A | ||||
| 6 | Livestock | 7.0 | −0.5 | 9.8 | −5.2 | 18.0 | 4.7 | 6.0 | 8.1 | A livestock-grazing intensity index: 4 = High. 12 months & >50 animals, 3 = Medium. Residual class between 2 & 4, 2 = Low. < 3 months & < 50 animals, 1 = No evidence of livestock-grazing | Interviews and observations | Total presence = 111 (62%) high = 59 (33%), medium = 47 (26%), low = 5 (3%), no livestock = 69 (38%) |
| 7 | Tree-cutting | 6.8 | 5.0 | −0.1 | 1.9 | 8.3 | 3.4 | 4.1 | 4.2 | Presence/absence of tree-cutting, excluding tree-cutting specifically for charcoal production | Interviews and observations | 37 (21%) |
| 8 | Cultivation | 6.6 | 6.0 | 0.2 | 4.7 | 7.8 | 7.3 | 0.8 | 5.7 | Presence/absence of cultivation at any point after 1987 | Interviews and observations | 155 (86%) |
| 9 | Fire | 5.4 | 3.5 | −2.1 | 2.2 | 6.7 | −2.9 | −2.5 | 4.6 | Fire frequency in the plot, as an index: 4 = annually, 3 = regularly but not annually, 2 = occasionally/residual presence class, 1 = no evidence of fires | Interviews and observations | Total presence = 105 (58%) annually = 21 (12%), regularly = 41 (23%), occasionally = 43 (24%), no sign of fire = 75 (42%) |
| 10 | Conservation | 2.8 | 0.0 | 1.3 | 1.0 | 9.0 | 0.0 | 6.7 | 11.0 | Presence/absence of conservation designation. Includes village land forest reserves, wildlife management areas and government forest reserves | Interviews and observations | 26 (14%) |
| 11 | Charcoal | −1.1 | −2.5 | 1.4 | 2.8 | 7.8 | 4.3 | 1.9 | 0.9 | Presence/absence of charcoal kilns or tree-cutting for charcoal production | Interviews and observations | 34 (19%) |
Vegetation classes BA: Bushland, BT: Thicket, CL: Lowland forest, MW: Miombo woodland. a The influence on AGB of elephant and goat herbivory, recorded in 12 and 72 plots respectively, were tested but did not improve model accuracy.The bold values indicates highest values per vegetation class.
2.10. Carbon calculations
Total carbon stored in regenerating village land was calculated using equation (7).
Equation 7 Model to calculate total carbon stored in regenerating forests on village land

where
C = total carbon in regenerating forest on village land (Tg)
A = village land area: 56 295 277 ha
b = % study area under regeneration: 5.6%, based on the study results, equal to 3 152 536 ha
x = mean AGB in FSSPs equal to 39.2 Mg ha−1
y = biomass to carbon conversion factor: 0.47 [46].
3. Results and discussion
3.1. Regeneration and deforestation rates
Natural regeneration was detected on 5.6% (95% CI: 3.75%–7.99%) or 3.15 Mha of village land in 2021, of which 4.8% (95% CI: 3.1%–7.06%) and 0.8% (95% CI: 0.22%–2.04%) of points were forest and non-forest in 1987, respectively (figures 2(a) and (b)), comparable to rates in southern Tanzania (4%) and the Brazilian Amazon (∼4%) [47, 48]. This means that only 0.8% (0.45 Mha) of village land gained forest, when comparing land cover in 1987 and 2021, similar to the 0.34% recorded for 2000–2012 in Tanzania by [14]. In contrast, 21.4% (95% CI: 17.8%–25.26%) (12.05 Mha) of village land was converted from forest in 1987 to agriculture in 2021, with an additional 0.8% (95% CI: 0.22%–2.04%) (0.64 Mha) converted from forest to residential or other non-agricultural use. Regeneration, including long fallow, is a rare land class. Conversion of forest land to permanent agriculture is the dominant trend, supporting findings by other land cover change studies in the area [49, 50].
Overall, Tanzania experienced a net transfer of 21.4% (95% CI: 17.88%–25.26%) of village land from forest to non-forest, equivalent to 12.05 Mha. Since only 68.4% (95% CI: 64.12%–72.46%) or 38.5 Mha of village land was forest in 1987, the proportion of village land forest that has been converted to non-forest is higher, at 32.46% (95% CI: 27.52%–37.7%). Over the 34 year study period, this is equivalent to a mean net loss of 0.35 Mha y−1 or a mean gross loss of 0.37 Mha y−1. This is lower than the 0.47 Mha y−1 gross deforestation rate for 2002–2013 reported in Tanzania's FREL [15]. This reflects the study's longer timescale and accelerating deforestation over this period. The median year that deforestation occurred was 2010 indicating more deforestation in the final decade of the study period than in the preceding two decades. Using data on the most recent year that each deforested point transitioned from forest to non-forest (figure 1. Step 2), 11% (95% CI: 8.22%–13.86%) (6.08 Mha) of village land transitioned from forest to non-forest between 2011 and 2021 equal to a village-land deforestation rate of 0.608 Mha y−1. This also indicates that Tanzania's deforestation mostly occurs on village land, not in protected areas. Some land (6.8% (95% CI: 4.75%–9.37%)) fluctuated temporarily between classes before returning to its original class, including land that cycled once or twice from forest to agriculture and back to forest (4.6% (95% CI: 2.94%–6.82%)), or passed through one or two cycles of transitioning from agriculture to forest and back to agriculture (1.8% (95% CI: 0.83%–3.39%)). These fluctuations are overlooked by land cover change analyses that only compare land cover at the beginning and end of a study period [14]. The mean regeneration time for the RSSPs with regenerating forest was 10.9 y (σ = 6.8 y, range: 1–22 y, n = 28).
Regenerating forest is sparsely distributed in a band from east-central to west-central Tanzania, with a few points in the south-east (figure 2(a)), similar to [14]. Stable forest areas are abundant in the north-east and south, while stable agricultural areas are abundant in the south-west and north-west. Deforestation is highest along the coast and in an east-west swathe across central Tanzania, a pattern also detected by previous studies [11, 14, 49].
3.2. Regeneration drivers
Most regeneration is triggered by a cessation of cultivation, either for fallowing (47.2% of FSSPs (95% CI: 39.8%–54.8%)) or for other reasons such as labour shortage or poor soil (19.4% of FSSPs (95% CI: 13.9%–26.0%)) (figures 3(a) and (b)). That fallows are the most common regeneration driver indicates that shifting-cultivation continues to be practised in Tanzania, despite a regional decline [51, 52]. Fallows' dominance in Tanzania's forest regeneration dynamics, is also a product of applying IPCC deforestation and FAO regeneration definitions based on land cover, rather than land use. Where conservation is the main regeneration driver (18% of FSSPs (95% CI: 13.0%–24.8%)), forest was being conserved by private landowners including for beekeeping, communities as village land forest reserves and local government in an area of village land recently designated as a government forest reserve. Post-charcoal production regeneration (6.7% of FSSPs (95% CI: 3.5%–11.4%)) was found in only one district. The cessation of other wood extraction was also uncommon (6.1% of FSSPs (95% CI: 3.1%–10.7%), mostly recorded in Kasulu District following the closure of a refugee camp.
Data from 180 FSSPs, out of the original 200 FSSPs were used in the analysis. Detecting regeneration using RS datasets is challenging due to the long timescales, high variability and limitations of RS in distinguishing between early regeneration, crops, woodlots or agroforestry [53]. Type 1 errors occurred on five occasions where the points were identified as natural regeneration but were found to be cassava cultivation (4 points) and a woodlot (1 point). These points were replaced with nearby, alternative points. Fourteen FSSPs, cleared between the last GEE image and the survey team's arrival, are excluded from the analysis.
3.3. Above ground biomass
AGB varied from 3.9 Mg ha−1 to 134.4 Mg ha−1 ( = 39.2 Mg ha−1
σ = 22.7 Mg ha−1) (table 2). Including biomass accumulated prior to the regeneration period, maximum biomass was 180.9 Mg ha−1 ( = 42.4 Mg ha−1
σ = 25.6 Mg ha−1, n = 180). Compared with national average biomass values, the FSSP results are similar for MW, higher for bushland and lower for lowland forest, where national averages are 42.5 Mg ha−1 for open woodland; 19 Mg ha−1 for dense bushland and 92.9 Mg ha−1 for lowland forest (applying a 2.13 carbon to biomass conversion coefficient [46] to carbon values in [54]). This indicates that, on average, the AGB of regenerating bushland and woodland is at least as high as the national average, while lowland forest recovery is slower, comparable to results from Zambia [55] and the Congo Basin respectively [26, 56].
Table 2. Summary values for above ground biomass (excluding remnant trees), species richness and stem density for all plots and disaggregated by vegetation type.
| Above ground biomass (Mg ha−1) | Species richness (number of species/plot) | Stem density (ha−1) | ||||||||||
|---|---|---|---|---|---|---|---|---|---|---|---|---|
| Vegetation type | All | BA & BT | CL | MW | All | BA & BT | CL | MW | All | BA & BT | CL | MW |
| Min | 3.9 | 3.9 | 5.3 | 8.0 | 2 | 2 | 2 | 4 | 71 | 198 | 71 | 722 |
| Max | 134.4 | 134.4 | 116.7 | 94.7 | 32 | 17 | 27 | 32 | 48 496 | 20 471 | 48 496 | 32 623 |
| Mean | 39.2 | 29.3 | 39.5 | 44.1 | 14 | 8 | 13 | 17 | 4594 | 2831 | 6396 | 4407 |
| Standard deviation | 22.8 | 26.5 | 22.7 | 19.2 | 7 | 4 | 7 | 7 | 7269 | 5101 | 9982 | 6021 |
| Median | 35.4 | 22.1 | 35.6 | 39.9 | 12 | 8 | 12 | 17 | 1514 | 806 | 1514 | 1691 |
Previous studies, in East African woodlands, find that precipitation, vegetation type, regeneration time, human actions and wildlife affect AGB and SR in regenerating areas [24]. Based on the study's RF regression models, time, precipitation and location/district have the strongest influence on AGB, with vegetation type, fire, livestock and the deforestation driver, having a moderate overall influence (table 1, figures 5, S1.10). Livestock were most influential in lowland forest, exceeding the influence of regeneration time. Charcoal, tree-cutting, pre-regeneration cultivation and conservation had a negligible influence. AGB in the bushland class could not be explained by time (figure 4(a), table 1). The importance of time, disturbance type and fire is in line with other studies [5, 16].
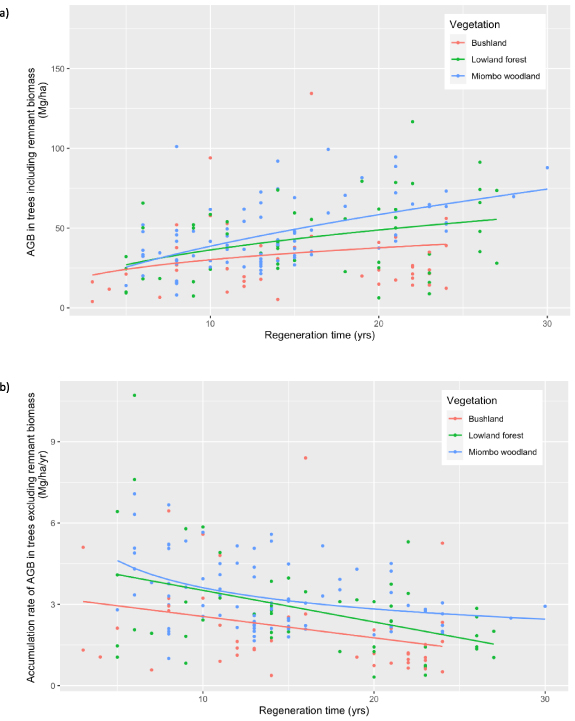
Figure 4. (a) Above ground biomass in trees (AGB), including remnant biomass, over time, showing nonlinear regression model trendlines (RMT) and (b) AGB accumulation rate, excluding remnant biomass, over time with linear RMT for bushland and lowland forest and non-linear RMT for miombo woodland. Model type (linear or non-linear) was selected based on the lowest Akaike Information Criterion for each vegetation type.
Download figure:
Standard image High-resolution image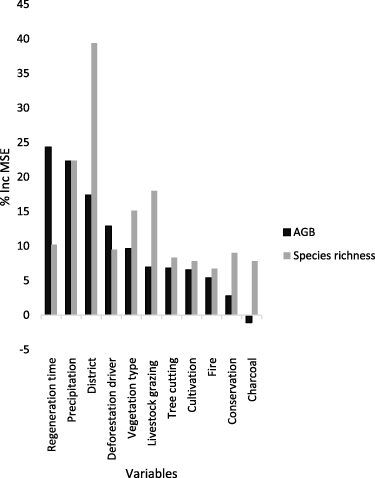
Figure 5. Influence of variables (% increase in the mean-squared error of the random forest regression model, if the variable is excluded) on above ground biomass (including stumps, excluding remnant trees) and species richness for all plots. See table 1 for a description of the variables.
Download figure:
Standard image High-resolution image
The RF models that included stump biomass, but excluded remnant tree biomass, explained 37.6% of the variance, compared with only 26% and 22% of variance explained respectively when both remnant biomass and stumps were excluded, or both were included.
The mean biomass accumulation rate, calculated as biomass (excluding remnant tree biomass) over regeneration time, was 2.9 Mg ha−1 y−1 (σ = 1.68 Mg ha−1 y−1, n = 180). It was lowest in bushland ( = 2.13 Mg ha−1 y−1, σ = 1.78 Mg ha−1 y−1, n = 43) and highest in MW ( = 3.35 Mg ha−1 y−1, σ = 1.29 Mg ha−1 y−1, n = 86). Other studies in MW report rates ranging from 1.2 Mg ha−1 y−1 [16] to 4.2 Mg ha−1 y−1 [55] in Zambia; and 1.4 Mg ha−1 y−1 in Mozambique [57]. In drier Acacia woodlands, a rate of 1.3 Mg ha−1 y−1 was recorded over a 14 year period, in Kenya [17] while in semi-deciduous forest in Ivory Coast the rate was higher at 4.23 Mg ha−1 y−1 [18].
Biomass accumulation rates were highest in the 5–10 year FSSPs and declined with age (figure 4(b)). This is earlier than records of 12–14 years for Acacia woodland [17], 18 years for MW [24] and 37 years for West African forest [18]. Stem stocking-density in the plots was high ( = 4594 stems ha−1, σ = 7269 stems ha−1, range: 71–48 496 stems ha−1) (table 2). 80% of stems were <10 cm dbh ( = 8.3 cm dbh, median = 7.0 cm dbh, σ = 1.29 cm dbh, n = 14 310). Thus, although biomass increases rapidly, at 20 years only 20% of stems meet a 10 cm dbh minimum harvestable-stem criterion [58]. While the peak biomass accumulation rate supports a 10 year charcoal harvesting rotation, similar to other studies' recommendations of 8–15 years in MW [58] and 12–14 years in bushland [17], a 20 year rotation gives time for stems to reach 10 cm dbh.
3.4. Tree species richness
267 tree species were recorded in the 180 plots. Tree SR per FSSP ranged from 2 to 32 species/plot ( = 14, σ = 7.2 species/plot) (table 2). The mean tree SR per FSSP for MW ( = 17), lowland forest ( = 13) and bushland ( = 8) are all more than double the national inventory mean tree SR of 6, 6 and 3 per 15 m radius plots for the respective vegetation types [59]. The results contrast with other studies which have recorded no significant difference [55, 57] or slightly higher [46] SR in regenerating sites of >20 y or >30 y, compared with mature woodland, while younger regenerating areas had lower SR than mature woodland [60]. This may reflect the positive correlation between human activity and SR given the study's inherent bias in locating the FSSPs in post-cultivation areas [61].
Comparative studies of species composition in regenerating and mature African woodland indicate significant differences [16, 55, 57, 58, 60]. In contrast, the study found similarities between the common FSSP species and national forest inventory results whereby the five most common tree species in the FSSPs were Julbernardia globiflora, Vachellia tortilis, Brachystegia spiciformis, Diplorhynchus condylocarpon and Uapaca kirkiana, comprising 13.3%, 4.5%, 4.1%, 4.1% and 3.4% of all FSSP trees. All five species are in the top 16 most common trees in Tanzania, including three of the five most common species [11].
The RF regression across all plots showed that SR was influenced by location/district, precipitation, livestock-grazing, vegetation type and time, in order of importance (table 1, figure 5). For MW, conservation was influential. The RF models explained more of the variance in SR, than for AGB, with the highest proportion of variance explained by the RF model for SR for all vegetation types (64%). Least successful was the model for bushland AGB (22%). In general, the models performed poorly in the bushland class.
The mean species accumulation rate, calculated as SR over regeneration time, was 1.08 species y−1, (σ = 0.69 species y−1). It was higher in MW ( = 1.34 species y−1,
σ = 0.69 species y−1,
n = 86) and lowland forest ( = 1.01 species y−1, σ = 0.63 species y−1, n= 51) than in bushland ( = 0.63 species y−1, σ = 0.5 species y−1, n = 43). The results are similar to rates recorded in Mozambique [60] and higher than in Zambia [16].
3.5. Carbon and climate implications
Regenerating forests on village land sequester 1.4 Mg C ha−1 y−1 (95% CI: 1.25–1.48 Mg C ha−1 y−1) based on a mean AGB accumulation rate of 2.9 Mg ha−1 y−1 (95% CI: 2.66–3.15 Mg ha−1 y−1) and 0.47 biomass-carbon conversion factor [46]. This is comparable to sequestration rates of 1.3 ± 0.3 Mg C ha−1 y−1 in the Brazilian eastern Amazon [48]. The 3.15 Mha of regenerating village land forests sequester approximately 4.3 Tg C y−1 (95% CI: 3.94–4.67 Tg C y−1) equivalent to ∼36% of Tanzania's deforestation emissions (11.9 Tg C y−1 according to Tanzania's FREL) [15], a higher offset rate than the Brazilian Amazon [48, 62]. In terms of carbon storage, there were ∼58.14 Tg C (95% CI: 53.21–63.07 Tg C) (excluding remnant trees) in regenerating village land forests, in 2021.
3.6. Forest policy and management implications
Since agriculture is the main driver of both deforestation [63] and forest regeneration, more forestry-agriculture coordination is needed to optimise land allocation to meet both sectors' goals. The results show that long-fallows comprise a substantial spatial and temporal reservoir for carbon and biodiversity. While recognising their ephemerality, long forest-fallows, integral to shifting-cultivation, may offer win-wins for agriculture, climate and biodiversity relative to land solely under intensive agriculture. This requires policy support [64]. Forest conservation, both by communities and private landowners, is another policy-led regeneration driver, frequently detected by the study. The similarity in mean AGB between the studies' MW regeneration plots ( = 44.1 Mg ha−1) and national forest inventory results for open woodland ( = 42.5 Mg ha−1), indicates that naturally regenerating areas can attain comparable levels of AGB to surrounding vegetation within 5–10 years, often with negligible management. This gives empirical support to policy proposals to promote sustainable timber and charcoal harvesting in community-managed woodlands [65] and highlights natural regeneration's potential as a biodiversity-enhancing forest restoration tool [66, 67], with implications for the Bonn Challenge and Tanzania's target to restore 5.2 million ha of forest by 2030 [68]. While it is necessary to exclude cultivation for natural regeneration to proceed, other activities including charcoal-production and livestock-grazing may be compatible in some habitats.
Tanzania has lost 32.46% of village land forests since 1987, a finding relevant to policies to reduce deforestation, including REDD+. In its Intended Nationally Determined Contribution, Tanzania committed to reduce greenhouse gas emissions by up to 8.35 Tg C y−1 [69]. The study indicates that village land natural regeneration is equivalent to 51.6% of this target.
4. Conclusions
Natural regeneration has the potential to contribute to global and national goals to restore forest cover, store carbon, conserve biodiversity and enhance livelihood resilience. However, in Tanzania, it is a rare land class with just 5.6% of village land under natural regeneration. In contrast, 22.2% of village land changed from forest to non-forest, predominantly to agriculture. Agriculture, primarily through fallows, is the main driver of natural regeneration. Biomass and species accumulation are most affected by time, precipitation and location. 10–20 year harvesting rotations for charcoal or other wood-based products would provide a balance between maximum biomass accumulation rates and minimum harvestable stem size. Despite their rarity regenerating forests accumulate over one third of Tanzania's annual carbon emissions from deforestation.
More research is needed on place-based factors affecting regeneration; bushland regeneration dynamics; and the potential for long-fallows to achieve positive agricultural, biodiversity and climate outcomes.
Acknowledgments
This work received funding from the European Research Council (ERC) under the European Union's Horizon 2020 research and innovation programme (Grant agreement No. 771492). The authors also acknowledge the Swiss Agency for Development and Cooperation for its support for the fieldwork for this research. We also acknowledge the UK's Economic and Social Research Council funding to Sallu, facilitating her contribution as part of the ESRC Centre for Climate Change Economics and Policy (ES/R009708/1). Spracklen was also funded through a Natural Environment Research Council (NERC) Grant (NE/M003574/1) and acknowledges a Philip Leverhulme Prize. We thank research assistants: Haruna Luganga, Said Shomari, Emmanuel Ndetto, George Bulenga, Faraji Nuru and Iddy Beya and all of the government officers and community members involved in the field surveys. We thank two anonymous reviewers for their valuable comments on an earlier draft.
Data availability statement
The data that support the findings of this study are openly available at the following URL/DOI: https://doi.org/10.5518/1295. Results of the structured interviews are available upon reasonable request from the University of Leeds Restricted Access Repository (RADAR).
Ethical approval
The research was reviewed and approved by the Research Ethics Committee of the University of Leeds. Reference: AREA 20-143.
Footnotes
Supplementary materials (2.6 MB PDF) Elaborated description of methods and results.