

Abstract
Recurrent hydrological droughts (streamflow deficits) are highly impactful and challenge water management. Regional studies have provided some evidence of drought-rich periods at specific time scales. However, it is yet unclear where and when droughts cluster in time. Here, we test for significant temporal hydrological drought clustering at subseasonal to multi-year time scales in different climate zones around the world using two different clustering metrics, i.e. the dispersion index and Ripley's K. We find that (1) only 10% of the catchments show temporal hydrological drought clustering, (2) hydrological droughts cluster from seasonal to 3-year time scales with clustering being strongest at an annual time scale; (3) arid catchments with a low snow fraction are most prone to temporal drought clustering; and (4) temporal clustering is more pronounced for hydrological than for meteorological droughts. These results suggest that besides climatic drivers, land-surface processes importantly influence the temporal clustering behavior of hydrological droughts.
Export citation and abstract BibTeX RIS

Original content from this work may be used under the terms of the Creative Commons Attribution 4.0 license. Any further distribution of this work must maintain attribution to the author(s) and the title of the work, journal citation and DOI.
1. Introduction
Consecutive droughts can have more severe impacts than droughts occurring in isolation. For example, consecutive droughts severely impact tree growth (Mijnsbrugge et al 2016), reduce forest productivity (DeSoto et al 2020), and increase tree mortality (Caldeira et al 2015, Anderegg et al 2020, Schuldt et al 2020, Obladen et al 2021, Sánchez-Pinillos et al 2022). Similarly, they can severely impact crop yields (Yu et al 2018) and impede vegetation recovery (Hari et al 2020). In addition, recurrent hydrological droughts, i.e. streamflow deficits, also substantially challenge water management by increasing pressure on water resources (Tramblay et al 2020) as illustrated by the consecutive 2018 and 2019 summer droughts in Central Europe (Boergens et al 2020, Hari et al 2020).
For meteorological drought, alternations between drought-rich and drought-poor periods have been documented at multi-year (Moreira et al 2015, Noone et al 2017, Yue et al 2021), decadal (Ionita et al 2012, Tong et al 2018), and multi-decadal time scales (Tanguy et al 2021). However, the existence of meteorological drought clustering is not unequivocal as some studies also provide evidence for a lack of cyclicity in precipitation deficits (Pelletier and Turcotte 1997, Bunde et al 2013). In addition, drought periodicity has been documented for hydrological droughts at decadal time scales (Hannaford 2015, Barker et al 2019). While these previous studies suggest that drought periodicity exists in certain regions and at certain time scales, they have a rather narrow geographical scope and focus mostly on meteorological droughts. Therefore, it is yet unclear which catchments are prone to the occurrence of drought-rich periods, i.e. show significant temporal clustering in terms of hydrological droughts, and how this clustering behavior relates to the temporal clustering of meteorological droughts.
Temporal clustering can be quantified using different types of metrics, including the dispersion index, which quantifies the departure from a homogeneous Poisson process (Vitolo et al 2009, Mediero et al 2015, Merz et al 2016); kernel estimation (Cowling et al 1996, Mudelsee et al 2003), which estimates the time variation of extreme event counts as smooth functions of time; or Ripley's K function (Ripley 1981, Dixon 2014, Tuel and Martius 2021a), which measures the average number of extreme events in the temporal neighborhood of extreme events. Such measures have been successfully used to demonstrate the existence of precipitation-rich (Tuel and Martius 2021a, 2021b) or flood-rich periods (Villarini et al 2013, Mediero et al 2015, Gu et al 2016, Merz et al 2016, Liu and Zhang 2017, Wang et al 2020). Here, we apply the concept to droughts and use two of these temporal clustering metrics to test whether and at which temporal scales hydrological droughts cluster in time. Our analysis focuses on drought clustering as opposed to drought persistence. That is, we study the occurrence of multiple drought events in close temporal succession, rather than the occurrence of individual, long, and persistent drought events. Specifically, we investigate (1) whether and how hydrological droughts cluster temporally in different hydro-climatic regions across the globe, (2) whether and how the temporal clustering of hydrological droughts varies between natural and regulated catchments, and (3) how the temporal clustering of hydrological drought relates to the clustering behavior of meteorological drought. We expect that hydrological droughts show substantially more temporal clustering than meteorological droughts because of memory introduced through different storage and land-surface processes (Alvarez-Garreton et al 2021, Ho et al 2021).
To address these questions, we compile a large-sample dataset of catchments in different climate zones of the world. We combine data available through different hydrological large sample datasets providing not just streamflow observations but also catchment boundaries and characteristics. We use this 'quasi-global' dataset to identify catchments showing significant temporal hydrological drought clustering at different time scales ranging from subseasonal, seasonal, annual, to multi-year scales. Then, we investigate how the physiographical and climatic characteristics of the catchments with significant temporal clustering differ from those without clustering. Finally, we investigate the relationship between meteorological and hydrological drought clustering to assess the relative importance of meteorological and land-surface processes for hydrological drought clustering.
2. Methods
2.1. Dataset
To identify catchments with significant temporal clustering at different time scales across climate zones, we compile a quasi-global dataset consisting of different large-scale and -sample datasets providing streamflow and catchment characteristics. We include nearly natural and regulated catchments with continuous daily streamflow time series of at least 30 years in the period 1981–2018 with  10% of missing data (missing data were omitted for drought identification). The selection consists of 5015 catchments, more specifically, 720 gauges in Central Europe from the LamaH dataset (Klingler et al
2021), 2683 gauges in the United States from the streamflow and basin characteristics dataset by Dudley et al (2018) (Dudley18), 208 gauges in Australia from the CAMELS-AUS dataset (Fowler et al
2021), 109 gauges in Chile from the CAMELS-CL dataset (Alvarez-Garreton et al
2018), 576 catchments in Great Britain from the CAMELS-GB dataset (Coxon et al
2020), and 733 catchments in Brazil from the Catchments Attributes for Brazil (CABra) dataset (Almagro et al
2021).
10% of missing data (missing data were omitted for drought identification). The selection consists of 5015 catchments, more specifically, 720 gauges in Central Europe from the LamaH dataset (Klingler et al
2021), 2683 gauges in the United States from the streamflow and basin characteristics dataset by Dudley et al (2018) (Dudley18), 208 gauges in Australia from the CAMELS-AUS dataset (Fowler et al
2021), 109 gauges in Chile from the CAMELS-CL dataset (Alvarez-Garreton et al
2018), 576 catchments in Great Britain from the CAMELS-GB dataset (Coxon et al
2020), and 733 catchments in Brazil from the Catchments Attributes for Brazil (CABra) dataset (Almagro et al
2021).
For the selected catchments, we retrieve a set of different catchment characteristics available in all datasets including catchment area (km2), mean elevation (m.a.s.l), catchment slope (∘), mean annual precipitation (mm), aridity (mean potential evaporation/mean precipitation), fraction of snow (0–1), and reservoir regulation (yes/no). In addition, we derive precipitation and potential evaporation (Ep ) time series for the period 1981–2018 for which streamflow data are available from the different large-sample datasets cited above. For the US catchments, we derived precipitation and potential evaporation time series from gridded ERA5-Land reanalysis data (ECMWF 2019, Muñoz-Sabater et al 2021) because the Dudley18 dataset used to obtain streamflow and regulation information does not provide hydro-climatic time series.
2.2. Drought event identification
For each catchment in the dataset, we identify a set of independent hydrological drought events using a variable threshold-level approach (Van Loon and Laaha 2015). To minimize the number of dependent events, we smooth the daily time series over a time window of 30 days prior to event extraction (Fleig et al
2006). We compute the variable threshold using the 20th flow percentile for each day of the year derived within a moving window ±15 days before and after the day of interest (Brunner et al
2021a, 2021b). Only drought events longer than 30 days are retained to limit the selection to important events. This event identification procedure resulted in a median number of 27 extracted events per catchment (1st quartile: 22 events, 3rd quartile: 31 events). For each of the selected drought events, we determine a set of characteristics including its day of occurrence (day of year), duration (i.e. time elapsing between the time when streamflow falls below the drought threshold and the time when it again exceeds this threshold, days), deficit (sum of streamflow drought intensities, i.e. differences between the threshold and actual streamflow, accumulated during an event, mm/event), and intensity (i.e. minimum flow, mm, the smaller the value the more intense). Using these event characteristics, we compute the mean drought seasonality using circular statistics (which are suitable for describing variables measured on a cyclical timescale; Burn (1997)), mean duration, deficit, and intensity for each catchment. We assess the sensitivity of our results toward threshold and minimum duration choice by running the temporal clustering analysis for different thresholds (15th, 20th, 30th percentile) and minimum durations (10 and 30 days). Choosing alternative lower (15th percentile) or higher (30th percentile) thresholds, results in the selection of fewer ( 25 events) or more events (40 events) per catchment, respectively. Including shorter events with durations longer than 10 days would increase the number of events to around or above 50 events per catchment depending on the threshold. In addition to hydrological droughts, we identify meteorological droughts in a similar way as hydrological droughts by applying the variable threshold-level approach to precipitation time series and precipitation-potential evaporation (P-Ep
) time series, i.e. by defining negative anomalies in precipitation and P-Ep
.
25 events) or more events (40 events) per catchment, respectively. Including shorter events with durations longer than 10 days would increase the number of events to around or above 50 events per catchment depending on the threshold. In addition to hydrological droughts, we identify meteorological droughts in a similar way as hydrological droughts by applying the variable threshold-level approach to precipitation time series and precipitation-potential evaporation (P-Ep
) time series, i.e. by defining negative anomalies in precipitation and P-Ep
.
2.3. Temporal clustering quantification
To identify catchments with significant temporal hydrological and meteorological drought clustering at different time scales, we use two different metrics, i.e. the dispersion index and Ripley's K. The dispersion index is defined as the ratio of the variance of drought event counts and mean drought counts within a specific time window similarly to the approaches used by Vitolo et al (2009) for storms and by Merz et al (2016) for floods. To compute this index, we first create a binary time series of drought event occurrences where the days of maximum drought intensity are indicated with 1's and all other days with 0's. That is, each drought event is counted only once, independent of its duration. Second, we count the number of droughts (c) within non-overlapping time windows of t days, where the time window t corresponds to subseasonal to seasonal time scales of 1, 30, 90, and 180 days and annual to decadal time scales of 1, 3, and 5 years. Third, the dispersion index is computed as

Finally, we test for clustering significance by running a bootstrap experiment (Merz et al 2016). That is, we simulate n = 1000 binary time series from a homogeneous Poisson process, in which events occur at random time points, with an occurrence rate corresponding to the mean occurrence rate of drought events in the observed time series. For each simulated drought count time series, we compute the dispersion index according to equation (1). Using the n indices, we derive the sampling distribution of the dispersion index and a critical value for a significance level of 5%, i.e. the 95th quantile of the sampling distribution. A time series is said to exhibit significant temporal clustering, if the observed dispersion index is larger than this critical value. If the observed drought occurrence time series shows no temporal clustering, it should show a similar behavior as a homogeneous Poisson process in which events are randomly distributed in time. In contrast, drought occurrence time series showing temporal drought clustering would deviate from a homogeneous Poisson process. An illustration of this procedure is provided for four example catchments in figure A1 in the supporting information.
Ripley's K is a cumulative function that has been traditionally used to study the spatial or spatio-temporal clustering behavior of point processes at different spatial scales (Ripley 1981). More recently, it has also been used to study the temporal clustering behavior of extreme events (Dixon 2014, Barton et al 2016, Tuel and Martius 2021a) and is defined as the average number E(t) of events within a time window t around a randomly chosen drought event

We again vary the time window t between subseasonal to seasonal time scales of 1, 30, 90, and 180 days and annual to decadal time scales of 1, 3, and 5 years. Finally, we also run a bootstrap experiment to test for clustering significance. That is, we simulate n = 1000 samples from a homogeneous Poisson process with the same event occurrence rate as the observations and compute  for each of these samples to derive a sampling distribution and critical value. For any given t, the data are significantly temporally clustered if the estimated K(t) from the observed data is greater than the 95th percentile of the simulated
  values. An illustration of this procedure is provided for four example catchments in figure A2 in the supporting information. We test for significant temporal drought clustering at different time scales for hydrological and meteorological droughts by applying the dispersion index and Ripley's K to streamflow, precipitation, and P-Ep
time series, respectively. To quantify the degree of clustering for different time scales, we determine the percentage (0–1) of catchments showing significant temporal clustering at a specific time scale.
values. An illustration of this procedure is provided for four example catchments in figure A2 in the supporting information. We test for significant temporal drought clustering at different time scales for hydrological and meteorological droughts by applying the dispersion index and Ripley's K to streamflow, precipitation, and P-Ep
time series, respectively. To quantify the degree of clustering for different time scales, we determine the percentage (0–1) of catchments showing significant temporal clustering at a specific time scale.
To assess the differences between catchments with and without significant clustering, we focus on a specific time scale, e.g. one year. We divide the catchments into two groups, those catchments which show significant temporal clustering at that time scale and those catchments that do not show any clustering at that time scale. Then, we summarize the catchment and drought characteristics of each group of catchments using boxplots to highlight the differences in characteristics between catchments with and without temporal hydrological drought clustering.
3. Results
3.1. Spatio-temporal drought variability
The catchments included in the quasi-global dataset are hydro-climatologically diverse, with drought seasonality (figure A3 in the supporting information) and drought characteristics varying across different climate zones (figures A4–A6).
Hydrological drought events in the Northern Hemisphere, i.e. in the US, GB, and Central Europe, mainly occur during the warm season (summer and fall) except in mountain regions where hydrological droughts are observed mainly in the cold season (figure A3). In the Southern Hemisphere, hydrological droughts in coastal regions mainly occur during the cold season, while hydrological droughts in the Amazon and Central Australia occur in fall and summer, respectively. These findings regarding hydrological drought seasonality are in line with previous studies which have shown similar spatial patterns when using a variable drought threshold e.g. for Europe (Sutanto and Van Lanen 2021). These diverse catchments, with respect to climate and hydrological drought seasonality, can have different behaviors in terms of the occurrence of drought events and their temporal clustering, as illustrated for two catchments in figures 1(b) and (c). The first catchment shows temporal clustering at seasonal time scales (figure 1(b)), meaning that hydrological droughts are likely to occur in subsequent seasons. The second catchment shows temporal clustering at longer, i.e. multi-annual time scales (1(c)), meaning that the catchment is affected by hydrological droughts in regular multi-annual intervals.

Figure 1. Temporal hydrological drought variability: (a) Locations of the 5015 catchments which are part of the quasi-global dataset and of the two example catchments. Temporal hydrological drought occurrences determined using the variable threshold-level approach (see section Drought event identification) for. (b) the Riss catchment at Warthausen (part of LamaH dataset) and (c) the Little Pee Dee catchment at Galivants Ferry (part of Dudley18 dataset).
Download figure:
Standard image High-resolution image3.2. Temporal drought clustering
Only a small part of the catchments analyzed ( 10%) show significant temporal hydrological drought clustering with the percentage of catchments varying by time scale (figure 2(a)).

Figure 2. Percentage of catchments showing significant temporal hydrological drought clustering per time scale (a) derived using the dispersion index and Ripley's K, (b) derived for different hydro-climatic regions using Ripley's K, and (c) derived for natural and regulated catchments using Ripley's K.
Download figure:
Standard image High-resolution imageTemporal hydrological drought clustering is most common at seasonal (180 days), annual (365 days), and multi-year time scales of up to 5 years independent of the clustering metric chosen. At a seasonal timescale, around 5% of the catchments show significant temporal clustering according to Ripley's K, at an annual scale, 10%, and at a 3-year time scale, 5% of the catchments. Hardly any significant temporal clustering is observed at sub-seasonal scales ( days) and at longer time scales exceeding 5 years. These findings are robust with respect to the choice of the clustering metric, except for longer time scales where the dispersion index still indicates some significant temporal clustering while Ripley's K does not. Because the results derived with the two metrics are very similar, the subsequent analyses will mostly focus on one of the metrics, i.e. Ripley's K, which has been used to study the temporal clustering behavior of a range of other extreme phenomena. The results are also robust with respect to the choice of the dataset as illustrated by the comparison of the results obtained for the quasi-global dataset and the results obtained for a different dataset containing 421 catchments in Europe part of the Global Runoff Data Center database (GRDC 2019) (figure A7 in the supporting information). Furthermore, these findings are independent of the exact hydrological drought definition (i.e. the exact drought threshold and minimum duration) chosen to identify drought events, with temporal clustering being strongest at seasonal, annual, and 3-year time scales independent of the drought threshold and minimum duration chosen (figure A8 in the supporting information).
In addition, the finding that temporal hydrological drought clustering is most common at seasonal, annual, and 3-year time scales applies to all six regions in our dataset (figure 2(b)). In most regions, temporal hydrological drought clustering is most common at an annual time scale (Brazil, Chile, Great Britain, United States), while in Australia and the Alps temporal hydrological drought clustering is most common at a 3-yearly time scale. However, the regions considered slightly differ in terms of the percentage of catchments that show significant clustering. Temporal hydrological drought clustering is most common in Brazil and Australia at an annual time scale and at a 3-year time scale, respectively, and least common in the Alps. While the percentage of catchments showing temporal hydrological drought clustering to some degree depends on the region, it is independent of whether catchments are natural or regulated (figure 2(c)). Catchments showing significant temporal hydrological drought clustering share some common characteristics as shown by our comparison of physiographical and drought characteristics for catchments with significant and non-significant temporal clustering (figure 3). Catchments with significant temporal clustering at an annual time scale (figure 3) have a small fraction of snow and/or are characterized by an arid climate with little precipitation input. They also show comparably long hydrological drought events, low minimum flows but small deficits. In contrast, wetter catchments and catchments influenced by snow are less likely to show significant temporal clustering at an annual time scale.
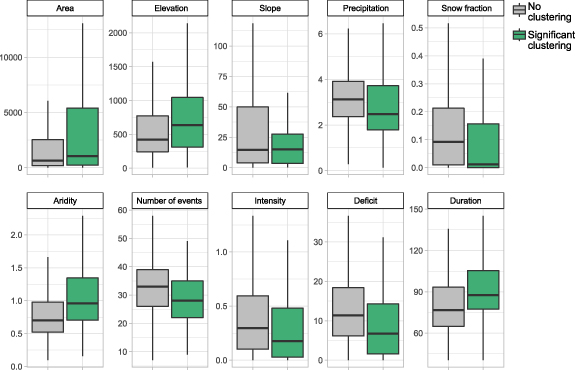
Figure 3. Catchment and hydrological drought characteristics of catchments with and without significant temporal hydrological drought clustering at an annual time scale according to Ripley's K: catchment area (km2), mean elevation (m.a.s.l), catchment slope (∘), mean annual precipitation (mm), fraction of snow (0–1), and aridity (mean potential ET/mean precipitation), number of drought events, drought intensity (i.e. minimum flow; mm/day), drought deficit (mm/event), and drought duration (number of days the streamflow is below the threshold). All differences between catchments with and without significant temporal clustering are statistically significant according to the Kolmogorov–Smirnov test.
Download figure:
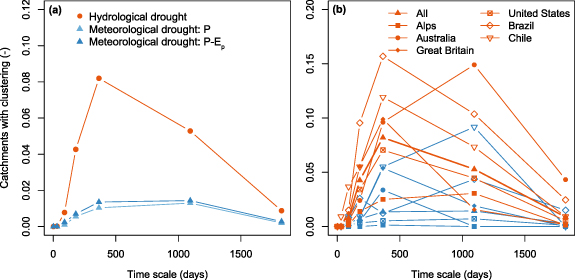
Standard image High-resolution imageTemporal clustering is even less common for meteorological droughts (P deficits and P-Ep deficits) than for hydrological droughts but follows the same pattern with respect to time scale (figure 4(a)). Hardly any catchments show temporal clustering for meteorological droughts (both derived based on P and P-Ep deficits) when looking at Ripley's K, while up to 10% of the catchments show significant clustering at seasonal, annual, and multi-annual (up to 5 years) time scales for hydrological drought. However, similar to hydrological droughts, temporal clustering of meteorological droughts is strongest at seasonal, annual, and 3-yearly time scales independent of the clustering metric chosen. In case of the dispersion index, there is still some temporal clustering at shorter time scales (up to 3%) but it is also much less common than for hydrological droughts. The finding that temporal clustering is more common for hydrological than for meteorological droughts applies to all regions (figure 4(b)) but the difference between the meteorological and hydrological temporal drought clustering is stronger for some than for other regions. For example, the difference between temporal meteorological and hydrological drought clustering is particularly large in Brazil, while it is relatively small in Chile.
Figure 4. Fraction of catchments with significant drought clustering at different time scales for Ripley's K for (a) hydrological vs. meteorological drought (defined using precipitation (P) and P-potential evaporation (Ep ) deficits) and (b) for hydrological and meteorological droughts (defined using Ep deficits) for all regions.
Download figure:
Standard image High-resolution image
4. Discussion
Our analysis included different methodological choices, i.e. the choice of the dataset, the drought definition and threshold applied, and the clustering metric, which influence the results to a certain degree. However, our sensitivity analysis shows that the results and conclusions are relatively robust toward the choice of dataset (figure A7 in the supporting information), drought threshold and minimum drought duration (figure A8 in the supporting information), and clustering metric (figure 2).
Our detection of significant hydrological drought clustering at different time scales, ranging from seasonal, over annual, to multi-annual time scales, expands findings of previous studies suggesting hydrological drought clustering at decadal time scales in the UK (Hannaford 2015, Barker et al 2019). While these regional studies have highlighted drought periodicity at longer time scales, we here show that temporal hydrological drought clustering is most common at seasonal to 3-year time scales using a dataset spanning different climate zones (figure 2). Our findings indicate temporal hydrological clustering in 5%–10% of the catchments considered, depending on time scale and region (figure 2(b)). Temporal hydrological drought clustering is in most regions more common at an annual than at a 3-yearly time scale, in particular in wet regions such as Brazil or Great Britain, while it is more common at a 3-yearly time scale in dry regions such as Australia. These regional differences in the importance of different time scales for temporal hydrological drought clustering, are on the one hand related to differences in the temporal clustering behavior of meteorological droughts (figure 4(b), meteorological drought clustering varies by region) and on the other hand to the memory of the system (figure 4(b), differences between meteorological and hydrological drought clustering vary by region), which is shorter in wetter than in drier regions (De Lavenne et al 2022). Short memories in wetter regions imply that droughts happening in any given year may influence the likelihood of drought occurrence in the next year but not in 3-years, while longer memories may result in drought influences on future droughts at longer than annual time scales. The relationship between meteorological and hydrological drought clustering varies by region (figure 4(b)) suggesting that the relative importance of climatic and land-surface effects for temporal hydrological drought clustering varies for regions characterized by different climate and catchment properties.
While up to 10% of the catchment show temporal clustering of hydrological droughts, only up to 2% of the catchments show significant temporal clustering of meteorological droughts (figure 4). Such relatively weak clustering of meteorological droughts is in contrast to findings of previous studies which documented meteorological drought variations at multi-year to multi-decadal time scales by assessing interannual and decadal drought variability (Ionita et al 2012, Yue et al 2021). These differences in the temporal clustering behavior of meteorological drought may be explained by the different methods and datasets used for the analyses. We focused on event occurrences independent of drought duration, while these previous studies focused either on very long events or on fluctuations in meteorological drought magnitude rather than occurrence.
Our finding that temporal hydrological drought clustering is substantially more common than the temporal clustering of meteorological droughts suggests that only looking at the temporal clustering of meteorological droughts does not provide a comprehensive picture of temporal clustering in the hydrological domain. There, additional land-surface processes appear to enhance temporal clustering, particularly in arid catchments and catchments without snow storage (figure 3). In addition, it supports our hypothesis that storage or the lack thereof importantly influence the temporal clustering behavior of hydrological droughts. That is, the less storage a catchment has, the higher is the likelihood that it shows temporal hydrological drought clustering. In a snow-dominated catchment, for example, regular streamflow contributions from snowmelt might prevent the development of recurrent hydrological droughts. In contrast, in an arid, precipitation-driven regime, subsequent hydrological droughts might develop if streamflow deficits develop as a result of low precipitation inputs in combination with low baseflow contributions related to persistently low groundwater levels. Similarly, recurrent hydrological droughts can also evolve if soil moisture is consistently low and remains unreplenished for a long time. The importance of land-surface processes for temporal hydrological drought clustering corroborates findings of earlier studies highlighting the important role of catchment memory for drought propagation (Van Loon and Laaha 2015, Alvarez-Garreton et al 2021).
Various local and regional studies provide evidence for the occurrence of drought persistence in the form of multi-year droughts both from a meteorological and hydrological perspective. The occurrence of multi-year meteorological droughts has for example been documented for France (Vidal et al 2010), Central Europe (Moravec et al 2021), and the United States (Goodrich 2007, Diffenbaugh et al 2015, Abatan et al 2018, Bales et al 2018) and the occurrence of multi-year hydrological droughts for different parts of Europe (Parry et al 2012, Folland et al 2015, Hanel et al 2018, Brunner and Tallaksen 2019) and Chile (Alvarez-Garreton et al 2021). The phenomenon of multi-year droughts is distinct from the temporal clustering behavior investigated in this study because it focuses on individual, long droughts compared to the multiple subsequent droughts studied here. However, the two phenomena—multi-year and temporally clustered droughts—might to some degree be related, as indicated by our finding that catchments with significant temporal hydrological drought clustering tend to be characterized by longer droughts than catchments without significant clustering (figure 3). For example, a long drought with slow recovery might prompt further subsequent droughts because the hydrological system might take a long time to fully recover from depleted groundwater storage. How exactly the two concepts of multi-year and temporally clustered droughts are related, remains to be investigated.
Our findings show that climate and the land-surface are important modulators of the temporal clustering behavior of hydrological droughts. In contrast, the degree of reservoir regulation does not affect the temporal clustering of hydrological drought (figure 2(c)). While the impact of reservoir regulation does not influence the temporal clustering of hydrological drought, it has been shown to affect local (e.g. duration or deficit) and regional drought characteristics (e.g. spatial extent) or drought propagation (López-Moreno et al 2009, Wen et al 2011, Mix et al 2016, Wan et al 2017, van Oel et al 2017, Tu et al 2018, Brunner 2021, Ribeiro Neto et al 2022). These findings suggest that while reservoirs are able to alleviate drought magnitude, they may not necessarily prevent the occurrence of drought altogether, which results in small impacts on the temporal clustering behavior of hydrological drought as defined in this study. How other types of regulation such as groundwater abstraction affect the temporal clustering behavior of hydrological droughts remains to be investigated (Tijdeman et al 2018, Van Loon et al 2022). Overall, our finding that the temporal clustering behavior of hydrological droughts varies with climate and catchment characteristics stresses that the influence of climate and catchment characteristics influence a range of drought characteristics not limited to magnitude and frequency (Van Loon and Laaha 2015, Barker et al 2016, Parry et al 2016, Apurv and Cai 2020, Konapala and Mishra 2020, Ganguli et al 2022).
The existence of temporal hydrological drought clustering has considerable implications for hazard assessments, trend analyses, climate impact assessments, and risk analyses. Hazard estimates derived using a short record might not be representative in catchments with significant temporal drought clustering, as estimates derived on a drought-poor or drought-rich period can under- or overestimate drought risk, respectively. This issue highlights the importance of using a sufficiently long time series for drought frequency analysis. In addition, temporal drought clustering should be considered in trend analyses where drought-rich periods at the beginning or end of a time series might lead to the detection of artificial decreasing or increasing trends, respectively. This problem highlights the importance of choosing a sufficiently long time window for a trend analysis. Furthermore, temporal drought clustering needs to be considered in climate impact assessments, which is challenging because of various uncertainties introduced along different parts of the modeling chain. For example, it has been shown that global circulation models underestimate persistence in precipitation deficits (Kumar et al 2013, Ault et al 2014, Moon et al 2018). Such misestimation might become more pronounced when coupling climate models with hydrological models, i.e. when including storage processes that also need to accurately represent clustering behavior. While modeling the temporal clustering behavior of hydrological droughts might be challenging, it is also crucial to understand how temporal drought clustering might change in a warming world.
Our results suggest that temporal hydrological drought clustering might become more common with increasing temperatures as aridity increases and snow storage decreases (figure 3). For example, temporally clustered events may become more common in regions with increasing aridity such as central North America, central South America, southern Europe and southern Africa (Chai et al 2021). Furthermore, more catchments in snow-influenced regions such as the Alps and other mountain regions of the world, where currently only few catchments show temporal hydrological drought clustering (figure 2(b)), may become more affected by this phenomenon as snow cover decreases (Beaumet et al 2021, Matiu et al 2021). How exactly climate change affects temporal drought clustering needs to be assessed in targeted modeling experiments by e.g. using large ensembles of climate model output in combination with a hydrological model (Deser et al 2012). We might also improve our understanding of changes in drought clustering by identifying reasons/drivers for clustering at different time scales.
5. Conclusions
We tested for significant temporal hydrological drought clustering at subseasonal to multi-year time scales in different climate zones ranging from tropical regions in the Amazon, over snow-influenced regions in the Alps, to arid regions in Australia and the United States using two different clustering metrics, i.e. Ripley's K and the dispersion index. We find that temporal hydrological drought clustering is not very common, as only roughly 10% of the catchments show such clustering behavior. In catchments with temporal clustering, hydrological droughts cluster in time at seasonal, annual, and multi-year time scales and less at subseasonal and longer time scales. Temporal clustering is most common at annual time scales where roughly 10% of the catchments show such clustering behavior and at seasonal and 3-year time scales where roughly 5% show significant temporal clustering. Catchments most prone to significant temporal clustering are arid catchments and catchments with a low snow fraction, i.e. precipitation-driven catchments. Finally, we demonstrate that the temporal clustering of hydrological droughts is substantially more common than the clustering of meteorological droughts. That is, climatic drivers are insufficient to explain the temporal clustering of hydrological droughts, suggesting that additional land-surface processes are needed to explain this behavior. Such processes include snow storage or the absence thereof, seasonal and inter-annual groundwater level variations, temporal soil moisture variability, or fluctuations in glacier-melt contributions but not reservoir storage. We conclude that the risk of recurrent hydrological droughts is substantial in arid catchments without substantial snow storage, which should be considered in hazard, risk, and climate impact assessments.
Acknowledgment
The authors declare no competing interests. We thank the German Research Foundation for funding this project (Grant 2100371301). We also thank the two anonymous reviewers for their constructive comments, which helped to improve the presentation of the paper. The data on which this article is based are available in Alvarez-Garreton et al (2018), Dudley et al (2018), Coxon et al (2020), Fowler et al (2021), Klingler et al (2021), and Almagro et al (2021). The quasi-global dataset (i.e. streamflow, precipitation, evaporation, and catchment characteristics) compiled from these open-access data sources will be made available through HydroShare upon acceptance of this manuscript. Data archiving is underway on HydroShare and the data will be available upon acceptance of this manuscript.
Data availability statement
The data that support the findings of this study are openly available at the following URL/DOI: https://doi.org/10.4211/hs.31b56632213345db889a9eee981619f6.
Author contributions
M I B designed the study, performed all analyses, and wrote the first draft of the manuscript, which was revised and edited by K S.
Supplementary data (3.7 MB PDF)