

Abstract
Understanding forest area development as a function of socio-economic dynamics is of crucial importance for halting deforestation and shaping future options for action. Here, multivariable statistical models can be promising facilitators of knowledge generation. With the aim of enabling the further development of statistical analysis, this study describes the state of research for two prominent concepts used to analyze forest development in terms of socio-economic development: The forest transition hypothesis (FTH) and the environmental Kuznets curve for deforestation (EKCd). In order to learn from the wide variety of studies that differ in their model specification, region, variable selection, and statistical methods used, this study presents a systematic overview of the existing literature. This study is designed as an evidence and gap map (EGM)—a method of systematic literature research according to the RepOrting standards for systematic evidence synthesis process. A search for relevant literature was carried out in two data repositories. A thorough screening of the literature results yielded 46 articles with a total of 141 different model studies for evaluation. Our results reveal that (a) the evidence base for the EKCd is more comprehensive than for FTH, (b) the majority of eligible studies focus on the analysis of data from developing countries, and (b) a statistical analysis of the EKCd and FTH concepts does not provide a unified picture, but rather a variety of interpretations and specifications. Based on the results of this EGM, we can conclude that further investigations in the form of additional clustering and a deeper analysis of the different approaches used to interpret the two concepts is needed. Future studies should extend the study design by determining the relevant variables for future forest agenda setting and the policies that could be effective in halting deforestation by targeting certain baseline variables.
Export citation and abstract BibTeX RIS

Original content from this work may be used under the terms of the Creative Commons Attribution 4.0 license. Any further distribution of this work must maintain attribution to the author(s) and the title of the work, journal citation and DOI.
1. Introduction
In the interplay of climate change, biodiversity loss, increasing demand for wood, and changing economic patterns, forest area development has both a local and global interest. Despite decades of negotiations and international agreements, the world's forest area is still decreasing on an annual basis.
According to the UN's Food and Agriculture Organization (FAO) (2020), the net loss of forest area between 1990 and 2020 was highest in Africa and South America. Figure 1 shows that Europe and Asia experienced a net gain in forest area in the years 1990–2020 (FAO 2020).
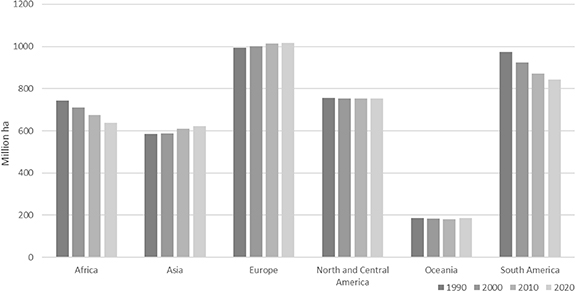
Figure 1. Forest area by region, 1990–2020. Adapted from Food and Agriculture Organization of the United Nations, 2020, Global Forest Resources Assessment 2020: Main report. Rome. Reproduced with permission.
Download figure:
Standard image High-resolution imageDuring the 26th UN Climate Change Conference of the Parties (COP26) in 2021, more than 150 countries agreed to halt and reverse deforestation by 2030 (COP26 2021).
To achieve this goal, and for shaping future options for action, understanding forest area development as a function of socio-economic dynamics is of crucial importance. In this context, multivariable statistical models can be promising contributors to knowledge generation. In their essence, statistical models relate a target variable, e.g. deforestation or forest area, to a set of independent variables that influences the development of this dependent variable. Statistical models explain these relations in measurable quantities and thus deliver insight into how the interplay of multiple drivers cause a specific development (Heinze et al 2018). Conversely, the assessment of statistical models that measure the influence of socio-economic factors on forest area development can help to shed light on their past successes and failures. To simplify the further development of statistical analysis as a decision support instrument, this study provides information about the state of research to date. In the course of the last decades, a growing number of research articles analyzed the influence of socio-economic and environmental variables, specifically two prominent concepts used to analyze forest development in the light of socio-economic development: the forest transition hypothesis (FTH) and the environmental Kuznets curve for deforestation (EKCd). Both of these have a long history of discussion and application in the research.
The Kuznets curve was first described in 1955 by Simon Kuznets, who found a relationship between inequality and income (Kuznets 1955). In early 1990, the Kuznets curve was modified to investigate the effect of economic growth on environmental degradation. Grossman and Krueger (1991) were the first authors to study the environmental impact of the North America Free Trade Agreement by applying the concept of the Kuznets curve and found an inverted U-shaped relationship between environmental degradation and economic growth. The name and concept of the environmental Kuznets curve (EKC) was born. The basic principle of the EKC is that as economic growth increases, environmental degradation initially increases until a turning point is reached. After passing this turning point, the state of the environment starts to improve together with further increasing economic growth. Since 1990, many authors have applied the concept of the EKC to various environmental aspects with varying results (Caravaggio 2020b). In particular, after 2000, the number of articles examining the EKC increased significantly (Choumert et al 2013). In forestry science, the concept has been adapted to analyze deforestation. The EKCd is mostly used to describe the rate of deforestation. In line with the basic principle of the EKC, the rate of deforestation is expected to increase with increasing income until a turning point is reached, after which the rate of deforestation will begin to decrease (figure 2(a)) (Shafik and Bandyopadhyay 1992, Panayotou 1993, Stokey 1998, Stern 2004).

Figure 2. (a) EKCd; (b) FTH.Classical schemes of EKC and FTH goes back to Panayotou (1993) and Mather (1992) and is displayed on the theoretical assumptions of those publications.
Download figure:
Standard image High-resolution imageChoumert et al (2013) conducted a meta-analysis based on 69 scientific articles to examine whether the EKCd exists and which factors influence its shape. Their results show that the older studies whose results would support the assumption of an EKCd are outweighed by recent studies that do not support an assumption of EKCd. In addition, they conclude that the inclusion of trade variables in the curves' regression reduces the probability of finding an EKCd. They also found that no uniform EKCd model could be applied equally to separately assess developed and developing countries, i.e. no single assumption can be made that applies to all countries and at the same time to a part. Choumert et al (2013) further investigated the influence of control variables and found a strong positive relationship between inequality and confirmed the probability of the occurrence of any curve shape of the EKCd. This finding confirms the work of Koop and Tole (2001), who used the Gini coefficient for income to represent inequality and found a relationship between high inequality and the effect on economic development. This study supplements the study selection on EKCd conducted by Choumert et al (2013) until 2012 with studies until 2020. Since EKCd considers only the deforestation phase, we additionally examine FTH, which goes beyond this (see also Caravaggio (2020b)).
The FTH (see figure 2(b)) was first described by Alexander Mather in 1992. According to Mather, a combination of many factors influences forest development. In general, the forest area of a country decreases with increasing social and economic development until a turning point is reached and there is a transition from net forest losses to net forest increases. In 1998, Mather and Needle found that forests adapt to society's needs. If an economy starts to grow, forest area initially decreases due to the conversion of land for agricultural purposes. With further economic development, technological progress and increasing productivity lead to the abandonment of less productive areas. This then frees up areas for the forest to regrow. Rudel et al (2005) identified two drivers for forest transition: economic development and forest scarcity. In line with Mather and Needle (1998), Rudel et al argue that economic development fosters urbanization and agricultural decline and thus allows for forest regrowth. Forest scarcity causes timber prices to rise, which then allows for investments in forest planting and management. The latter process may be reinforced by policies to halt forest exploitation. In 2010, Lambin and Meyfroidt added globalization, state forest policy, and smallholder land use involving tree planting as possible drivers for forest transition (Lambin and Meyfroidt 2010). Thus, forest transition is not caused by a single key factor but driven by the interplay of several structural trends, including socio-economic, technological, and political trends, as well as stakeholder needs and ecological perceptions, where the set of drivers varies across geographical regions and societal backgrounds (Meyfroidt and Lambin 2011).
In 1999, Mather et al established a link between the concepts of EKC and FTH (Mather et al 1999). Culas (2012) presented an empirical evaluation of EKCd with help of the FTH, and Caravaggio (2020b) further confirmed a relationship between FTH and EKCd. Both curves demonstrate different parts of a conceptually comparable development. While the EKCd describes forest development with increasing and decreasing rates of deforestation, which is similar to the first declining part of the EKC curve, the FTH also describes the change from decreasing to increasing forest cover. But since the deforestation rate of the EKCd can become negative, a direct link to the FTH curve becomes possible (Caravaggio 2020b). However, the curve shape of the FTH is only schematically specified by existing theoretical assumptions. Even though, hypothetically, the curves share similar characteristics, the approaches usually vary in terms of study design, selection of variables, and influencing factors (see figure 2).
In search of the best applicable estimation method to explain forest development with respect to socio-economic factors, diverse approaches for modeling the EKCd or FTH have been applied in the existing literature. However, major differences exist in the estimation methods themselves, the estimated curve shapes, the independent variables tested, as well as the underlying data in terms of periods and countries considered. In order to support future forest-related decision-making and policies with proper analytical tools, it is important to provide clear statements and evidence on the quality of the existing concepts. Therefore, the objective of this paper is to review the scientific literature on the use of EKCd and FTH in empirical estimates of cross-country studies and to systematically map the evidence base, including empirical model specifications, estimation methods, and data applications. We did not include articles that predict the probability of a turning point occurring, but rather we reviewed articles that estimate coefficients for drivers of forest area development.
In particular, we used a systematic evidence and gap map (EGM) method to address the following questions:
What is the evidence base of the empirical estimation of forest development relying on EKCd and FTH?
- (a)What is the geographical and temporal coverage of the empirical estimations used?
- (b)How were the empirical estimates of the forest development concepts specified? Are there differences in the choice of dependent and independent variables, the shape of the curve, and the estimation method?
For this purpose, we developed an EGM to systematically map the state of the art in this field of research and to identify possible research gaps (White et al 2020). Our map clarifies key definitions in the literature and examines how empirical estimations of EKCd- and FTH-based forest development were conducted. The EGM method applied builds on a systematic literature search and study selection and is not a full systematic literature review or meta-analysis. The results consolidate the current research and contextualize it within further research opportunities. An EGM provides a first step for considering further research and discusses the results in the direction of necessary follow-up work. We applied a systematic map to show the evidence base in terms of, e.g. geographical and temporal coverage, dependent and independent variables, and estimation methods. In addition to discussing the results, we describe limitations of the method and provide a short outlook for policy implication.
2. Methods
The study design of this paper is a systematic EGM. The study was conducted according to the principle processes of a systematic map as defined by RepOrting standards for Systematic Evidence Synthesis (ROSES) (Haddaway et al 2017). The ROSES process requires a research question to be defined and then tested and analyzed based on a distinct research protocol. According to this, the research process goes through different phases including a systematic search for articles, study selection and analysis, and the presentation of extracted data (Shamseer et al 2015). Within the diverse field of literature analysis, the EGM must be distinguished from, e.g. a systematic review, a meta-analysis (as conducted, e.g. by Choumert et al (2013)), or a (non-systematic) literature review (as conducted, e.g. by Caravaggio (2020b)). The EGM is a strong tool for gaining a comprehensive overview of the targeted field of research. In this context, an EGM could serve as a preliminary step in determining whether a systematic review or a meta-analysis should be carried out on a given topic. There are important methodological differences between, e.g. a systematic review and an EGM. For example, the compilation of an EGM does not require any evidence synthesis to be conducted. Further, the main objective of an EGM is to provide a comprehensive overview in order to identify further research needs, whereas a systematic review analyzes a specific section of the subject area in more depth (Saran and White 2018, BioMed Central 2022).
In this study, we used the ROSES checklist for systematic research maps and adapted it to our topic. First, the research protocol for this systematic map was iteratively drafted, scoped, and discussed before beginning the systematic literature search. We took relevant literature into account to develop an appropriate search framework, refine the search strategy, and compile a search string. In particular, this literature included papers that cover other reviews on EKCd and FTH. Based on this, we compiled a benchmark list of key articles in our field of research: Caravaggio (2020a), Caravaggio (2020b), Choumert et al (2013), Culas (2012), (Leblois et al 2017). From these papers, we extracted key information on different terms used for the concepts being considered (EKCd and FTH). Through iterative testing, the search frame and the strategy were refined until the final search string found all relevant articles specified in the benchmark list. Driven by the goal to focus on empirical rather than theoretical studies, we also tested more specific and restricted search strings. These strings, however, omitted relevant studies from our benchmark list 3 . Therefore, we agreed to apply a broader literature search and manually extract relevant articles during the screening process.
2.1. Search for articles
Web of Science and Scopus were the bibliographic databases used in the literature search for this review. By selecting these two databases, we could cover almost all the relevant journals in the forestry sector. The systematic article search was limited exclusively to peer-reviewed articles in English. Search terms were limited to those in English due to project resource restrictions and time constraints. The search in these two databases was conducted in November 2020. The search strings used in each database are shown in table 1.
Table 1. Search strings for the databases 4 .
| Scopus: | TITLE-ABS-KEY (*forest* OR degradation OR forest* OR tree* OR wood* OR 'landuse* change*' OR 'land-use* change*' OR 'landuse* cover*' OR 'land-use*cover*') AND TITLE-ABS-KEY ('Kuznet* curve*' OR 'landscape* turnaround*' OR 'forest* transition*') |
| Web of science: | TS = (forest* OR degradation OR *forest* OR tree* OR wood* OR 'landuse* change*' OR 'land-use* change*' OR 'landuse* cover*' OR 'land-use* cover*') AND TS = ('Kuznet* curve*' OR 'landscape* turnaround*' OR 'forest* transition*') |
Using the advanced search function in the databases, we defined two main groups that are connected with 'AND.' These main groups consist of keywords related to forest-related terms and to the FTH or Kuznets curve. We searched for these terms in Web of Science in the titles, keywords, keywords plus®, and abstracts. In Scopus, our search string was applied to the title, abstract, and keywords.
2.2. Screening process and inclusion criteria
Articles eligible for analysis were identified using criteria that specify their suitability for inclusion. These inclusion criteria relate to the nature and content of the studies. We only considered peer-reviewed, English-language articles published between 1955 (emergence of the EKC theory) and 2020. Since we searched for internationally resilient and valid results, we only included cross-country studies with a continental or global scope (at least two countries had to have been included). Conversely, we excluded single-country studies. In terms of content and to answer our research questions, only studies that provided numerical estimates of forest development curves were included, while theoretical assumptions were excluded (see table 2).
Table 2. Inclusion and exclusion criteria.
| Include | Exclude |
|---|---|
| Study type | |
| Peer-reviewed article | Non-peer-reviewed article (e.g. working paper) |
| English | All other languages |
| Studies published after 1955 until November 2020 | Studies before 1955 and after November 2020 |
| Content | |
| Articles that examine more than one country (global, continental). | Articles that examine only one country or region (regional, local, national). |
| Studies that estimate numerical FTH or EKCd | Studies that do not include estimations and forest development theories. Likelihood estimates. Studies that do not provide estimated coefficients. Theoretical evaluations. |
After completing the literature research, the articles were stored in Citavi and duplicates removed. Each article was given an individual and unique number to be able to assign them exactly. The screening for eligibility of the studies was conducted in two stages according to the method established by ROSES. During the first stage, the titles, keywords, and abstracts of selected articles were screened. Based on the results of the first screening, full texts were screened in the second stage. Two authors performed the first screening of the articles, which were distributed randomly. To calibrate the convergence of the first screening, the authors processed ten percent of the articles in the first screening separately and compared the results afterwards. The collectively screened articles served as an exercise. Subsequent discussions were held until a unanimous opinion on the inclusion or exclusion of articles was reached. As the screening process continued, the authors held regular meetings to review consistency and clarify, for example, ambiguities in exclusion criteria, such as the delineation of regions or comprehensive synonyms for the emerging terms. The entire first screening process was completed in two months.
All articles that met the inclusion criteria after the first screening were transferred to the second screening level with a corresponding unique ID number. Articles that could not be unambiguously excluded after the first screening were also transferred to the second screening to check them again in full text.
The second screening process (full-text screening) followed the same procedure as the first screening process. Ten percent of the articles were screened in parallel by multiple authors to detect and eliminate different understandings on evaluating the eligibility of the articles. Afterward, the remaining articles were divided randomly between the authors. The inclusion results of the first screening were double-checked with the results of the second stage to eliminate inconsistencies between the first and second screenings. During the screening process, information on inclusion criteria was recorded.
2.3. Study design
The articles identified as relevant and eligible according to the inclusion criteria during the second screening often contained and analyzed more than one econometric model (in terms of, e.g. the estimation method used, the list of individual variables included, etc) for the estimation of the EKCd or FTH. These different estimation models are termed 'studies' in this article. In this context, the term 'model' refers to the estimation method used. The same model might be applied in an article in several studies, which differ, for instance, between the countries considered. From all included articles, the different studies estimating EKCd or FTH were identified, reviewed, and data was extracted. To avoid multiplicity of results, a study selection was performed. Multiplicity of results occurs in this case, when the same set of data is analyzed multiple times using different estimation methods or with overlapping sets of variables, time periods, or countries included (López-López et al 2018). López-López et al propose a framework for dealing with articles that report multiple effect sizes. In this case, the selection of a study for further analysis from a set of studies presented in an article is based on several criteria and involves a decision rule. We determined this rule of study selection before beginning the search. Here, we utilized the reductive approach of López-López et al for all effect sizes, e.g. time periods, regions, and dependent variables. If the same model setup was applied to analyze different regional areas (different sets of countries), all studies meeting the inclusion criteria were included, since in this case there is no multiplicity. If an article uses the same set of variables for short- and long-run models, we chose the long-run studies unless the authors stated that the short-run study delivered better results. If the studies only differed in their estimation methods or the set of variables tested, multiplicity might occur (López-López et al 2018). The main criteria used for study selection were (a) the significance and information of a model and, subsequently, (b) applied background knowledge. In other words, if the authors of an article stated the level of significance or information content of their different studies, we chose the study that the authors described as the best in terms of significance, consistency, and fit. If no statistical criteria were provided by the authors of a respective study on the most preferable models, we used background knowledge to guide model selection. In this sense, and according to the objective of obtaining the most comprehensive compilation of relevant dependent or independent variables for the estimation of EKCd and FTH, we chose the basic study (assuming it was not rejected by the author team of the article) and, in addition, the study that included the largest range of variables of a respective article. Here, we used the integrative approach (López-López et al 2018). For further analyses of the results (e.g. meta-analyses), a further reduction of effect sizes not only within but also between articles might be needed. According to our study selection, all results are displayed per article (n = 46), i.e. each article is only counted once. Only figure 10 displays the estimation methods used per study (n = 141). In cases of ambiguity, we relied on joint, unanimous team decision-making. Since all eligible articles were peer-reviewed and thus adequately fulfill scientific standards, an individual review of the quality of the articles was not conducted.
2.4. Study coding strategy
For data extraction and data coding, templates were developed in Microsoft Excel to systematically record study metadata, analysis outcomes, and contextual information. Data extraction and coding were conducted during both screening stages, but in different templates. Each time, the screening templates were tested and piloted for ten percent of the articles, subsequently discussed, and adopted until a uniform template structure was created to ensure consistent data gathering and entries between the four reviewers. For articles written by members of the reviewer team, we ensured that the respective authors did not screen or code their own work.
The main categories for data extraction and coding included article ID, reviewer, and bibliographic information, and in the first screening, the type of evidence, the regions and periods studied, the forest development theories considered, and the estimation method.
In the second screening stage, the results of the first screening stage were reviewed and adjusted if necessary. In addition, data were extracted on the dependent and independent variables applied in the studies, the assumed curve shapes, the statistical estimation method, and the indication of estimation coefficients. Whether the estimates were applied to a specific forest type was also examined.
3. Main results
3.1. Evidence base of the estimation of forest development
The systematic literature search yielded 1317 articles from Scopus, 1167 articles from Web of Science (a total of 2484 articles), and nine supplementing articles from the bibliographies of screened articles. After removing duplicates, we screened the title, keywords, and abstracts of 1633 articles. A total of 1552 articles were excluded after the first screening as these did not meet the respective inclusion criteria. Some articles did not match several inclusion criteria. Five articles did not fulfill the peer-review requirement, two articles were not written in English, and 780 articles did not deal with forests, wood, or trees. A total of 874 articles did not meet our inclusion criteria in terms of regions to be studied, i.e. they studied national, sub-national, or local areas. The estimation condition was not met by 257 articles, and 654 articles did not refer to the concepts of EKCd or FTH. In total, 73 articles could not be clearly identified as either eligible or ineligible during the first screening stage. Their inclusion or exclusion was subsequently decided based on a joint discussion by the author team. Ultimately, 25% of the articles in question were included. After the exclusion of non-relevant articles, 82 articles remained, which were moved to the full-text screening stage. During the second screening process, 36 articles had to be excluded due to missing numerical estimation models, missing output of coefficients, likelihood estimations of forest transition in the FTH, or lack of consideration of a forest-related dependent variable. After the second screening, 46 articles fulfilling all the inclusion criteria remained. The following evaluations of the results and the charts refer to these 46 articles. From these 46 articles, 141 studies were selected as relevant for the analysis of this EGM. Figure 3 shows an adapted flow diagram of ROSES highlighting our results.
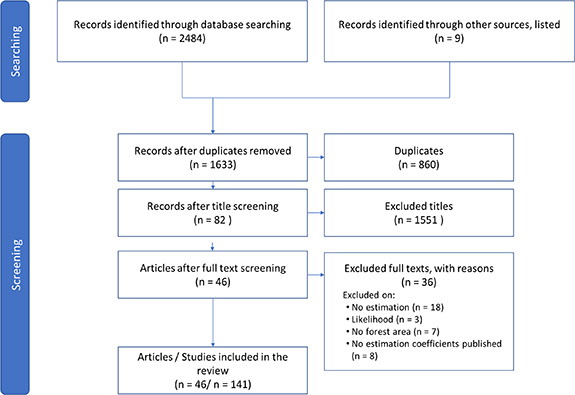
Figure 3. Flow chart of study selection (template: ROSES flow chart for evidence and gap map, RepOrting standards for Systematic Evidence Syntheses Reproduced from Haddaway et al (2017). CC BY 4.0.
Download figure:
Standard image High-resolution imageThe 46 articles included in the analysis were published in 32 different journals. Most of the articles were published in the Ecological Economics, Forest Policy and Economics, and the Journal of Development Economics journals. Table 3 in the
Table 3. Articles and key factors included in the evidence and gap analysis (abs. = absolute, ha = hectare, a = year, pC = per capita, * for abbreviations of estimation methods see table 4).
| Authors | Year of publication (n = 46) | Forest development concept (n = 46) | Categorization of countries (n = 46) | Data sourNumber of countries (n = 141) | Data sourTime period (n = 141) | Dependent variable (n = 141) | Number of studies included in this article (n = 141) | Estimation method (n = 141)* | Support for development concept? (n = 141) | Detected curve shape (n = 141) |
|---|---|---|---|---|---|---|---|---|---|---|
| Aguilar and Song | 2018 | EKC | Global | 158 | 1992–2013 | Forest cover (%) | 1 | GLMM | No | Linear |
| Andrée et al | 2019 | EKC | Global | 95 | 1999–2014 | Rate of deforestation per GDP per Capita (%/GPD pC) | 1 | KRLS | Yes | Inverted U-shape |
| Arcand et al | 2008 | EKC | Global | 101 | 1961–1988 | Rate of deforestation | 2 | GMM, OLS | No | No inverted U—shape |
| Assa | 2021 | EKC | Tropical and developing | 85 | 1990–2010 | Annual rate of forest changes per capita (%/a pC) | 3 | OLS | No | U-shape |
| Barbier and Burgess | 2001 | EKC | Tropical | Not stated | 1961–1994 | Agricultural area change rate (%/a) | Two models specified for four different regions | RE, FE, OLS | Mixed | Without institutional factors: inverted U-shape for Asia. With institutional factors: inverted U-shape for global and Latin America |
| Bhattarai and Hammig | 2004 | EKC | Tropical | 63 | 1980–1995 | Rate of deforestation (%/a) | 3 | FE, GLS | Yes | Inverted U-Shape (GDP2) and cubic regression (polynomial withGDP3) |
| Bhattarai and Hamming | 2001 | EKC | Tropical | 66 | 1972–1991 | Rate of deforestation (natural forests) (%/a) | 3 | FE, FGLS | Mixed | Inverted U-Shape (for Africa and Latin America), no curve shape (for Asia) |
| Buitenzorgy and P J Mol | 2011 | EKC | Global | 177 | 1990–2000 | Rate of deforestation (%/a) | 1 | OLS | Yes | Inverted U-Shape |
| Caravaggio | 2020a | EKC | Global | 114 | 55 years (after 1960) | Rate of deforestation (%/a) | Three different models for three different income groups | FE, ADF, PMG | Mixed | Inverted U-Shape and U-Shape for different income country classes |
| Chiu | 2012 | EKC | Developing | 52 | 1972–2003 | Arable land area (abs.) (ha) | 5 | FE | Yes | Inverted U-shape |
| Combes et al | 2015 | EKC | Developing | 79 | 1990–2010 | Rate of deforestation (%/a) | 2 | GMM | Yes | NA |
| Crespo Cuaresma et al | 2017 | EKC | Global | 189 | 2005 | Forest cover, cross border deforestation index (CBDI) (%) | 2 | OLS | Mixed | U-Shape |
| Cropper and Griffiths | 1994 | EKC | Non-OECD | 64 | 1961–1991 | Rate of deforestation (%/a) | 3 | FE | Yes | Inverted U-Shape (Africa and Latin America, no: Asia) |
| Culas | 2007 | EKC | Tropical and developing | 14 | 1971–1994 | Rate of deforestation (%/a) | 2 | OLS | Mixed | Inverted U-Shape (Latin America) and U-Shape (Africa and Asia) |
| Culas | 2012 | EKC | Tropical | 14 | 1972–1994 | Rate of deforestation (%/a) | 3 | FE, RE | Mixed | Inverted U-Shape (Latin America) and U-Shape (Africa and Asia) |
| Damette and Delacote | 2012 | EKC | Developing | 59 | 1972–1994 | Rate of deforestation (%/a) | 2 | FE | Mixed | Inverted U-shape |
| Damette and Delacote | 2011 | Both | Developing | 59 | 1972–1994 | Rate of deforestation (%/a) | 5 | FE | Yes | Inverted U-shape |
| Ehrhardt-Martinez et al | 2002 | EKC | Global | 74 | 1980–1995 | Rate of deforestation (%/a) | 3 | OLS | Mixed | Inverted U-shape |
| Halkos and Skouloudis | 2020 | EKC | Primary forest | 22 | 1995–2016 | Annual rate of forest change (%/a) | 1 | GMM | Mixed | Inverted U-shape, inverted N-shape |
| Imai et al | 2018 | Both | Asian | 8 | 1980–2010 | Annual rate of forest change (%/a) | 2 | NA | Yes | Linear, with U-shape, found for social openess2 |
| Joshi and Beck | 2016 | EKC | Global | Not stated | 1990–2017 | Forest cover (%) | 4 | GMM | Mixed | N-shape for OECD-countries, U-shape for Asia |
| Kahuthu | 2006 | EKC | Global | 84 | 1960–2000 | Forest cover (%) | 1 | FE | No | No curve shape mentioned |
| Koop and Tole | 1999 | EKC | Developing | 76 | 1961–1992 | Rate of deforestation (%/a) | Two model specifications for four different regions | FE, RE | Mixed | Inverted U-shape (only Latin America is statistically significant) |
| Koop and Tole | 2001 | EKC | Developing | 48 | 1961–1992 | Rate of deforestation (%/a) | 3 | FE | No | NA |
| Köthke et al | 2013 | FTH | Global | 111, 126 (for different models) | 1990–2010 (for developing countries) | Forest cover (%) | 4 | OLS | Yes | Sigmoid |
| Leblois et al | 2017 | Both | Developing | 128 | 2001–2010 | Rate of deforestation (%/a) | Six models for EKC and five for FTH for different phases of forest transition | FE, OLS, GMM | Mixed | Mixed shapes |
| Li et al | 2017 | Both | Developing | 76 | 1990–2010 | Annual rate of forest change (%/a) | 3 | FGLS | Yes | U-shape for EKC |
| Liu et al | 2017 | Both | Asian | 9 | 1960–2010 | Annual deforestation area (abs.) (ha/a) | 8 | OLS | Mixed | Inverted U-shape (Indonesia and South Korea), U-shape |
| Lokonon and Mounirou | 2019 | EKC | SSA | 35 | 1991–2015 | Rate of deforestation (%/a) | 1 | DOLS | No | No curve shape mentioned (expected signs show inverted U-shape for GDP and GDP2- not statistically significant) |
| Managi | 2006 | EKC | Global | 115 | 1960–1999 | Forest cover (%) | 1 | GMM | No | NA |
| Meyer et al | 2003 | EKC | Global | 117 | 1990–2000 | Rate of deforestation (%/a) | 4 | OLS | No | U-shape |
| Motel et al | 2009 | EKC | Tropical | 48 | 1970–2005 | Rate of deforestation (%/a) | 1 | PLS | Yes | Inverted curve shape (expected sign for EKCd) |
| Murtazashvili et al | 2019 | EKC | Global | Not stated | 1990–2015 | Annual rate of forest change (%/a) | 2 | OLS | NA | Linear for 'trust', NA for another model |
| Nepal et al | 2019 | EKC | Global | 168 | 1990–2015 | Forest area (abs.) (ha) | 1 | FE | Yes | U-shape |
| Nguyen Van and Azomahou | 2007 | EKC | Developing | 59 | 1972–1994 | Rate of deforestation (%/a) | 1 | FE | No | Inverted U-shape for GDP and GDP2 (not statistically significant) |
| Ogundari et al | 2017 | EKC | SSA | 43 | 1990–2009 | Environmental change vector of rate of deforestation (%/a) | 1 | FGLS | no | U-shape |
| Panayotou | 1993 | EKC | Global | Not stated | 1980–1985 | Rate of deforestation (%/a) | 1 | OLS | Yes | Inverted U-shape |
| Paradis | 2021 | FTH | Asian | 11 | 1992–2018 | Forest cover, and annual rate of forest change (%, and %/a) | 1 | GLS | Mixed | Linear, no shape |
| Rudel | 1998 | FTH | Global | 138 | 1963–1980, 1980–1990 | Forest cover change (%) | 2 | OLS | Mixed | Linear, no shape |
| Rudel | 2009 | FTH | Global | Not stated | 1990–2005 | Forest plantation area (abs.) and forest plantation area change (abs.) (ha) | 2 | OLS | Mixed | Linear, no shape |
| Rudel | 2013 | FTH | SSA | Not stated | 2000–2005 | Rate of deforestation (%/a) | 2 | OLS/NA | No | Linear, no shape |
| Salahodjaev and Jarilkapova | 2020 | EKC | Global | 176 | 1990–2015 | Forest area per capita (abs.) (ha/pC) | 1 | NA | Yes | U-shape |
| Scrieciu | 2007 | EKC | Tropical | 50 | 1980–1997 | Arable land area (abs.) (ha) | 1 | FE | No | NA |
| Turner et al | 2006 | EKC | Unspecified | 58 | 1980, 1990, 2000, 1999–2030 | Rate of deforestation (%/a) | 1 | OLS | Yes | Inverted U-shape |
| Wolfersberger et al | 2015 | Both | Developing | 57 | 1990, 2000, 2005, 2010 | Forest cover, agricultural land cover, other land use cover (%) | 1 | System GMM | NA | NA |
| Zambrano-Monserrate et al | 2018 | EKC | Continental EU | 5 | 1974–2013 | Arable land area per capita (abs.) (ha/pC) | 5 | ARDL | Mixed | Inverted U-shape (support for France, Germany, Portugal, and Turkey), U-shape, no support for Greece |
a Support for EKCd: either inverted U-shape estimated for deforestation, U-shape for other forest-related variables or author states support for the concept; support for FTH: author states support the concept or sigmoid curve shape. b Different models with (OLS) and without institutional factors (RE, FE) for Africa, Latin America, Asia and global. c The article by Paradis (2021) and Assa (2021) were already accepted in 2020 and published online in 2020, printed in the journal, the articles appeared only 2021. For this reason, we decide that these articles meet our inclusion criteria.
Table 4. Overview of the used estimation methods and their abbreviations.
| Acronym | Description |
|---|---|
| ADF | Asymptotically distribution-free |
| ARDL | Autoregressive distributed lag |
| DOLS | Dynamic ordinary least squares estimator |
| FE | Fixed effects estimator |
| FGLS | Feasible generalized least squares |
| GLMM | Generalized linear mixed model estimation |
| GLS | Generalized least squares |
| GMM | Generalized method of moments |
| KRLS | Kernel regularized least squares estimator |
| NA | Not applicable (No estimation methods specified) |
| OLS | Ordinary least squares |
| PLS | Panel least squares |
| PMG | Pooled mean group estimation |
| RE | Random effects |
| System GMM | System generalized method of moments |
3.1.1. Extent of publications on different forest development concepts and appearance over time
We found that the majority of articles (76%, n = 35 articles with 90 relevant studies) estimated EKCd, five articles (with 20 relevant studies) estimated FTH, and six articles (with 30 relevant studies) estimated both concepts of forest development (see figure 4(a)).

Figure 4. (a) Distribution of publications addressing the different forest development concepts; (b) number of articles on numerical estimations of FTH and EKC published per year (n = 46 articles).
Download figure:
Standard image High-resolution imageFigure 4(b). shows the number of relevant publications per year. An increasing, yet not constant, trend can be seen in figure 4(b) Most of the articles were published between 2017 and 2020 with a peak in 2017. The joint consideration of both concepts in one paper was only applied from 2011 onwards. Remarkably, in 2017, 50% of the published articles were on EKCd and 50% of the articles examined both forest development theories together.
3.2. Data sets applied for estimating the concepts
3.2.1. Temporal coverage
The period length per article is the number of years on which the analyses are based (see figure 5). Taking all estimation approaches together, the articles use a period length of 24.7 yr on average. The individual analysis revealed that the applied period lengths of the various concepts are, on average, close to each other (EKCd: 24.6 yr, FTH: 24.8 yr, both: 25.2 yr). No trend over time is apparent.

Figure 5. Scatter plot of frequency distribution for period lengths per article (n = 46).
Download figure:
Standard image High-resolution image3.2.2. Geographical coverage
The regions specified by the authors of the selected articles (e.g. global, developing, or tropical cross-country selection) can be assigned to nine country groups (see figure 6(a)). Global data sets are used most often, followed by articles that refer only to developing countries and tropical countries. Few articles select countries from sub-Saharan Africa (SSA) or Asia. In addition, few articles considered either tropical and developing countries together or countries that form an intersection of these groups. In individual cases, articles consider countries that have primary forests, non-OECD countries, and countries located in continental Europe (see figure 6(a)). The world map shown in figure 6(b) illustrates the frequency distribution of the estimated countries. Here, all individual countries considered in the articles are plotted and shaded by their frequency (global estimations are excluded from the presentation as well as six articles without an exact country description). The countries most commonly studied are Bolivia, Brazil, Colombia, Ecuador, India, Ivory Coast, Kenya, Malawi, Malaysia, Nigeria, Peru, Philippines, and Thailand. We also distinguished the country clusters by development concepts and found that FTH articles most often examined global and Asian datasets, EKCd mostly examined global, developing, or tropical countries, and the articles that used both development concepts predominantly looked at developing country datasets. All articles except Turner et al use regional categories to describe their database. However, there are no uniform definitions for the regional categories to which authors assigned their data sets. Further, the regional categories often overlap. In addition, the authors who assigned their database to the global group sometimes examined less than 100 countries. For example, Andrée et al (2019) examine 95 countries, Ehrhardt-Martinez et al (2002) examined 74 countries, and Kahuthu (2006) examined 84 countries.
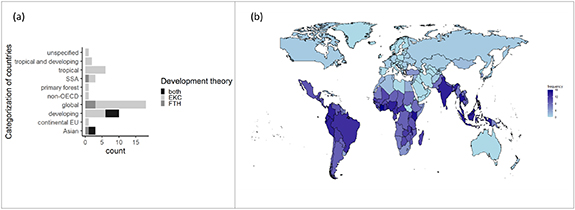
Figure 6. (a). Overview of categorization of the countries evaluated according to development concept (n = 46); (b). World map showing the frequency distribution of countries considered in the selected articles (n = 21) (articles not specifying the regions considered as well as global datasets are omitted).
Download figure:
Standard image High-resolution image3.3. Specification of the concepts
3.3.1. Dependent variable
In addition to the variety of dependent variables used in the articles, the terms are also defined differently. The rate of deforestation is described, e.g. as a change in natural forest area (Bhattarai and Hammig 2004) and as a multiplier between forest cover and deforestation ratios (Leblois et al
2017). Since the definition of forest area is wide-ranging and there is no unified underlying agreement for this, we rely on the definitions in the individual articles. We have assigned comparable variables to six forest-related (figure 7) and two agriculture-related groups. For example, the differences in data set, logarithms, time lag, and forest types remain in the application of the variables. For better clarity of the dependent variables, we assign the variables listed in table 3 in the
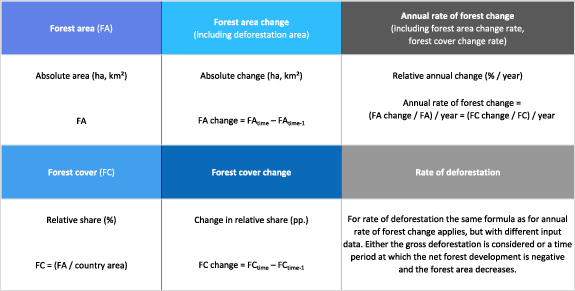
Figure 7. Definition of different dependent variables of the articles (n = 46) differentiated by forest area and forest cover. 'Arable land' and 'agricultural area change' are not provided here (pp. = percentage points).
Download figure:
Standard image High-resolution image
Figure 8. (a) Distribution of dependent variables applied in articles estimating EKCd; (b) distribution of dependent variables applied in articles estimating FTH; (c) distribution of dependent variables applied in articles estimating both concepts.
Download figure:
Standard image High-resolution imageThe results of table 3 in the
The dependent variable 'rate of deforestation' was applied 21 times for estimating EKCd, zero times for FTH, and two times for both (see figure 8). Thus, EKCd articles are dominated by the estimation of 'rate of deforestation.' FTH articles (n = 5) distinguish four different variables, with 'forest cover' being estimated in two articles as well as 'forest area' (see figure 8(b)). Four dependent variables are examined in the articles that consider both concepts of forest development. The most frequent specification for articles that estimate both concepts is the 'rate of deforestation,' which refers only to decreasing forest development and the 'annual rate of forest change,' which considers net forest development (each n = 2) (see figure 8(c)).
3.3.2. Independent variables
All selected articles apply sets of independent variables in their estimation models. Even though some independent variables are similar across the different articles, they are specified in slightly different ways. Therefore, we assigned them to 11 thematic classes (see figure 9). The independent variables most frequently examined are economic income variables (applied in 41 articles). The demographic variables contain variables such as gross domestic products (GDP) growth rate, GDP, GDP2, and GDP per capita. Demographic variables were applied in the articles just as often; these include population density, rural population as a percentage of total population, and population size. Half of the articles use governmental or other institutional variables (e.g. level of democracy, political rights, and political stability) as well as forest-related (e.g. timber price and labor in forest areas), agriculture-related (e.g. agricultural expansion and cereal yield), and trade-related (e.g. trade openness and export price index) variables in their models (see figure 9). All independent variables tested are shown in figure 9, regardless of whether they were significant or not.

Figure 9. Grouped distribution of independent variables (n = 46).
Download figure:
Standard image High-resolution image3.3.3. Curve shapes
For every article, the curve shapes examined are specified in table 3 in the
3.3.4. Statistical estimation methods
Overall, 14 different estimation methods occurred across all articles (see table 3). Eight articles used different estimation methods for the different studies included in their analysis. The fixed effects (FE) and ordinary least square (OLS) estimators appeared most frequently (17 times) (see figure 10). In the publications before 2015, 75.8% of the studies used FE and OLS estimates. In the more recent articles from 2015 onwards, the methods became more diverse, and the application of OLS and FE estimation methods decreased to 35.3% of the articles. Seven new estimation methods were added in recent years.

Figure 10. The estimation methods used by the selected n = 141 articles over time (some articles apply multiple methods) (for abbreviations, see table 3).
Download figure:
Standard image High-resolution image
4. Discussion of the main results
In order to foster forest-related decision-making, it is important to present well-grounded evidence on the goodness of fit of existing concepts to explain forest development. Thus, the purpose of the present study is to systematically map the state of the art in this field of research. The applied method (EGM) builds on a systematic literature search and study selection. This map shows the existing reviewed literature related to the research topic and examines how research on forest development is conducted using the concepts of EKCd and FTH.
4.1. Evidence base
The first research question addressed in this EGM targets the evidence base of empirical estimations of forest area development based on EKCd and FTH. By carefully screening the relevant literature since 1955, this article finds that empirical estimations of EKCd were performed more frequently (n = 35 articles), while empirical estimations of the FTH and of both EKCd and FTH were published infrequently (nFTH = 5, nboth = 6). The joint consideration of both concepts in one publication only began in 2011 and has been examined regularly since then. This aligns with discussions on the similarities and synergies of the two concepts as mentioned, e.g. by Caravaggio (2020b). Investigations on these two forest development concepts have increased in recent years, demonstrating the actuality and ongoing debate relating to these concepts.
4.2. Geographical and temporal coverage of the datasets used for the empirical estimates of the concepts
The second research question analyzed in the EGM considers the geographical and temporal coverage of articles on the estimation of EKCd and FTH. We observed similarities regarding the regional distribution of the areas studied and the period lengths used for analysis in the different studies. No difference in data usage period lengths could be detected between the two concepts. This is surprising, since the concepts focus on different parts of forest development. Whereas EKCd articles require the analyses to be limited to periods of deforestation, the FTH concept is based on analyzing the entire forest development, even beyond deforestation. The period length is partly determined by the underlying, globally available data sets. But no increase in period length is observed in more recent publication years, although data availability would have allowed this.
The articles considered analyze different groups of countries, where almost all parts of the world were covered. However, certain regions (especially tropical developing countries) were repeatedly studied. Rather than covering a complete region, most articles focused on a subset of countries within one region only (which is mostly located in developing countries). Nevertheless, 35.5% of the articles reviewed referred to global datasets. This is interesting, as only global datasets can avoid a country selection bias. However, although global studies do not necessarily contain all countries of the world, they at least combine a subset of developing and developed country data. For these mixed samples, it might be even more difficult to detect an inverted U-shape for regressions due to greater heterogeneity (as pointed out by, e.g. Choumert et al (2013).
In this context, research gaps occur. For example, developed countries are less frequently studied on an individual basis than developing countries tend to be. In cases where they are considered, these countries are often differentiated by their economic units or by continental boundaries (in global studies). In addition, climate regions or regions unified by trade agreements were not considered in the analyzed studies. Specifications of the concepts for empirical estimates in this direction could be a vital approach for future research.
4.3. Specifications of the concepts for empirical estimates
The third research question examined within the scope of this EGM refers to the specifications of the concepts for empirical testing relating to the choice of dependent and independent variables, curve shapes, and estimation methods. The great heterogeneity in the study specifications is striking, and can be attributed to a lack of theoretical specification in the underlying concepts. Thus, different authors interpret the concepts differently. The variation in independent variables tested as well as in the statistical methods applied is an additional benefit for gaining knowledge about the concepts being considered. These variations (independent variables and estimation methods) are attributed partly to varying data availability and access, as well as the presumed varying statistical skills of the different authors, which are also determined by data and method development over time. Econometric methods and statistical programs have evolved, which can be clearly seen in the more sophisticated methods that have being applied in recent publications. In some publications, basic studies are calculated using the FE or OLS estimators and were then compared to the results of more innovative estimators.
The forest-related dependent variables are variously defined by the authors of the selected articles. Forest definitions are often determined by the datasets applied or are not specified in detail by the authors. This was also observed by Choumert et al (2013), who explained the variation in variable specification by the different data sources and the various official values for forest-related variables. Although the underlying forest development concepts themselves already often lack a precise forest definition, this is, however, indispensable for empirical estimates for practical reasons of data application. Therefore, forest definitions are often practice- rather than theory-based. The greater heterogeneity of study specifications makes comparisons of estimates more complicated. This includes the specification of the shape of the curve, which depends on the chosen dependent variable. For example, when estimating the dependent variable 'rate of deforestation' for EKCd, the assumption of this concept results in an inverted U-shape of the curve, whereas for the dependent variable 'forest area,' a U-shaped curve is obtained. Thus, depending on the different dependent variables, the curve shapes also differ.
4.4. Limitations of the EGM
By disclosing all decisions and process steps, and by observing the approved protocols, the EGM method attempts to keep selection bias as low as possible. However, the present study omitted gray literature or non-English language articles. By considering peer-reviewed studies only, a potential publication bias exists. This publication bias occurs because peer-reviewed articles usually include statistically significant results (Rosenthal 1979). Therefore, peer-reviewed literature is considered to be only a subset of all the work done in the field and is not a perfect representation. Although we do not anticipate statistically insignificant results on this topic to be published increasingly in gray literature, the risk is more that statistically insignificant studies are likely to be underrepresented in peer-reviewed articles. The bias of ignoring non-English literature is considered to be low since supra-regional articles in particular that are relevant to this study are most likely to be published in English.
The methodological approach of a systematic map shows the research landscape of the topic. The method collects and maps the results but does not further analyze them. Conclusions about the quality of the studies, the dependent and independent variables selected, and the estimation methods cannot be drawn. The method serves as a first step by providing an overview of the comprehensive implementation of EKCd and FTH. For applying further research built on this EGM, e.g. meta-analyses or systematic reviews, it is relevant to additionally consider the potential multiplicity of studies. In this EGM, we reduced the number of effect sizes in the articles, however, multiplicity between articles needs to be considered in further studies.
4.5. Policy implications
The literature on quantitative assessments of the EKCd and FTH is extensive. At the same time, the results presented here show that the existence of both concepts and the de-facto policy implications failed to generate consensus. However, it is undisputed that political measures potentially facilitate or slow down forest area change. Thus, effective policy interventions for halting deforestation are important in shaping future forest development.
By displaying whether the hypotheses hold between different socio-economic variables and forest development, this EGM sheds light on research gaps relating to factors that actually affect forest area change. The number of published articles, as well as the broad geographical coverage, are promising approaches for gaining further insights into forest area development research. However, it also indicates that the FTH estimations are employed less often, even though the FTH concept is more far-reaching than EKCd and considers forest area development as a whole. There is a need for a more holistic approach to the concepts. The limited regional focus and period length of less than 30 yr covered by the studies seems very short when studying forest development. Although this EGM is a first step in the further analysis of which factors affect forest development, it already reveals gaps with regard to the limitation of the numerical estimations. The results of this study need to be incorporated in more in-depth analyses, e.g. a systematic review.
Future studies should extend the present work by pointing out the most relevant variables for future forest agenda setting and those policies that could be effective in halting deforestation by targeting certain baseline variables.
5. Conclusion
Previous and ongoing analyses of local and global forest development show that the identification of determinants to explain forest development is still a pressing issue of societal interest. The application of various concepts and specifications further shows that the question of which parameters are best suited to explain the development dynamics has not yet been resolved.
The EGM shows that differences exist not only in the numerical estimation between the EKCd and FTH concepts but also within each of the two concepts. Translating the concepts into numerical estimations is very heterogeneous across the studies, indicating a lack of theoretical specification and generalizability of the concepts. The large heterogeneity of the study specifications makes it difficult to compare the estimates.
The evidence base of the empirical estimates of forest development concepts outlined in this EGM encourages further investigations into the lessons that can be learned, which practices are the best in the existing analyses, and how these can be further supplemented. Hence, the present EGM can serve as a basis for further analyzing the concepts of EKCd and FTH. Key questions in future research could investigate whether the individual studies complement each other and provide transferable insights for the further development of the concepts, whether the studies contradict each other, or whether the situation is too heterogeneous to find synthesis for a universally valid concept of forest development. However, these conclusions are outside the scope of an EGM and should be verified in a comprehensive systematic review that builds on the present study results.
The use of systematic methods, such as EGM and systematic reviews, is not yet widespread in environmental and socio-economic research. However, it offers the possibility for systematically comparing existing research. In this way, the EGM ensures a comprehensible study selection and minimizes selection bias.
Acknowledgments
We would like to thank Matthias Dieter for fruitful discussion and sharing his expertise. We would like to thank two anonymous reviewers for their suggestions and comments which helped us to improve the quality of this work.
Data availability statement
All data that support the findings of this study are included within the article (and any supplementary files).
Conflict of interest
The authors declare that they have no known competing financial interests or personal relationships that could have appeared to influence the work reported in this paper.
: Appendix
Footnotes
- 3
Benchmark list extracted from Culas (2012) and Caravaggio (2020b), and includes Panayotou (1993); Koop and Tole (1999); Barbier and Burgess (2001); Bhattarai and Hamming (2001); Ehrhardt-Martinez et al (2002); Culas (2007); Damette and Delacote (2011); Culas (2012); Damette and Delacote (2012); Combes et al (2015); Crespo Cuaresma et al (2017); Joshi and Beck (2016); Andrée et al (2019).
- 4
Deforestation, e.g. is included with the contraction '*forest*'.