

Abstract
Nowadays, more than 70% of global freshwater is used for agriculture. The evaluation of the water footprint of crops (CWFs) is an important method to measure the effects of crop production on water resource utilization and water environmental pollution. However, little attention is paid to the impact of socioeconomic development differences on the water footprint of each crop. In this study, the green, blue, and gray water footprints of crop production were quantified, and the socioeconomic drivers of changes in the CWFs were revealed. It is of great significance to provide targeted guidance for agricultural water management in Heilongjiang, a province with the largest crop production in China. Here, we show that the total water footprint of crop production (TWF) increased from 62.2 billion m3 to 101.8 billion m3, and high-value areas were mainly concentrated in the west and south of Heilongjiang Province. Over 95% of the total grain crops sown were covered by maize, rice and soybean, which presented the greatest TWF. The share of green water footprint in TWF has increased, and crop growth is increasingly dependent on rainfall. Furthermore, our results highlight that the effective irrigated quota and crop-planting scale for maize and rice contribute to TWF increase. The TWF and agricultural value-added score were weakly decoupling in most municipalities, indicating the improved efficiency of crop water use; the TWF is growing slower than the economy, which is undesirable. Changes in TWF and agricultural value-added score were the same as the left half of the inverted 'U of the 'Environmental Kuznets Curve', which has not reached the 'inflection point'. More efforts to control the effective irrigated quota and crop-planting scale while improving effective irrigated efficiency are needed to ensure that economic growth does not come at the expense of consuming enormous quantities of water.
Export citation and abstract BibTeX RIS

Original content from this work may be used under the terms of the Creative Commons Attribution 4.0 license. Any further distribution of this work must maintain attribution to the author(s) and the title of the work, journal citation and DOI.
1. Introduction
Water resources are an indispensable material basis for people's production and life, and the sustainable development of a regional social economy cannot be separated from the adequate supply of water resources (Mugagga and Nabaasa 2016). The issue of water resources will be an essential constraint on future economic development and social progress, and may become the center of conflicts between regions or countries. In the occupation of water resources, agricultural water undoubtedly occupies the most significant proportion, of which irrigation accounts for about 70% of global freshwater withdrawal and 90% of water consumption (FAO 2010). It is of great significance to reasonably evaluate the spatial-temporal variation of green, blue, gray and total water footprint of crop production (TWF), to explore the driving factors, and provide feasible suggestions for efficient use and reasonable allocation of water resources.
The evaluation of water footprint is a method to quantify the social, economic, and environmental impact of water use, which can help decision-makers analyze the status of water supply, sustainable use and water resources protection in a specific area (Cai et al 2020). The water footprint shows the consumptive water use from both production and consumption perspectives in a region, while traditional water consumption indicators only show the water consumption related to production (Mekonnen and Hoekstra 2011). The evaluation index of water footprint can measure the total amount of water required by human activities in a specific period, including virtual water and actual water consumption, representing all water consumption in production activities, services and daily life (Aldaya et al 2010).
The crop water footprint can quantify the water required by the food production system, and it can be divided into green water footprint (green WF), blue water footprint (blue WF) and gray water footprint (gray WF) (Feng et al 2021). The green WF is the effective rainfall consumed in crop growth; blue WF is the irrigation water consumed during crop growth; and gray WF is the number of water resources required to dilute a load of nutrient elements and chemicals to a particular water quality standard during the growth of crops (Hoekstra et al 2011).
Crop water demand is the basis for measuring TWF, and it is also the basis for calculating irrigation water demand, because the regional irrigation water demand is determined according to the crop water demand and effective rainfall. In order to maximize crop yields, global irrigation water needs to increase by 146% (Davis et al 2017). Calculating the crop water requirement can be obtained using the empirical relationship between meteorological factors and crop water demand. The reference crop water requirement, also called the reference crop evapotranspiration (ET0), which is only related to meteorological factors, has been widely applied and has high accuracy. The Penman–Monteith formula recommended by Food and Agriculture Organization of the United Nations (FAO) is the widely used standard method for calculating ET0 (Gong et al 2006, Cai et al 2007). In addition, there are many studies on the water demand of major food crops in different regions (D'Odorico et al 2020), irrigation water demand (Nkomozepi and Chung 2012, Biemans et al 2016), the impact of climate change on crop water demand (Ye et al 2015, Urban et al 2017), and the forecast of future water demand (Wada et al 2013). For example, the water requirement of spring corn in China is 300–650 mm (Gao et al 2009). No matter what method is used to measure crop water demand, it needs to be based on experimental and meteorological data.
The calculation of TWF is not only limited to regional research, but also can compare and analyze the water footprint of different countries. Zotou and Tsihrintzis (2017) calculated the water footprint of 42 crops in Mesogeia based on the Blaney–Criddle and Penman–Monteith methods, and found that the water consumption of olive trees and vineyards accounted for 95% of the total water resources of the agricultural sector in this area. Compared with Penman–Monteith, Blaney–Criddle overestimated the theoretical water consumption of many crops. Mekonnen and Hoekstra (2011) evaluated the water footprints of crops and their derivatives from 1996 to 2005 on a global scale. Recent studies have quantified the composition of the water footprint for a specific crop, including maize, cotton, and cereal (Sun et al 2013a, Tsakmakis et al 2018, Zhao et al 2019).
Prior studies have addressed the scale and structure of the regional water footprint (D'Ambrosio et al 2018, Novoa et al 2019), but the research on the driving factors of crop water footprint has encountered some challenges. First, most studies ignore the different effects of socioeconomic factors on various crops in different municipalities, making it difficult to provide targeted policy recommendations. Second, most studies only calculated the water footprint of crops (CWFs) at special time points, rather than longer time spans, making it difficult to observe changes and to understand underlying mechanisms. Furthermore, different regions are affected by different socioeconomic development, and the scale and composition of the water footprints are different. The water footprint of the same crop produced in different regions is not the same, and there are fewer practical empirical methods combined with actual regional impacts. Heilongjiang is a major agricultural province with China's most significant grain production. It has experienced a boom in agriculture in the past few decades. Its grain output ranks first in China, as high as 75.03 million tons in 2018. The expansion of farmland has brought a lot of water consumption and high pressure of water demand. This study takes Heilongjiang as the study area, analyzes the spatiotemporal changes and drivers of TWF, and achieves the purpose of efficient management of regional agricultural water resources.
In this context, we estimated the water footprint of 10 crops (such as maize and rice) in 13 municipalities in Heilongjiang Province from 1998 to 2018, and analyzed their spatial-temporal variation. The socioeconomic driving factors of TWF were quantified by employing the logarithmic mean divisia index (LMDI) method; moreover, the degrees and drivers of municipalities' TWF-agricultural value-added decoupling were analyzed. We intended to provide suggestions for regional water resources management and the sustainable utilization of agricultural water supplies of municipalities at different social and economic development levels.
2. Materials and methods
2.1. Study area
The study area is Heilongjiang Province, which is located in northeastern China (figure 1) with the highest latitude and closest to the north in China. The province's land area is 4.5 × 10⁷ ha, accounting for 4.89% of the total area of China (ranking sixth in the country), of which the cultivated land area is 1.6 × 10⁷ ha, accounting for 35.12% of the total land area. The climate of this region is the temperate monsoon climate with an annual average temperature between −5 °C and 5 °C. Annual solar radiation in the province is between 4.4 × 10⁹ J m−3 and 5.0 × 10⁹ J m−3. The average yearly rainfall is between 400 mm and 650 mm, and the rainfall of the crop growing seasons accounts for 83%–94% of the total annual rainfall.
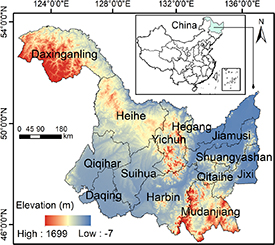
Figure 1. The topography and location of the Heilongjiang.
Download figure:
Standard image High-resolution image2.2. Agricultural water footprint analysis
The CWFs refers to the total amount of water resources required by crops throughout the growth period of the country or region. The calculation of the TWF includes green (WFgreen), blue (WFblue) and gray (WFgray) water footprint. Details of this model are provided in the supplementary material.
2.3. Tapio decoupling model
The term decoupling breaks the link between environmental pollution and economic growth, and the decoupling state is divided into eight types: weak decoupling, expansive coupling, expansive negative decoupling, strong negative decoupling, weak negative decoupling, recessive coupling, recessive decoupling, and strong decoupling. The decoupling model for constructing the change of agricultural value-added score and water footprint is as follows (Tapio 2005):
where  is the decoupling elasticity index (DITapio) of the water footprint in the year n.
  is the change in water footprint between the base year and the target year,
  is the water footprint in the base year,
  is the change in agricultural value-added score between the base year and the target year, and
  is the agricultural value-added score in the base year. The decoupling states and matching data range are presented in figure S1.
2.4. LMDI methodology
The LMDI method was used to analyze the driving factors of the changes in TWF. This method is proposed by Ang et al (1998), which is a divisia index employing a logarithmic mean weight function. Referring to the index selection of previous studies (Zhang et al
2018, Fu et al
2022), regarding the driving forces of TWF, five socioeconomic factors were constructed, including water use intensity ( ), effective irrigated quota (
 ), cropping pattern (
 ), crop-planting scale (
 ), and effective irrigated efficiency (
 ).
).
where WF is the CWF production [m3];  represents the yield of the
  th crop [t];
  is the irrigation area [ha];
  indicates the sown area of crops [ha];
  is the total crop yield [t];
  , representing the water consumed per unit of crop production;
  , representing the ratio of irrigated area to crop sown area;
  , representing the ratio of the production of crop
  to the total production of crops;
  , representing the sown area of crops, which indicates the effect of crop-planting scale;
  , representing the ratio of total crop yield to an irrigation area.
According to the LMDI model, the TWF of Heilongjiang Province in the base year is WF0, and the CWF production in year t is WFt . The calculation formula for the contribution of five driving factors:
where  ,
,  ,
,  ,
,  ,
,  indicate the contribution value of water use intensity effect, effective irrigated effect, cropping pattern effect, crop-planting scale effect, and effective irrigated efficiency, on the change of CWF production in Heilongjiang Province. If the contribution of the influencing factor is positive, it means that the change of TWF by the factor is an incremental effect; otherwise, it is a decrement effect.
Then, we link formulas (1) and (4) to decompose the decoupling elasticity index into five parts that are caused by changes in water use intensity (DII ), effective irrigated quota (DIQ ), cropping pattern (DIP ), crop-planting scale effect (DIS ), and effective irrigated efficiency (DIE ),

The data source is provided in the supplementary material.
3. Results
3.1. CWFs
Detailed characteristics of CWFs are provided in table S1. Figure 2 shows the green CWF, blue CWF, and gray CWF through their quartiles and distribution. From the statistics of the CWFs from 1998 to 2018, the greatest green CWF were observed for soybean (1599 ± 422 m3 t−1), sunflower (1518 ± 557 m3 t−1), millet (1192 ± 597 m3 t−1), and tobacco (954 ± 339 m3 t−1), while the lowest was detected for sugarbeet (163 ± 220 m3 t−1). The distribution and rank of blue CWF were different from green CWF; the greatest blue CWF were observed for tobacco (1097 ± 638 m3 t−1), wheat (739 ± 605 m3 t−1), sunflower (709 ± 528 m3 t−1), and soybean (705 ± 432 m3 t−1), while the lowest was also detected for sugarbeet (163 ± 169 m3 t−1). The greatest gray CWF were detected for tobacco (2824 ± 890 m3 t−1), followed by sunflower (1972 ± 963 m3 t−1), while the lowest was also detected for sugarbeet (297 ± 397 m3 t−1). Overall, the greatest CWFs was tobacco, soybean and sunflower. Figure S2 shows the water footprint of 10 crops in the 13 municipalities. Wheat demanded the most irrigation water among the five kinds of cereal, followed by millet, rice, and maize, while sorghum required the least irrigation water.
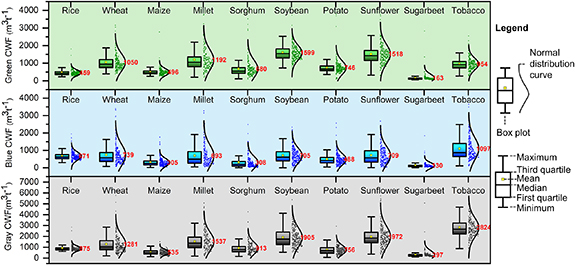
Figure 2. Crop water footprint in Heilongjiang.
Download figure:
Standard image High-resolution image3.2. Spatial-temporal characteristics of TWF
Figure 3 shows the spatial patterns and changes in TWF, and the TWF of different municipalities from 1998 to 2018 are shown in table S2. The total WF showed a gradual upward trend in Heilongjiang from 1998 to 2018. From the perspective of a multi-year average water footprint, Harbin ranks first with an average annual water footprint of 17.8 billion m3, followed by Qiqihar (15.9 billion m3) and Suihua (15.5 billion m3), respectively. The area with the lowest water footprint is Daxinganling, the area closest to the north, with an average annual water footprint of 0.5 billion m3. This is mainly due to the high elevation (figure 1), cold temperature, and low crop planting.
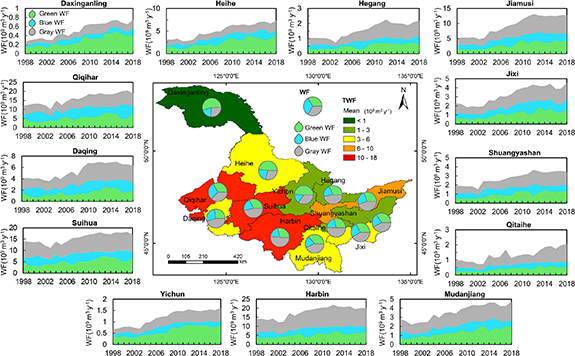
Figure 3. Spatiotemporal variations of the agricultural water footprint in Heilongjiang and in its 13 municipalities from 1998 to 2018.
Download figure:
Standard image High-resolution imageThe TWF has apparent temporal, spatial differentiation and zonality; the composition of green WF, blue WF and gray WF in different regions is different. The 'crests' and 'troughs' of fluctuating trends of TWF in each municipality have the same points; for example, the water footprint of each municipality in 2003 has a low value. From 1998 to 2018, the water footprints of Harbin, Suihua and Qiqihar accounted for more than 55% of Heilongjiang's TWF. Taking Harbin as an example, it accounted for 19.4%–23.3% of TWF.
The changing trend of TWF showed an upward trend during 1998–2018 (figure 4). The green WF in Heilongjiang increased at the rate of 1.2 ± 0.12 billion m3 yr−1 (R2 = 0.84), and gray WF increased at the rate of 1.17 ± 0.14 billion m3 yr−1 (R2 = 0.78). It can be found that the changing trend of gray WF is highly consistent with that of green WF. The Pearson correlation coefficient between green WF and gray WF is as high as 0.92. The blue WF has a large inter-annual fluctuation range, significantly different from the changes in green WF and gray WF. The blue WF showed a slight increase trend with the rate of 0.36 ± 0.17 billion m3 yr−1 (R2 = 0.19). Furthermore, the smooth function and first derivative of TWF show a generally increasing function (figure S3). The TWF data fit by the piecewise linear regression shows that the threshold from an increasing to a flat function is near 2012; TWF increased rapidly (at the rate of 1.1 billion m3 yr−1) from 1988 to 2012, and then increased steadily in the Heilongjiang Province.
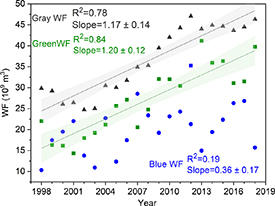
Figure 4. The change trend of green, blue and gray WF in Heilongjiang.
Download figure:
Standard image High-resolution imageChanges in the WF of ten crops were considered in Heilongjiang from 1998 to 2018 (figure 5(a)). The water footprint of maize, soybean and rice accounted for an absolute advantage of all crops, reaching more than 80%. Among these, the WF of rice and maize showed an increasing trend. However, soybean show a downward trend in fluctuations, first increasing and then decreasing. Soybean was the main water-consuming crop (35%) during 2004–2006; maize was the main water-consuming crop in other years. From 1998 to 2018, the WF of wheat and potato dropped significantly, from 4.3 billion m3 to 0.7 billion m3 and from 2.6 billion m3 to 1.3 billion m3, respectively. Millet, sorghum, sunflower, sugarbeet, and tobacco showed a downward trend. In 2018, maize, rice, and soybean water footprint accounted for approximately 97% of Heilongjiang's TWF.
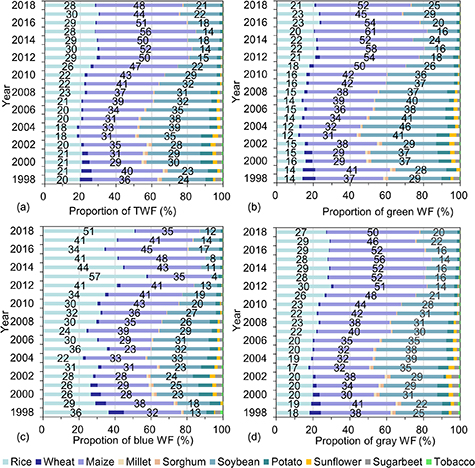
Figure 5. The shares of main crops to TWF in Heilongjiang: (a) proportion of TWF; (b) proportion of green WF; (c) proportion of blue WF; (d) proportion of gray WF.
Download figure:
Standard image High-resolution imageThe changing trend of the green WF is the same as that of TWF (figure 5(b)). The green WF of maize, rice and soybean accounted for more than 80% of all crops. From 1998 to 2018, the green WF of maize increased from 37% to 52%. The share of soybean green WF decreased from 29% to 25%, while the value of soybean green WF increased from 6.4 billion m3 to 9.8 billion m3. The number and proportion of the green WF of wheat, sorghum, sunflower, sugarbeet, and tobacco showed a downward trend.
The changing trend of the blue WF is quite different from that of TWF (figure 5(c)). Taking 2018 as an example, the proportion of the blue WF of rice reached 51%, while the proportion of the WF of rice was 28%. In general, the proportion of the blue WF of maize and rice is the dominant crop among ten crops in Heilongjiang. The blue WF of soybeans shows a downward trend in fluctuations. The most obvious point from 1998 to 2018 is that the proportion of the blue WF of wheat dropped from 8% to 1%.
From 1998 to 2010, the proportion of gray WF was mainly maize (30%–44%) and soybean (22%–38%), while the proportion of gray WF was mainly maize (46%–56%) and rice (26%–30%) during 2011–2018 (figure 5(d)). The rank of total gray water demand for crops in 2018 is maize > rice > soybean > potato > sorghum > wheat > millet > sugarbeet > tobacco > sunflower.
3.3. Evolution of the decoupling state between TWF and agricultural value-added score
We included 13 municipalities in the decoupling analysis according to TWF and agricultural value-added score between 1998 and 2018 (figure 6). Municipalities were grouped into weak decoupling, and Heilongjiang (decoupling elasticity index was 0.12) has weakly decoupled its agricultural value-added score from TWF at the province level. The decoupling analysis at the municipality level can provide important information on how urban development contributes to provincial decoupling trends.
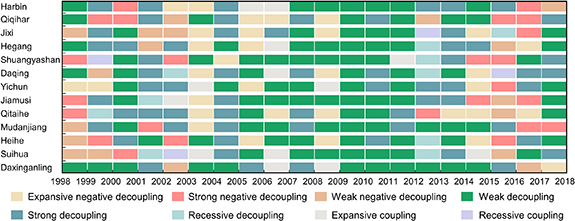
Figure 6. Decoupling effect of TWF and agricultural value-added score in Heilongjiang.
Download figure:
Standard image High-resolution imageThere were eight decoupling states between TWF and agricultural value-added score in Heilongjiang, namely expansive negative decoupling, strong negative decoupling, weak negative decoupling, weak decoupling, strong decoupling, recessive decoupling, expansive coupling, recessive coupling (figure 6), representing 12.3%, 9.2%, 6.9%, 37.3%, 23.8%, 3.8%, 5.0% and 1.5%, respectively (for detailed decoupling effect values see table S3). Harbin and Qiqihar, which have higher agricultural production value, TWF and agricultural value-added score, mainly take weak decoupling as the primary state, indicating that economic growth is at the expense of slowly increasing water use. Moreover, the TWF and agricultural value-added score of these two places showed strong decoupling for some years. It is the ideal state, indicating that agricultural value-added score has increased and the water footprint has reduced.
The TWF and agricultural value-added score mainly took weak decoupling as the primary type from 2006 to 2012 (figure 6). At this stage, all municipalities achieved agricultural economic growth. To summarize, the four decoupling states of TWF and agricultural value-added score, namely weak decoupling, strong decoupling, expansive coupling, and expansive negative decoupling, accounted for 65.4%, 15.4%, 10.3%, and 9.0%, respectively. The use of water resources in agricultural production areas has not received enough attention; it is necessary to pay attention to the efficiency of water resource utilization.
Furthermore, we fit the agricultural value-added score of all years and municipalities to their corresponding TWF, as shown in figure 7. The TWF will first increase and then decrease with the growth of agricultural value-added score in Heilongjiang Province, a finding that is consistent with the Environmental Kuznets Curve (EKC) assumption. Our empirical results weakly confirm such an 'inverted U-curve' relationship among municipalities in Heilongjiang Province. Thus, municipalities with rapid agricultural economic development tend to be more likely to achieve the decoupling of TWF and agricultural value-added score.
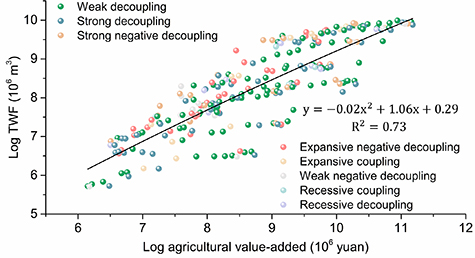
Figure 7. Environmental Kuznets curve for all municipalities.
Download figure:
Standard image High-resolution image3.4. Drivers of TWF changes and extent of decoupling
Figure 8(a) and table S4 show the driving factors of TWF change from the perspective of different crops from 1998 to 2018. During this period, TWF increased by 39.6 billion m3 in Heilongjiang. Effective irrigated efficiency is an essential driving factor for the growth of water footprint, but its effect has positive and negative effects in different research periods. From 1998 to 2003, effective irrigated efficiency led to a reduction of TWF to 40.7 billion m3 (−65.4% of net change measured in percentage, hereinafter referred to as abbreviated), while from 2003 to 2008, effective irrigated efficiency led to an increase in TWF of 33.1 billion m3 (+59.6%). The contribution of effective irrigated quota is mainly positive in different periods. From 2003 to 2008, the water footprint increased from 55.2 billion m3 to 83.4 billion m3. The main driving factors for the increase were the crop-planting scale (26.3 billion m3, +47.6%) and effective irrigated efficiency.

Figure 8. Structural decomposition analysis of the driving factors to the changes in TWF: (a) in the years 1998, 2003, 2008, 2013 and 2018; (b) contribution of different driving factors to crop water footprint from 1998 to 2018; (c) boxplot of driving factors.
Download figure:
Standard image High-resolution imageA detailed analysis of the TWF reveals that maize, rice and soybean were the main reasons for the increase in water footprint, increasing by 26.5 billion m3, 16.4 billion m3 and 5.7 billion m3, respectively (figure 8(b)). Water use intensity, effective irrigated quota and crop-planting scale were the principal motives for increasing the water footprint of soybean and rice. For example, water use intensity increases the water footprint of soybean by 2.5 billion m3. The effects of cropping pattern caused maize and rice to increase by 7.7 billion m3 and 4.8 billion m3, respectively, while the effects of cropping pattern were negative for other crops. Figure 8(c) shows that the changes in the TWF were mainly influenced by changes in effective irrigated quota, crop-planting scale, and effective irrigated efficiency rather than changes in water use intensity and cropping pattern. Effective irrigated efficiency contributes to TWF reduction, thus helping improve water security in Heilongjiang. Effective irrigated quota and crop-planting scale are the main reasons for increasing TWF. Precisely, the planting scale of various crops should be controlled.
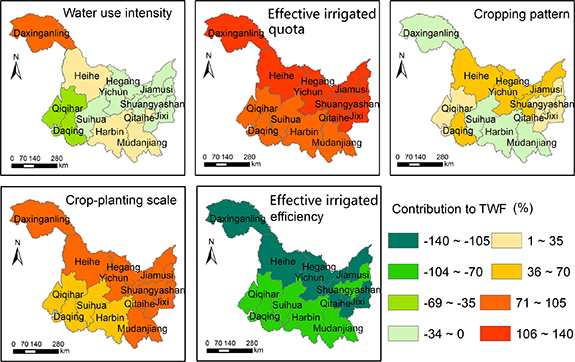
Figures 9 and S5 show the proportion of the rise in TWF caused by the five major driving factors at the municipality level from 1998 to 2018. The increase in effective irrigated quota is the main driving factor in all municipalities, particularly some northern municipalities with cluster characteristics. The largest took place in Daxinganling (+136%, 0.4 billion m3) and Jiamusi (+126%, 6.5 billion m3), Yichun (+123%, 0.8 billion m3) and Heihe (+122%, 3.8 billion m3), Harbin (+93%, 12.9 billion m3), Suihua (+85%, 12.0 billion m3) and Qiqihar (+97%, 11.7 billion m3). In addition, changes in crop-planting scale have also positively contributed to the increase in the water footprints of all municipalities. Moreover, the increase in effective irrigated efficiency is the most important driving factor for the decline in TWF, which is also a major driver in all municipalities. In contrast, water use intensity has a negative impact on TWF in some municipalities (such as Daqing, Qiqihar, and Shuangyashan). The cropping pattern positively impacts TWF in Harbin, Mudanjiang, Suihua and Daxinganling. Overall, there are noticeable regional differences in the contribution of different driving forces to TWF changes. Figure S6 shows the drivers of the decoupling elasticity index. From the perspective of the provincial level, the contribution of crop pattern adjustment to achieve TWF reduction is limited.
Figure 9. Structural decomposition analysis of the driving factors to the changes in TWF at the municipality level.
Download figure:
Standard image High-resolution image
4. Discussion
4.1. Comparison with other studies and recommendations for agricultural water management
The total grain output of Heilongjiang Province has ranked first in China for many years. Under the premise that crop planting areas are increasing yearly and the demand for green water is gradually increasing, the green WF accounted for an increasing proportion of TWF, rising from 35.4% in 1998 to 39.1% in 2018. Maize and rice have the largest blue WF, accounting for about 70% of the total blue WF. At the same time, the proportion of gray WF was mainly maize (46%–56%) and rice (26%–30%). Lovarelli et al (2016) showed that green WF and blue WF were quantified in all studies, while only 46% of authors considered grey WF. Grey WF was assessed in this study, indicating that maize production may have a potentially high risk of water contamination in Heilongjiang.
From the perspective of crop structure, maize and rice were the main positive contributors to changes in crop water footprint in Heilongjiang. A comparison between crop water footprint in the current study and the previous study are shown in table S5. Specifically, the average water footprints per unit yield of maize, rice, and soybean were 1336 m3 t−1, 2005 m3 t−1, and 4209 m3 t−1, respectively. Luan et al (2018) quantified the water footprints of maize as 1549 m3 t−1 in Hetao Irrigation District by using the Soil and Water Assessment Tool (SWAT) model. Mekonnen and Hoekstra (2011) calculated that the global water footprint of maize and rice were 1222 m3 t−1 and 1673 m3 t−1 by the CROPWAT (a decision support system developed by FAO) model. Zhuo et al (2016) calculated national average water footprints of maize, rice, and soybean were 1534 m3 t−1, 2101 m3 t−1, and 4393 m3 t−1 in China for the year 1978. The results of this study differ from those of other studies due to geographic location, climatic conditions, and calculation methods. Overall, the results of this study appear to be reliable.
4.2. Interpretation of TWF change
The TWF is closely related to climate factors (Sun et al 2013b), crop-planting structure, irrigation factors (Zhang et al 2018) and market laws (Mekonnen et al 2012). We explored the change process of TWF in Heilongjiang at a temporal scale. Falsetti et al (2020) showed prices for staple food crops such as wheat, maize, soybeans and potatoes typically embedded in the amount of water used for their production. Changes in the agricultural producer price index are presented in table S6. From 1999 to 2002, with the deepening of the agricultural marketing process, the price of main grain (rice, maize and soybean) and the income from growing grain continued to fall. After 1999, with the deepening of the agricultural marketing process, the price of grain and the income from growing grain continued to fall. As a result, the planting of cash crops with relatively high returns has increased, and the proportion of the water footprint of cash crops has also increased (figure 5). The lowest value of TWF in 2003 (figure 3) was mainly due to the weak grain market, the decline in grain prices and farmers being unprofitable in growing grain for the previous few years. Since the start of the 21st century, the grain output in Heilongjiang has been below 30 million tons, continuously lower than the level in 2000. In 2003, it dropped sharply to only 25 million tons, which was less than the grain output in 1994. An increasingly tight food supply caused food prices to rise sharply in the second half of 2003, pushing up the consumer price index. At the beginning of 2004, the government issued a document that further emphasized the requirement to 'concentrate efforts to support the development of the grain industry, and promote grain farmers to increase their income'. Implementing these measures led to increased crop planting areas after 2003, ultimately leading to a rise in TWF. In 2013, the blue WF of rice accounted for more than 50%, mainly due to the severe flooding in Heilongjiang, which reduced the grain crop yield in dry areas.
Exploring TWF change from the perspective of crop planting structure, before 2010, the TWF was mainly composed of maize and soybean. Due to the subsequent sharp increase in soybean production costs, the average output value of soybeans per ha is far less than that of maize. Moreover, the profit of soybean production has fallen sharply (for example, the average net profit of soybeans was 1527 yuan per ha in 2009 and fell to 741 yuan per ha in 2013). Farmers have gradually reduced the scale of soybean production and turned to maize production. Thus, the water footprint of soybean decreased significantly, and that of maize increased. However, our research shows that the contribution of crop pattern adjustment to achieving TWF reduction is limited. Both maize and soybean are dryland crops; the increased effect of maize and the reduced effect of soybean on TWF were offset.
Maize is the primary animal fodder and its supply is likely to be affected by the demand for meat. We conducted a correlation analysis between the water footprint of maize and the yield of meat (table S7), and the result shows that the Pearson correlation coefficient of them is 0.44 (p < 0.05). There is a positive correlation between the water footprint of maize and meat production. It is unclear whether the government may encourage meat production, even if it entails higher water footprints in the municipalities. In contrast, the government has released the 'Healthy China Action', which shows that tobacco is harmful. It will gradually increase the proportion of the population covered by comprehensive smoke-free regulations, and promote the adoption of comprehensive measures such as taxation and price adjustment to improve the effectiveness of tobacco control. In Heilongjiang, we found that the decrease in the proportion of tobacco water footprint gradually decreased, which may be related to this environment.
During the 'Ninth Five-Year Plan (1996–2000)', China focused on promoting agricultural water-saving irrigation (Wang et al 2020). Vigorously improving irrigated efficiency is generally regarded as an important way to solve the problem of water shortage. This study found that an increase in effective irrigated efficiency reduced TWF; in contrast, effective irrigated quota increased TWF. This phenomenon has been observed in many studies, where higher effective irrigated efficiency results in higher irrigation water usage than by the previously used less efficient systems. It is a 'Jevons' Paradox' (Contor and Taylor 2013, Wang et al 2020). Because the improvement of effective irrigated efficiency will reduce water consumption for the same production, farmers will be more inclined to expand the irrigated area to increase agricultural output and economic income, which increases TWF.
4.3. Limitations and future improvements
The results of crop water footprint evaluation have obvious spatial distribution characteristics. This study relies on the models utilizing municipality-level data that cannot address the unobserved heterogeneity in crop outputs and the construction of confidence intervals in its presence. Most of the data in this study come from meteorological or statistical data. The most accurate method to determine the effective rainfall is through field observation, while the effective irrigated quota and efficiency are obtained through the investigation of irrigation practices.
For future studies, we recommend using detailed spatial geographic information and exploring the changing laws of water footprint from the perspective of crop nutritional value, and investigating the interaction of market prices and government policies and crop water footprint based on farm-level data. This study focuses on the impact of socioeconomic factors on crop water footprint, and the impact of long-term series of meteorological factors on water footprint can be further studied.
5. Conclusions
In this study, we quantified the green WF, blue WF, gray WF, and TWF of ten crops in Heilongjiang Province from 1998 to 2018, and analyzed the spatiotemporal changes in TWF. Furthermore, we established the LMDI and Tapio decoupling model, which revealed the impact of socioeconomic development differences on the water footprint of different crops, and proposed targeted guidance on agricultural water management.
The changing trend of TWF showed an upward trend at the rate of 2.7 ± 0.2 billion m3 yr−1 in Heilongjiang Province. The average overall green (green WF, from rainfall), blue (green WF, from irrigation) and gray (gray WF, water demanded to assimilate pollutants) water footprints of crops in the period 2008–2018 were 68%, 23%, and 50% larger than the period 1998–2007. The blue WF of crops was lower than the green WF, and crop growth is highly dependent on green water. The rank of total water demand for crops is tobacco (4812 ± 1631 m3 t−1) > soybean > sunflower > millet > wheat > rice > potato > sorghum > maize > sugarbeet (590 ± 769 m3 t−1).
Due to differences in conditions such as socioeconomic development and planting area in various regions, the spatial distribution of TWF in 13 municipalities in Heilongjiang was uneven, and TWF was surplus and deficient simultaneously. The TWF and agricultural value-added scores mainly were weakly decoupling. Daxinganling, Yichun, Qitaihe, and Hegang had low TWF; Harbin, Suihua, and Qiqihar had high TWF. Effective irrigated quota and crop-planting scale were the main reasons for increasing TWF, and there is a need to control the effective irrigated quota while improving effective irrigated efficiency. A municipality-level inverted-U relationship between TWF and agricultural value-added was confirmed. The efficiency of water use needs to be improved to ensure that the growth of agricultural value-added score is not in exchange for consuming a large number of water resources.
The findings of this study are essential in shaping the water management policies of crop production because they reveal the drivers of different socioeconomic factors for the water footprint of each crop. Understanding the link between crop-planting scale, crop structure, effective irrigated efficiency, and crop water footprint makes it possible to develop targeted management measures. From the perspective of reasonably controlling the regional planting scale and effective irrigated quota, there is a need to excavate the potential space for water-saving and to ensure the sustainable development of the regional agricultural economy. Furthermore, the TWF-agricultural value-added score decoupling lessons in Heilongjiang may have meaningful implications for other municipalities with expanding cropping land in pursuit of water-saving development.
Acknowledgments
The Agricultural Land System group at AGRIRS provided valuable support throughout the research. This research was financially supported by the National Key Research and Development Program of China (2019YFA0607400), the China Postdoctoral Science Foundation (2022M713414), the National Natural Science Foundation of China (42201401, 41871356), and Public-interest Scientific Institution Basal Research Fund (Nos. Y2022QC16, CAAS-ZDRW202107).
Data availability statement
All data that support the findings of this study are included within the article (and any supplementary files).
Conflict of interest
The authors declare no competing interests.
Supplementary data (10. MB DOCX)