

Abstract
As components of terrestrial carbon sinks, vegetation and soil carbon pools are important for offsetting CO2 emissions. However, differences in their carbon sequestration capacities and their responses to global change in the future are poorly understood. This study assessed the changes in vegetation and soil carbon and their ratios and drivers under the SSP126 scenario from 2015 to 2060, using Coupled Model Intercomparison Project phase 6 simulations in China, a major carbon sink region in global terrestrial ecosystems. The content of vegetation carbon (29 ± 1 PgC) was observed to be lower than that of soil carbon (113 ± 23 PgC), and the ratio of vegetation to soil carbon was the highest in the subtropical-tropical monsoon climatic region (0.55 ± 0.12). Moreover, the total stock of vegetation and soil carbon increased by 10 ± 1 PgC during the study period, and the increase in vegetation carbon was 4.31 times that of soil carbon, because the responses of vegetation carbon stocks to increased forest coverage and atmospheric CO2 were greater than that of soil carbon stocks, especially in the subtropical-tropical and temperate monsoonal climatic regions. However, bare land encroachment on grasslands reduced their increments in the temperate monsoonal and high-cold Tibetan Plateau climatic regions. Furthermore, compared with SSP245 and SSP585 scenarios, vegetation and soil carbon sinks can offset a greater amount of carbon emissions in 2060 under the SSP126 scenario, accounting for 53% of all carbon emissions, offsetting 60%–79% of carbon emissions from China under its policy of increasing forest coverage. The study revealed the important role of afforestation in increasing ecosystem carbon stocks, additionally, grassland conservation and deep reductions in carbon emissions cannot be ignored in the future. This study provides a basis for determining the response of vegetation and soil carbon to environmental factors and the realization of net-zero emissions globally.
Export citation and abstract BibTeX RIS

Original content from this work may be used under the terms of the Creative Commons Attribution 4.0 license. Any further distribution of this work must maintain attribution to the author(s) and the title of the work, journal citation and DOI.
1. Introduction
Terrestrial ecosystems absorb approximately 31% of total anthropogenic carbon emissions annually (Friedlingstein et al 2020). Therefore, enhancing carbon sinks in these ecosystems is necessary to achieve net-zero emissions and curb global warming (Schimel et al 2015, Windisch et al 2021). Changes in vegetation and soil carbon stocks are important carbon sinks (Friedlingstein et al 2020), and several studies have investigated their combined carbon sequestration benefits and roles in offsetting carbon emissions (Fang et al 2018, Huang et al 2022, Yang et al 2022). However, there may be a vast difference in the carbon sequestration capacities of vegetation and soil (Jiang et al 2016, Xu et al 2019), and only a few studies have comprehensively assessed these regional differences and influencing factors, which are important for understanding the response of changes in vegetation and soil carbon stocks to environmental factors and accurately predicting ecosystem carbon sinks.
Owing to the superposition of multiple factors (Thurner et al 2017, Lu et al 2018, Dusenge et al 2019, Hong et al 2020), changes in vegetation and soil carbon stocks have large regional differences, and previous studies have explored their main drivers globally and regionally in the past few decades (Lu et al 2018, Chen et al 2019b, Li et al 2022). Recently, the carbon storage of the global biosphere has been gradually increasing, with major contributions from changes in vegetation structure (leaf area index) (Chen et al 2019b) and rising CO2 concentrations (Peng et al 2014). In tropical forests, satellite-based observations indicate a continuous loss of carbon stocks since the 21st century (Baccini et al 2017, Li et al 2022), majorly because of agricultural expansion (82%), especially in South America and Southeast Asia (Feng et al 2022). In contrast, global warming may prompt temperate forests to absorb more carbon (Keenan et al 2014). Favorably, ecological restoration projects have improved vegetation and soil carbon stocks in certain areas in China (Lu et al 2018, Tong et al 2018).
Recently, to achieve carbon neutrality in most countries (van Soest et al 2021), studies have begun to focus on changes in vegetation or soil carbon stocks and their climate drivers (Aparício et al 2015, Wu et al 2018, Li et al 2021), as well as soil carbon sequestration (Ito et al 2020) of Land Use Model Intercomparison Project models (Lawrence et al 2016) under different climate and land use conditions in the future. However, few studies have compared the differences in the carbon sequestration capacity between vegetation and soil carbon, especially under the combined effects of future human socioeconomic and climate change. The SSP126 scenario, which connects Representative Concentration Pathways with low forcing (van Vuuren et al 2011) and Shared Socioeconomic Pathways with low emissions (Riahi et al 2017) in Coupled Model Intercomparison Project phase 6 (CMIP6) (O'Neill et al 2016), is a research hotspot that could be used to predict the scope of changes in carbon stocks under a scenario of atmospheric warming less than 2 °C from the Industrial Revolution to 2100. These widely used Earth System Models (ESMs) include complex biogeochemical processes and interactions among 'atmosphere–vegetation–soil' (Cherchi et al 2019, Lawrence et al 2019, Mauritsen et al 2019, Swart et al 2019, Yukimoto et al 2019, Seland et al 2020, Ziehn et al 2020, Wu et al 2021) that can provide insights on the factors that influence variations in vegetation and soil carbon stocks in the future.
As a region with plans for extensive afforestation (Chen et al 2019a), China has experienced a substantial increase in vegetation and soil carbon stocks in recent years. Ecological restoration projects, such as the national project (Lu et al 2018), and those in the northeast (Hong et al 2020), southwest (Tong et al 2018), and semi-arid and semi-humid (Niu et al 2019) areas, have made substantial contributions to the global carbon sink and absorption of CO2 emissions (Piao et al 2009, Wang et al 2020, 2022). Recently, estimations were made of future ecosystem carbon sinks in all of China (Huang et al 2022) and only forests (Cai et al 2022). However, the assessment of these carbon sinks only relied on simple empirical equations related to forest age or atmospheric CO2 concentration, and the responses of changes in vegetation and soil carbon stocks in China to environmental factors remain poorly understood.
Based on an ensemble average of nine ESM simulations under the SSP126 scenario, this study aimed to evaluate the magnitude and ratio of vegetation and soil carbon stocks (a) and carbon sinks (b) and their variations across different climatic regions. The main contributors (c) to changes in vegetation and soil carbon stocks were also analyzed in China during 2015–2060. This study not only provides a knowledge base for clarifying the dynamic changes in vegetation and soil carbon stocks, and their potential responses to environmental factors under a warming of below 2 °C scenario but also provides a basis for enhancing ecosystem carbon sinks and achieving carbon neutrality.
2. Data and methods
2.1. Data
2.1.1. Carbon density and carbon flux data
Monthly vegetation and soil carbon densities (cVeg and cSoil) during 2015–2060 from nine publicly accessible ESMs with climate change and land use change modules (i.e. ACCESS-ESM1-5, BCC-CSM2-MR, CanESM5, CESM2-WACCM, CMCC-CM2-SR5, CMCC-ESM2, IPSL-CM6A-LR, MPI-ESM1-2-LR, and NorESM2-LM) participating in CMIP6 were obtained from https://esgf-node.llnl.gov/search/cmip6/ under SSP126 scenario, and the same variant label 'r1i1p1f1' was used for all data. Moreover, the historical vegetation and soil carbon data were also downloaded during 1980–2009 of these ESMs for comparison with previous studies. Additionally, total anthropogenic CO2 emission data were used for the auxiliary analysis of the mitigation capacity of vegetation and soil to achieve carbon neutrality under different scenarios (SSP126, SSP245, and SSP585), which was summed by the anthropogenic CO2 emissions from all sectors, including agriculture; energy; industrial; transportation; residential, commercial, other; solvents production and application; waste; international shipping; negative CO2 emissions, and was obtained from https://esgf-node.llnl.gov/search/input4mips/.
Although the models considered different soil depths (table 1), the resulting analysis of the dynamics of soil carbon stocks was only slightly impacted, and most of these dynamics occurred in the surface layer considering the typically stable deep soil (Hou et al 2019). Factors considered by the models were climate and land use changes. However, not all models had nitrogen cycle modules (table 1); therefore, nitrogen deposition data were excluded from the attribution analysis.
Table 1. Introduction of CMIP6 ESMs analyzed in this study, including the number of cells (resolution), land sub-models, soil layers and depth, and whether climate change, land use change, and nitrogen cycling processes were considered.
| Models | Number of cells | Land sub-model | Soil pools or layers (no bedrock) | Soil depth (no bedrock) | Climate change | Land use change | Nitrogen cycle | References |
|---|---|---|---|---|---|---|---|---|
| ACCESS-ESM1-5 | 145 × 192 | CABLE2.4 | Microbial, slow, passive | Unknown | √ | √ | √ | Ziehn et al (2020) |
| BCC-CSM2-MR | 160 × 320 | BCC-AVIM2 | Surface structural material; soil structural material; soil microbes; surface microbes; surface metabolic material; slow SOM; passive SOM | Unknown | √ | √ | —— | Wu et al (2019), (2021) |
| CanESM5 | 64 × 128 | CLASS-CTEM | Three permeable soil layers | 4.1 m | √ | √ | —— | Swart et al (2019) |
| CESM2-WACCM | 192 × 288 | CLM5 | 5 (0.4 m)–20 (8 m) layers | Spatially variable soil depth (0.4–8.5 m) | √ | √ | √ | Lawrence et al (2019) |
| CMCC-CM2-SR5 | 192 × 288 | CLM4.5 | 10 layers | 3.8 m | √ | √ | √ | Cherchi et al (2019), Oleson et al (2013) |
| CMCC-ESM2 | 192 × 288 | CLM4.5 | 10 layers | 3.8 m | √ | √ | √ | Cherchi et al (2019), Oleson et al (2013) |
| IPSL-CM6A-LR | 143 × 144 | ORCHIDEE | 11 layers | 2 m | √ | √ | —— | Boucher et al (2020) |
| MPI-ESM1-2-LR | 96 × 192 | JSBACH 3.20 | 4 layers | 4.1 m | √ | √ | √ | Hagemann and Stacke (2015), Mauritsen et al (2019) |
| NorESM2-LM | 96 × 144 | CLM5 | 5 (0.4 m)–20 (8 m) layers | Spatially variable soil depth (0.4–8.5 m) | √ | √ | √ | Seland et al (2020) |
a The ESMs participating in CMIP6 have a strong ability to simulate the ecosystem carbon cycle. To analyze the impact of land use change and climate change on vegetation and soil carbon storage, we have chosen the nine ESMs that included climate change and land use change processes and had publicly available data on vegetation and soil carbon densities and climate variables during 2015–2060. b The recorded soil depths were measured from the soil surface to the upper boundary of the bedrock. Soil depth information was not reported for ACCESS-ESM1-5 and BCC-CSM2-MR models, and the soils in these models were divided into several pools based on turnover rates.
2.1.2. Environment variables
To analyze the factors influencing carbon stock changes during 2015–2060, monthly climate data (including temperature and precipitation) of nine ESMs under the SSP126 scenario were downloaded from https://esgfnode.llnl.gov/search/cmip6. Annual atmospheric CO2 data under the SSP126 scenario were obtained from the website of forcing datasets needed for Model Intercomparison Projects in CMIP6 (https://esgf-node.llnl.gov/search/input4mips). Additionally, the percentage coverages (%) of different land types (including forests, croplands, farmland, cities, and bare land) during 2015–2060 under the SSP126 scenario were obtained from the LUH2 (Hurtt et al 2020), which was used as the land use forcing for CMIP6.
All data were aggregated to annual values, resampled to 0.5° × 0.5°, and clipped using China's border map.
2.2. Method
2.2.1. Calculation of carbon stocks
The carbon stocks of vegetation (cVeg) and soil (cSoil) in China were calculated according to the weighted sum of their carbon density and area and subsequently, converted to a unit of 'PgC' (1 PgC = 1015 gC). Additionally, equation (1) was also used to calculate the carbon stocks in four climatic regions (He et al 2019; supplementary figure 1): temperate continental, temperate monsoonal, high-cold Tibetan Plateau, and subtropical-tropical monsoonal:
where  is the carbon stock (cVeg or cSoil; PgC) in China or the four climatic regions,
  and
and  are the carbon density (gC m−2) and area (m2) of pixel i, respectively
2.2.2. Carbon stock or sink ratios of vegetation to soil
Vegetation to soil carbon stock ratios ( ; equation (2)) were calculated for China and each climate region to compare variations. For further comparisons of the carbon sequestration capacities of vegetation and soil during the study period, carbon sink ratios (
 , equation (3)) were estimated:
where  and
and  are the ratios of vegetation to soil carbon stocks and carbon sinks, respectively, and
  and
and  are the temporal trends of vegetation and soil carbon stocks from 2015 to 2060.
2.2.3. Effect of environmental factors on carbon stock modifications
Before conducting attribution analysis, the LUH2 dataset was reclassified into the land use types (forest, grassland, cropland, city, and bare land) analyzed in this paper according to the classification scheme of supplementary table 1. The average coverage (%) of LUH2 land use has relatively small differences with MODIS observations, and forests increased and grasslands declined from 2015 to 2020, which is consistent with MODIS (supplementary table 2). The annual changes in the average coverage (%) of each land use type in China and the four climatic regions were observed (supplementary figure 2). The results showed that the main land use change characteristics in China and the four climatic regions were: conversion of grasslands to forests and bare lands (occurring in China and the high-cold Tibetan Plateau climatic region), conversion of grasslands to forests (occurring in the subtropical-tropical monsoonal climatic region), conversion of grasslands to bare lands (occurring in the temperate continental climatic region), and conversion of grasslands and croplands to forests and bare lands (occurring in the temperate monsoonal climatic region) under the SSP126 scenario (supplementary figure 2). Consequently, to avoid collinearity, the percentage coverages of target land use type (i.e. forests or bare lands) (supplementary figure 2(f)) were used to represent land use change factors ( ) in the attribution analysis. A map of their changes from 2015 to 2060 was shown in supplementary figure 3.
Major contributors to carbon stock changes in China under the SSP126 scenario were identified using equation (4) (He et al
2019) to calculate the contribution ( ) of precipitation (
 ), temperature (
 ), CO2 (
 ), and land use change factors (
 ) on the trend of carbon stocks (Y), expressed as the rate of the product of the standardized environmental factors (
 ) and its regression coefficient (
 ) in the multiple linear regression equation (5):
where t is the study period, i.e. 2015–2060, d/dt is the time derivative,  are the annual standardized values of environmental factors, i.e. precipitation (
 ), air temperature (
 ), atmospheric CO2 (
 , and land use change factors (
 ) in China or the four climatic regions during 2015–2060 on average. The land use change factors represent the percentage coverages (%) of different land use types in different regions: forest and bare land in China and the temperate monsoonal and high-cold Tibetan Plateau climatic regions, forest in the subtropical-tropical monsoonal climatic region, and bare land in the temperate continental climatic region (supplementary figure 2(f)). Other environmental factors have historical simulations consistent with observations (supplementary figure 4), and their annual changes during 2015–2060 were shown in supplementary figure 5. bi
represents the response coefficient of carbon stocks to each factor, which was calculated using equation (5):
) in China or the four climatic regions during 2015–2060 on average. The land use change factors represent the percentage coverages (%) of different land use types in different regions: forest and bare land in China and the temperate monsoonal and high-cold Tibetan Plateau climatic regions, forest in the subtropical-tropical monsoonal climatic region, and bare land in the temperate continental climatic region (supplementary figure 2(f)). Other environmental factors have historical simulations consistent with observations (supplementary figure 4), and their annual changes during 2015–2060 were shown in supplementary figure 5. bi
represents the response coefficient of carbon stocks to each factor, which was calculated using equation (5):
where b0 is a constant and  is the residual. Y represents the carbon stocks.
  ,
,  ,
,  , and
, and  are the responses of carbon stocks to standardized annual precipitation, annual average temperature, atmospheric CO2, and land use change factors, respectively, during the study period.
2.2.4. Uncertainty between simulations of ESMs
All calculations were performed not only in the ensemble average of multiple ESMs simulations, but also in each ESM simulation. Furthermore, we used the standard error (SE; equation (6); McHugh 2008) of the statistical results of the nine ESMs to characterize the uncertainty between multi-model simulations:
where SD and n are the standard deviation and count of a set of numbers, respectively.
3. Results
3.1. Spatial patterns and ratios of vegetation and soil carbon stocks in China from 2015 to 2060
The vegetation carbon stock was lower than soil carbon stock in China for all pixels (Ratiostock < 1; figures 1(a)–(c)), and the average vegetation carbon stock was 29 ± 1 PgC from 2015 to 2060, accounting for approximately 26 ± 6% of the soil carbon stock (113 ± 23 PgC; figure 1(f)). Initially, the Ratiostock decreased rapidly and then increased slightly with increasing latitude, whereas it first increased and then decreased with increasing longitude (figures 1(d) and (e)). The Ratiostock values above 0.5 were mainly observed at 21–29° N (figure 1(d)).
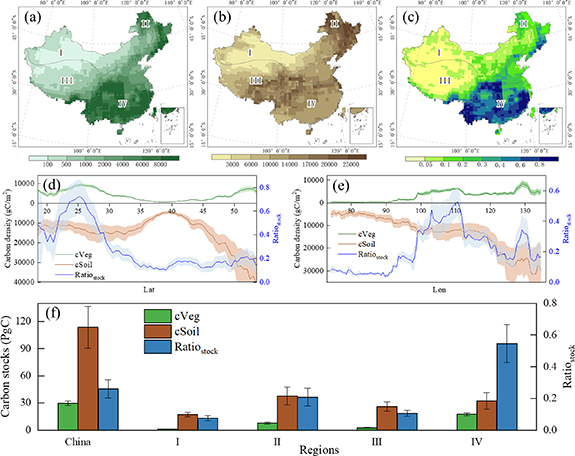
Figure 1. Spatial pattern of magnitude and ratio of multi-year average vegetation and soil carbon in China from 2015 to 2060 under the SSP126 scenario. The spatial pattern of multi-year average (a) vegetation and (b) soil carbon density (gC m−2), and (c) the ratio of vegetation to soil carbon (Ratiostock). The (d) latitude and (e) longitude distribution of average density of vegetation (cVeg; above the y-axis = 0) and soil carbon (cSoil; below the y-axis = 0), as well as Ratiostock. The magnitude of total vegetation (cVeg) and soil carbon (cSoil), and their ratios (Ratiostock) in four climatic regions of China, namely temperate continental (I), temperate monsoonal (II), high-cold Tibetan Plateau (III), and subtropical-tropical monsoonal (IV) climatic regions. The shadings in figures (c) and (d) and the error bars in figure (f) are the standard errors between the simulations of the nine earth system models. The spatial maps of vegetation carbon, soil carbon, and Ratiostock for each model were shown in supplementary figures 6–8.
Download figure:
Standard image High-resolution imageThe highest Ratiostock were observed in the subtropical-tropical monsoonal (0.55 ± 0.12) and temperate monsoonal (0.21 ± 0.06) climatic regions, with high vegetation carbon stocks of 17 ± 1 PgC and 8 ± 1 PgC, respectively (figure 1(f)). However, in the high-cold Tibetan Plateau and temperate monsoonal climatic regions, carbon was mostly stored in the soil, and the ratio of vegetation to soil carbon was 0.11 ± 0.02 and 0.08 ± 0.02, respectively (figure 1(f)).
3.2. Vegetation and soil carbon trends and ratios in China from 2015 to 2060
Vegetation and soil carbon in China showed increasing trends from 2015 to 2060, with a total carbon sequestration of 10 ± 1 PgC (figure 2(a)). Specifically, the carbon sequestration rate of vegetation (0.19 ± 0.01 PgC yr−1) was approximately 4.31 times greater than that of soil (0.04 ± 0.01 PgC yr−1; figure 2(e)). The temperate monsoon climatic region's Ratiosink (9 ± 1) was the highest (figures 2(d) and (e)) among the climatic regions because the growth rate of vegetation carbon was relatively high (0.067 ± 0.006 PgC yr−1), while that of soil carbon was low (0.007 ± 0.003 PgC yr−1) (figures 2(b), (c) and (e)). The greatest increase in vegetation carbon stocks was observed in the subtropical-tropical monsoon climatic region at 0.097 ± 0.008 PgC yr−1, which was approximately 5.52 ± 2.05 times the soil carbon stock (figure 2(e)). Conversely, Ratiosink was low in the high-cold Tibetan Plateau (1.66 ± 0.38) and temperate continental (1.04 ± 0.77) climatic regions, which presented relatively high soil carbon sequestration potential (figures 2(b), (c) and (e)).
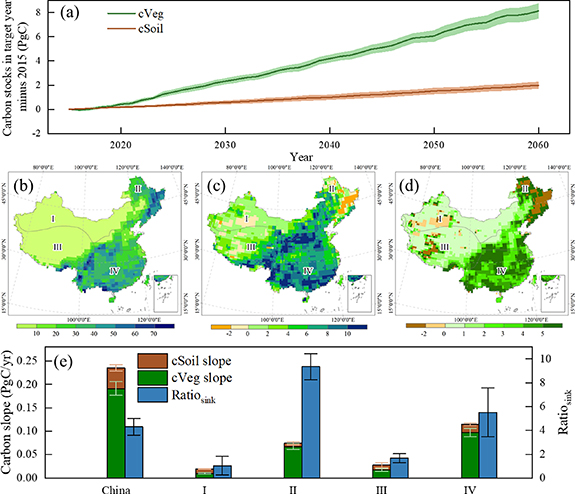
Figure 2. Temporal trends of vegetation and soil carbon, and their ratios in China from 2015 to 2060 under the SSP126 scenario. (a) Annual changes in vegetation and soil carbon relative to 2015; spatial patterns of trends (gC m−2yr−1) of (b) vegetation and (c) soil carbon and (d) their ratios; cumulative trends in vegetation and soil carbon stocks, and their ratios in the four climatic regions of China (e). Ratiosink is the ratio of vegetation to soil carbon sinks. The shadings in figure (a) and the error bars in figure (e) are the standard errors between the simulations of the nine earth system models. The spatial maps of trends in vegetation carbon, soil carbon, and Ratiosink for each model were shown in supplementary figures 9–11.
Download figure:
Standard image High-resolution image3.3. Effects of environmental factors on vegetation and soil carbon stock variations in China from 2015 to 2060
This study also explored the impacts of environmental factors on the dynamics of vegetation and soil carbon stocks in China. Vegetation and soil carbon responded positively to temperature and precipitation (figures 3(a) and (b)), while their contributions to stocks were small owing to the low response coefficients (figures 3(a)–(d)). Compared with temperature and precipitation, major contributions to the increased vegetation and soil carbon stocks of China were observed from increased forest coverage during the study period, with a contribution of up to 81 ± 0.4% and 82 ± 3% in vegetation and soil, respectively (figures 3(c) and (d)). Carbon stocks were highly correlated with the normalized forest coverage (figures 3(a) and (b)), and with increasing forest coverage, more carbon was stored in vegetation than in soil (figure 2(e)) due to a higher response coefficient of vegetation carbon (2.10 ± 0.28) than that of soil carbon (0.49 ± 0.15) (figures 3(a) and (b)). Moreover, the substantial increase in forest coverage (supplementary figure 2) promoted an expansion in vegetation carbon stocks in the subtropical-tropical monsoonal and temperate monsoonal climatic regions from 2015 to 2060 (figures 2(e) and 3(c), (d)).

Figure 3. Effects of environmental factors on variations in vegetation and soil carbon stocks across China's climatic regions from 2015 to 2060 under the SSP126 scenario. Standardized response coefficients of (a) vegetation and (b) soil carbon stocks to variations in precipitation (Pre), temperature (Tem), CO2, forest coverage (Forest), and bare land coverage (Bare); contributions of these environmental factors to changes in (c) vegetation and (d) soil carbon stocks; (e) trends in the normalized environmental factors across climatic regions. The trends in the normalized factors are the slopes of standardized values of annual average environmental factors in China or the four climatic regions during 2015–2060 (supplementary figures 2 and 5). The error bars are the standard errors between the simulations of the nine earth system models. The map of the change in percent coverage (%) of forest (a) and bare land (b) from 2015 to 2060 was shown in supplementary figure 3.
Download figure:
Standard image High-resolution imageRising CO2 concentrations were a secondary factor in the increase in China's vegetation and soil carbon stocks, contributing 65 ± 1% and 60 ± 6%, respectively; presenting a similar response in the high-cold Tibetan Plateau climatic region, but playing a role as important as the forest in two monsoonal climatic regions (figures 3(c) and (d)).
The increase in China's vegetation and soil carbon was impacted by bare land expansion (response coefficients: −1.43 ± 0.53 and −0.30 ± 0.17; figures 3(a) and (b)) that encroached on grasslands in the temperate continental, high-cold Tibetan Plateau, and temperate monsoonal climatic regions, contributing −55 ± 4% and −50 ± 12% to the increase in China's vegetation and soil carbon, respectively (figures 3(c) and (d)).
4. Discussion
4.1. Magnitude of China's vegetation and soil carbon stocks and sinks
The ensemble average of the CMIP6 simulations revealed that China's vegetation and soil carbon stocks will increase from 2015 to 2060 under the SSP126 scenario, and the magnitude of vegetation and soil carbon sinks were approximately consistent among most ESMs of CMIP6 (supplementary table 3). Furthermore, the ensemble average of the vegetation carbon sink of the nine models in the 1990s (0.049 ± 0.009; table 2) was similar to that of the process-based model of Cao et al (2003) but lower than that of the Ground survey during the same period (Fang et al 2007, 2018). The soil carbon sink (table 2) was close to that of the inventory-satellite-based estimation and process-based models of Piao et al (2009) in the same period. Moreover, the ratios (1.258 ± 0.585–1.443 ± 0.459) of vegetation to soil carbon sinks in China of CMIP6 during 1990–2010 were consistent with most studies (table 2, Piao et al 2009, Jiang et al 2016, Fang et al 2018). Furthermore, the CMIP6 simulations revealed that the Ratiosink will increase to 2.344 ± 2.227 in 2015–2020 and 4.776 ± 2.300 in 2055–2060, indicating an enhancement in vegetation carbon sinks, with a magnitude of approximately 0.209 ± 0.031 PgC yr−1 by 2060 (table 2). Additionally, the CMIP6-based vegetation and soil carbon sinks in China during 2015–2060 were lower than those reported by Huang et al (2022) and Cai et al (2022), which may be caused by the following reasons. On the one hand, several parameter-sparse empirical models do not take into account nutrient limitations and carbon losses caused by climate change, especially extreme climates, compared with ESMs of CMIP6. On the other hand, carbon sinks are generally lower under the SSP126 scenario with low forcing used in this study than under the SSP245 and SSP585 scenarios with high forcing (Cai et al 2022, Huang et al 2022).
Table 2. Comparisons with the magnitude of China's vegetation and soil carbon sinks in previous studies.
| Methods | cVeg sink (PgC yr−1) | cSoil sink (PgC yr−1) | (cVeg sink + cSoil sink) or NEP | Ratiosink | Period | References |
|---|---|---|---|---|---|---|
| CMIP6 mean | –0.150 ± 0.020 | 0.059 ± 0.015 | –0.094 ± 0.029 | –2.688 ± 1.339 | 1980–1989 | In this study |
| CMIP6 mean | 0.049 ± 0.009 | 0.039 ± 0.014 | 0.089 ± 0.019 | 1.258 ± 0.585 | 1990–1999 | In this study |
| CMIP6 mean | 0.048 ± 0.012 | 0.034 ± 0.013 | 0.082 ± 0.021 | 1.443 ± 0.459 | 2000–2009 | In this study |
| CMIP6 mean | 0.081 ± 0.027 | 0.034 ± 0.014 | 0.115 ± 0.016 | 2.344 ± 2.227 | 2015–2020 | In this study |
| CMIP6 mean | 0.209 ± 0.031 | 0.044 ± 0.010 | 0.252 ± 0.029 | 4.776 ± 2.300 | 2055–2060 | In this study |
| Inventory-satellite-based estimation | 0.105 | 0.075 | 0.180 | 1.393 | 1982–1999 | Piao et al (2009) |
| Ground survey | 0.096–0.106 | 0.04–0.07 | 0.136–0.176 | 1.51–2.4 | 1981–2000 | Fang et al (2007) |
| Ground survey | 0.119 | 0.073 | 0.192 | 1.645 | 2001–2010 | Fang et al (2018) |
| Process-based model | 0.092 | 0.075 | 0.167 | 1.227 | 1980–2002 | Piao et al (2009) |
| Process-based model | 0.040 | 0.022 | 0.062 | 1.818 | 1981–2000 | Cao et al (2003) |
| Process-based model | 0.170 | 0.120 | 0.290 | 1.417 | 2000s | Jiang et al (2016) |
| Process-based model | — | — | 0.118 ± 0.079 | — | 1982–2010 | He et al (2019) |
| Ground survey + Literature data | — | 0.101 | — | — | 1980s–2010s | Xu et al (2019) |
cVeg sink and cSoil sink denote vegetation and soil carbon sinks, respectively. Ratiosink is the ratio of vegetation to soil carbon sinks. a In the rows of 'CMIP6 mean', the ensemble average ± standard error of the simulations between the nine ESMs is shown.
However, China's vegetation carbon stock in CMIP6 was higher than that in previous studies (table 3), especially in the ACCESS-ESM1-5 model (supplementary table 3), with magnitudes of 25 ± 2 PgC during 1980s, 24 ± 2 PgC during 1990s, and 25 ± 2 PgC during 2000s (table 3), whereas that in the ground survey and process-based model was only 13–15 PgC in previous decades (table 3, Li et al 2004, Xu et al 2018). Compared with vegetation, the soil carbon estimation from CMIP6 (around 111–112 PgC) during 1980–2010 was relatively reasonable, although slightly higher than that in previous studies (75–90 PgC, Xie et al 2007, Tang et al 2018), because the soil depth of ESMs in CMIP6 was greater than the 1 m depth commonly used in these studies (table 1). However, the uncertainty of soil carbon size among ESMs was large, for example, the China's soil carbon in CMCC-CM2-SR5 or CMCC-ESM2 model was seven times higher than that in the IPSL-CM6A-LR model (supplementary table 3). Conclusively, vegetation carbon sinks of the CMIP6 ESMs were higher than soil carbon sinks, and the ratio of vegetation to soil carbon sinks will continue to increase in the future, although estimates of vegetation carbon stocks were higher than previous studies over the same period. Therefore, the prior calibration of the carbon pool size using the uniformly standardized vegetation and soil carbon data from ground surveys is necessary before biogeochemical model simulation in China. Initial calibration can also improve the representation of the processes related to vegetation and soil carbon changes, such as turnover loss of carbon pool (Koven et al 2013, Wu et al 2019, Boucher et al 2020, Ziehn et al 2020).
Table 3. Comparisons with the magnitude of China's vegetation and soil carbon stocks in previous studies.
| Methods | cVeg (PgC) | cSoil (PgC) | cVeg + cSoil | Ratiostock | Period | References |
|---|---|---|---|---|---|---|
| CMIP6 mean | 25 ± 2 | 111 ± 22 | 136 ± 22 | 0.225 ± 0.050 | 1980–1989 | In this study |
| CMIP6 mean | 24 ± 2 | 112 ± 22 | 136 ± 22 | 0.219 ± 0.048 | 1990–1999 | In this study |
| CMIP6 mean | 25 ± 2 | 112 ± 22 | 137 ± 22 | 0.222 ± 0.047 | 2000–2009 | In this study |
| CMIP6 mean | 26 ± 2 | 113 ± 22 | 138 ± 22 | 0.228 ± 0.047 | 2015–2020 | In this study |
| CMIP6 mean | 33 ± 3 | 114 ± 22 | 147 ± 22 | 0.290 ± 0.060 | 2055–2060 | In this study |
| Ground survey | 14.29 | 74.98 | 89.27 | 0.191 | 2010–2015 | Tang et al (2018) |
| Ground survey + literature data | 14.60 | 84.55 | 99.15 | 0.173 | 2004–2014 | Xu et al (2018) |
| Process-based model | 13.33 | 82.65 | 95.98 | 0.161 | — | Li et al (2004) |
| Process-based model | 13.74 | 82.77 | 96.51 | 0.166 | 1981–2000 | Ji et al (2008) |
| Ground survey | — | 89.61 | — | — | Early 1980s | Xie et al (2007) |
| Ground survey | — | 89.14 | — | — | — | Yu et al (2007) |
| Ground survey | — | 69.10 | — | — | — | Yang et al (2007) |
cVeg and cSoil denote vegetation and soil carbon stocks, respectively. Ratiostock is the ratio of vegetation to soil carbon stocks. a In the rows of 'CMIP6 mean', the ensemble average ± standard error of the simulations between the nine ESMs is shown.
4.2. Influencing factors of changes in China's vegetation and soil carbon stocks in the future
Increases in China's vegetation and soil carbon are mainly affected by the combined effects of increased forest coverage and CO2 concentrations from 2015 to 2060 under the SSP126 scenario, with regional differences. Increased forest coverage will promote a greater increase in vegetation carbon stocks than that soil carbon stocks in the subtropical-tropical and temperate monsoonal climatic regions because of the difference in response coefficients to an increase in forest coverage. Similarly, a previous study reported that ecological restoration projects such as afforestation contributed more than half of the contribution to the enhancement of China's carbon stocks in project areas (Lu et al 2018). Moreover, the two monsoonal climatic regions are appropriate for potential afforestation (Zhang et al 2021). CO2 had an effect equivalent to forest coverage in two monsoonal climatic regions but has a weaker contribution in the high-cold Tibetan Plateau with a high soil carbon sequestration potential as indicated by the relatively low Ratiosink. However, grassland encroachment by bare land will weaken the increases in vegetation and soil carbon stocks in the high-cold Tibetan Plateau and temperate monsoonal climatic regions, which has experienced significant grassland degradation over the past few decades (Bardgett et al 2021). These results imply that afforestation in monsoon regions and grassland protection in the high-cold Tibetan Plateau and temperate monsoonal climatic regions need to be strengthened to increase carbon sinks in the future.
4.3. Contribution of China's vegetation and soil carbon sinks to offset anthropogenic CO2 emissions under various scenarios
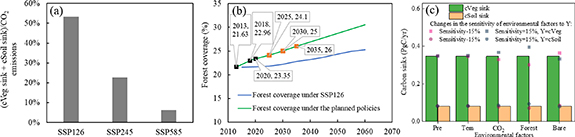
Compared with the SSP245 (23%) and SSP585 (6%) scenarios, the contribution of vegetation and soil to the absorption of anthropogenic CO2 emissions (0.61 PgC yr−1; supplementary figure 12) was the greatest in 2060 under the SSP126 scenario (53%; figure 4(a)), and the total carbon sequestration rate of vegetation and soil was 0.33 ± 0.07 PgC yr−1.
Figure 4. Vegetation and soil carbon sinks and CO2 emissions in China. (a) Percentage of total CO2 emissions absorbed by vegetation and soil in 2060 under the SSP126, SSP245, and SSP585 scenarios; (b) forest coverage under the SSP126 scenario and planned policies; and (c) vegetation and soil carbon sinks under the planned forest coverage in China. Forest coverages under the planned policies were linearly interpolated from historical values (black dots) and planned values (orange dots) in figure (b). Among them, the actual forest coverage data (black dots) in 2013 and 2018 were obtained from the eighth and ninth national forest inventories, respectively, and the actual forest coverage in 2020 was obtained from the Fourteenth Five-Year Plan for National Economic and Social Development of the People's Republic of China and the Outline of Long-Term Goals for 2035 (Central People's Government of the People's Republic of China 2021a). The planned values of forest coverage in 2025, 2030, and 2035 were derived from some policy documents (National Development and orm Commission of the People's Republic of China 2020, Central People's Government of the People's Republic of China 2021a, 2021b). Given that the growth rate of planned forest coverage is relatively stable, we linearly extrapolated the planned forest coverage during 2035–2060 using trends over the past two decades. The planned forest coverage is less than the potential forest coverage in China reported by Zhang et al (2021). The green and orange columns in figure (c) are the predicted vegetation and soil carbon sinks in China under the forest coverage of the planned policies, respectively, assuming constant sensitivities (i.e. the response coefficients of carbon stocks to environmental factors in this study). The pink and blue-gray dots on each environmental factor (x-axis) represent the vegetation (squares) or soil carbon (circles) sinks under a 15% decrease and increase in the sensitivity of carbon stocks to this factor (the sensitivity of other environmental factors is unchanged), respectively.
Download figure:
Standard image High-resolution image
China's actual forest coverage was 23.2% in 2020 (Central People's Government of the People's Republic of China 2021a), and the Chinese government has set a phased target to increase forest coverage (24.1% in 2025; 25% in 2030; and 26% in 2035) (National Development and orm Commission of the People's Republic of China 2020, Central People's Government of the People's Republic of China 2021a, 2021b). Assuming that the response coefficients of vegetation and soil carbon stocks to individual factors remain unchanged (or changed within ±15%), the total carbon sink potential in China will reach 0.42 PgC yr−1 (0.37–0.48 PgC yr−1) in 2060 under the planned policies (figures 4(b) and (c)), which can absorb approximately 69% (60%–79%) of the projected anthropogenic CO2 emissions from China in 2060. Note that we only provided a potential vegetation and soil carbon sink in the future using China's average forest coverage of the planned policies. However, the unknown spatial location of these afforestation sites may introduce uncertainty into the predicted carbon sinks. Based on the increased forest map of LUH2 (supplementary figure 3(a)), modeling carbon sinks in different spatial distribution schemes of afforestation is needed in future work, which may bring additional carbon sink increments over the SSP126 scenario.
Therefore, China's ecosystem will generate a major carbon sink under China's planned policies. This can contribute to the achievement of China's carbon neutrality goal by 2060. Additionally, it provides strong support and broad implications for carbon sink improvement and net-zero emission achievement globally.
4.4. Uncertainty and limitations
There were large differences in China's soil carbon between the nine ESMs analyzed in this study, with a maximum (227 PgC) in the CMCC-ESM2 model and a minimum (32 PgC) in the IPSL-CM6A-LR models, respectively (supplementary table 3), both of which deviated greatly from the results of the Ground survey (table 3). Although the magnitudes of China's vegetation carbon were similar among most ESMs (BCC-CSM2-MR, CanESM5, CESM2-WACCM, CMCC-CM2-SR5, CMCC-ESM2, NorESM2-LM, MPI-ESM1-2-LR), which was much higher than the results of the ground survey (table 3). Fortunately, the uncertainty of vegetation carbon sinks among the nine ESMs was small, and soil carbon sinks were similar among most ESMs (supplementary table 3). Moreover, changes in vegetation and soil carbon stocks were positive for all ESMs (supplementary table 3), which improved the confidence of our results. Nonetheless, the effects of the high uncertainty in the magnitude of soil carbon between the models and the relatively high vegetation carbon on the carbon cycle are unclear and need to be assessed in future work.
In this study, we used multiple linear regression to analyze the responses of vegetation and soil carbon to precipitation, air temperature, and CO2, as well as land use change, but did not consider the nonlinear effects of multiple factors. Actually, the interaction between these factors has an impact on carbon dynamics (Garten et al 2009, Wolf et al 2011, Sui et al 2013). Although we have modeled differential responses across four climatic regions, this rough consideration of interactions between climatic conditions and environmental factors may not be sufficient. An in-depth analysis of the impact of nonlinear relationships between different factors on the carbon cycle is required in the future.
5. Conclusion
Changes in vegetation and soil carbon stocks and their ratios and drivers in China were assessed under the SSP126 scenario from 2015 to 2060 using the ensemble average of simulations from nine ESMs in CMIP6. Results presented a lower vegetation carbon stock than soil carbon stock, with the Ratiostock being high in the southeast and low in the northwest. In contrast, vegetation carbon increased more than soil carbon during the period, with the highest Ratiosink in subtropical-tropical and temperate monsoonal climatic regions mainly because of increased forest coverage and CO2 concentrations. Conversely, Ratiosink was low in the other two climatic regions. Moreover, bare land encroachment on grassland decreased the vegetation and soil carbon stocks. Additionally, under the SSP126 scenario with deep reductions in CO2 emissions, the vegetation and soil carbon sinks will show an increasing trend and absorb the most carbon emissions in 2060, when compared with the SSP245 and SSP585 scenarios, at approximately half of the total anthropogenic carbon emissions. Exceptionally, under the afforestation scenario planned by China's policies, vegetation and soil carbon sinks may offset 69% of carbon emissions. Therefore, afforestation in monsoonal regions and the protection of grasslands are recommended to improve carbon sinks, and deep reductions in fossil fuel emissions are also necessary, providing a basis for adjusting the response of vegetation and soil carbon stocks to environmental factors and achieving net-zero emissions.
Acknowledgment
This work was funded by the National Natural Science Foundation of China (42141005).
Data availability statement
The data that support the findings of this study are openly available at the following URL/DOI: https://esgf-node.llnl.gov/search/cmip6/, https://esgf-node.llnl.gov/search/input4mips/, and https://luh.umd.edu/data.shtml.
Supplementary data (2.3 MB PDF)