

Abstract
Underlying policy efforts to address global climate change is the scientific need to develop the methods to accurately measure and model carbon stocks and fluxes across the wide range of spatial and temporal scales in the Earth system. Initiated in 2010, the NASA Carbon Monitoring System is one of the most ambitious relevant science initiatives to date, exploiting the satellite remote sensing resources, computational capabilities, scientific knowledge, airborne science capabilities, and end-to-end system expertise that are major strengths of the NASA Earth Science program. Here we provide a synthesis of 'Phase 2' activities (2011–2019), encompassing 79 projects, 482 publications, and 136 data products. Our synthesis addresses four key questions: What has been attempted? What major results have been obtained? What major gaps and uncertainties remain? and What are the recommended next steps? Through this review, we take stock of what has been accomplished and identify future priorities toward meeting the nation's needs for carbon monitoring reporting and verification.
Export citation and abstract BibTeX RIS

Original content from this work may be used under the terms of the Creative Commons Attribution 4.0 license. Any further distribution of this work must maintain attribution to the author(s) and the title of the work, journal citation and DOI.
1. Introduction
Anthropogenic emissions of greenhouse gasses are the highest in history, and changes in the Earth's climate are having widespread impacts on both natural and human systems. In response, local, state, national, and international policies are in discussion and under development to reduce greenhouse gas emissions in the future. Foundational to these efforts is the scientific ability to accurately measure, and model, carbon stocks and fluxes throughout the Earth system and across a range spatial and temporal scales.
Initiated in 2010, a congressional appropriation directed NASA to initiate work towards a carbon monitoring system (CMS) and provided specific guidance. The approach NASA developed in following these directions emphasized exploitation of the satellite remote sensing resources, scientific knowledge, and end-to-end system expertise that are major strengths of the NASA Earth Science program. The approach also took into account data and expertise that are the domain of other U.S. Government agencies and anticipates close communications and/or partnerships with those agencies and their scientific and technical experts. Additionally, it laid the groundwork for CMS-related applications of current and future satellite sensors.
In Phase 1 (2010–2012), NASA's CMS activities were directed through NASA centers and involved two pilot studies and two scoping efforts (Hurtt et al 2014a). The Biomass Pilot focused on quantifying the terrestrial vegetation aboveground carbon stock using consistent approaches and performing uncertainty analyses on its magnitude and spatial distribution. The initial emphasis was on production and evaluation of both local and U.S.-wide biomass products. The Flux Pilot produced an integrated emission/uptake product through a combination of space-based measurements of atmospheric carbon dioxide, carbon cycle models and assimilation systems, and information about the processes that couple the surface to the atmosphere. Scoping studies focused on quantifying carbon in the oceans and the potential of NASA products to meet policy and decision-making requirements. In addition, more than a dozen Science Definition Team Projects were carried out. This work was synthesized in the Phase 1 Report (Hurtt et al 2014a).
In Phase 2 (2011–2016), consistent with Congressional direction, NASA took steps to ensure substantial external (i.e. non-government) participation in CMS research by requiring individual projects to have greater than 50% of their funding directed to activities within external organizations. New projects were competitively selected to build upon initial efforts, with a large expansion in prototyping activities across a diversity of systems, scales, and regions, including research focused on prototype monitoring, reporting, and verification (MRV) systems for specific carbon management projects. In 2013, studies were added to advance MRV-relevant studies in support of reducing emissions from deforestation and degradation (REDD) and REDD+ projects, and the U.S. SilvaCarbon program, using commercial off-the-shelf technologies. Selections in 2014 included studies to improve the CMS biomass and flux products and to conduct new MRV-relevant projects at local to regional scales, including several state-level biomass mapping projects within the U.S. and projects to quantify carbon in coastal ecosystems relevant to 'blue carbon' objectives of reducing carbon emissions by conserving and sustainably managing a coastal carbon sink. In 2014, a congressionally mandated report documented NASA's approach to MRV (Hurtt et al 2014b). The report summarized progress to date within the Caron Monitoring System project and described NASA's longer term strategy for CMS and its vision regarding NASA's role in MRV. In 2015 and 2016, project selections continued to advance biomass mapping efforts, flux quantification, and blue carbon mapping. Throughout, work was conducted to improve the characterization of errors and uncertainties in existing products and to engage stakeholders, identify their needs, and seek inputs on the value of CMS prototype products.
In all, during Phase 2 NASA supported 79 projects prototyping carbon monitoring activities around the world, in every major component of the Earth system, and linked to a diverse set of stakeholders and applications across a variety of domains. The effort represents one of the largest and most ambitious collections of applied carbon monitoring research created around the world. The goal of this paper is to synthesize the results from all completed Phase 2 projects into summary findings relevant to the program and the broader scientific community.
2. Methods
The scope of this report includes all CMS Phase 2 projects, publications, and archived data products as of August 2021. This included all projects initiated between 2011 and 2016 and completed as of this report.
To conduct the synthesis, we reviewed the CMS products hierarchically first within theme, then by theme, and finally at the initiative level (figure 1). More specifically, we collected a comprehensive set of all projects and their resulting publications and archived datasets and stakeholders (figure 2). To organize the analysis, each project, publication, and data product was assigned a primary theme based on the science being completed. Primary themes included: land biomass, atmospheric flux and methane, stakeholder, and oceans/wet carbon. For each product, we also analyzed important metrics including domain, resolution, citation, downloads, and application readiness level (ARL).
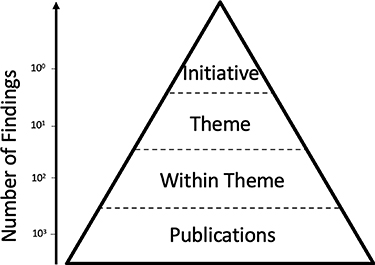
Figure 1. Conceptual diagram for synthesis of findings at multiple levels of organization. Results from publications can be aggregated by theme, which in turn can be aggregated to the initiative level.
Download figure:
Standard image High-resolution image
Figure 2. Summary of methods used to create CMS synthesis findings described in this paper.
Download figure:
Standard image High-resolution imageARL is an index adapted from the NASA technology readiness levels in order to track and guide application efforts of NASA funded projects such as those under the CMS program. The levels range from 1–basic science to 9–in mature and in operational use. These levels are used as a communication tool to give a clear picture of the current and projected 'readiness' of each CMS projects' involvement in decision-making and operational platforms. Products are assigned ARLs by the principal investigator annually and change as the products mature and are used in different ways by stakeholders. We measure the change in product maturity by comparing the ARL at the start of the project to those at the end.
A subset of experts was then assigned to each of the primary themes to review the products in that theme and developed detailed findings centered around four key questions:
- What have NASA-CMS projects attempted in Phase 2?
- What major results and findings have been made?
- What major gaps and uncertainties remain?
- What are the recommended next steps?
The findings were then further aggregated to initiative level. Finally, feedback was sought from the community during sessions at the CMS Science Team Meeting in November 2019 and at the AGU Fall Meeting in December 2019.
3. Results
First, a series of quantitative summary metrics were calculated to describe CMS projects, and products. These metrics are presented below.
3.1. Summary metrics
In total, CMS Phase 2 consisted of 79 projects, and resulted in 482 publications and 136 data products (table 1). Biomass represented the largest theme, with 37 projects, 252 publications and 59 archived data products. Atmosphere flux was second largest and had 33 projects, with 164 publications and 60 data products. Wet carbon/ocean had 7 projects, 63 publications and 17 data products. Stakeholder has 2 projects, 3 publications, and no data products.
Table 1. CMS Phase 2 projects, publications, and data products.
| Theme | Sub-theme | Number of projects | Number of publications | Number of archived data products |
|---|---|---|---|---|
| Biomass | Land biomass | 37 | 252 | 59 |
| Atmosphere/Flux | Global-surface atmosphere flux | 33 | 164 | 60 |
| Land-atmosphere flux | ||||
| Methane | ||||
| Ocean | Ocean biomass | 7 | 63 | 17 |
| Ocean-atmosphere flux | ||||
| Land-ocean flux | ||||
| Stakeholder | Decision support | 2 | 3 | N/A |
| MRV | ||||
| Total: | 79 | 482 | 136 | |
Projects covered a wide range of geographic domains (figure 3). There were 22 projects with a global domain. Additional regional projects increased the total number of projects unevenly in different areas around the world. In Southeast Asia, Indonesia, South Africa, and South America an additional 1–5 regional projects produced a total for those regions of 23–27. The highest concentration of projects was focused on North America with 29 total projects and the U.S. with 39 total projects.

Figure 3. Number of CMS Phase 2 projects by geographic domain. There are 22 global projects and additional projects in various countries.
Download figure:
Standard image High-resolution imageArchived data products provide a more detailed measure of data availability around the world (figure 4). Similar to the project level map, the data product coverage is uneven around the world and has the highest concentration over North America and the U.S. Additional product coverage over S. Africa, China, and India were primarily more local in focus. Investigating these patterns further, there were significant differences between Biomass and Flux products in terms of coverage (tables S1–S3 (available online at stacks.iop.org/ERL/17/063010/mmedia)). Flux products tended to represent a larger domain, with 50% (30/60) providing global coverage and fewer at all smaller domains including 17% (10/60) local. In contrast, Biomass products tended to represent smaller areas, with 46% (27/59) local, and only 8% (5/59) global. Likewise, ocean/wet carbon products tended to be even more clustered in small domains, with 88% (15/17) at local or subnational scale, and 12% (2/17) global.
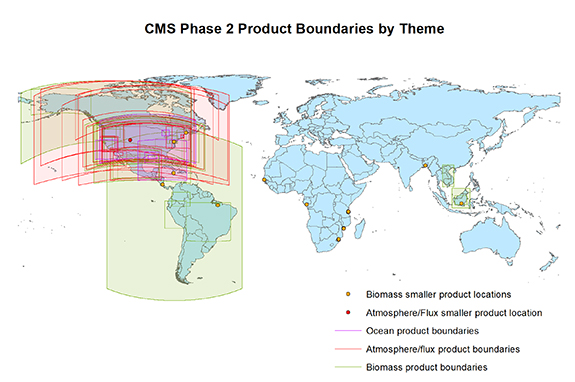
Figure 4. Number of CMS Phase 2 products (local and regional scale) by geographic domain and theme. ** Two projects with geographic domains of Southern Africa, and India and China produced no products for those regions.
Download figure:
Standard image High-resolution imageSpatial resolution varied by domain size and by theme (figure 5, table S4). Flux products tended to have relatively coarse resolution with 82% (49/60) >1 km. Biomass products tended to have higher spatial resolution with 83% (49/59) ⩽1 km. As expected, there was generally an inverse relationship between domain size and spatial resolution consistent with these differences, with local scale products (e.g. biomass) tended to have higher spatial resolution, and larger domain products (e.g. flux) tended to have coarser resolution.

Figure 5. Spatial domain and resolution (m) of CMS Phase 2 products.
Download figure:
Standard image High-resolution imageThe temporal domain of products varied and spanned a range of pre-1960 to post-2060 (figure 6). The majority of products were focused on the recent past, with 82% (111/136) of CMS products covering the period 2000–2020, 15% (21/136) extending pre-2000, and 3% (4/136) of products extending post-2020. Biomass had 75% (44/59) covering the period 2000–2020, 24% (14/59) products extending pre-2000 and 2% (1/59) post-2020. Flux had 85% (51/60) covering 2000–2020, 12% (7/60) products extending pre-2000, and 3% (2/60) post-2020.
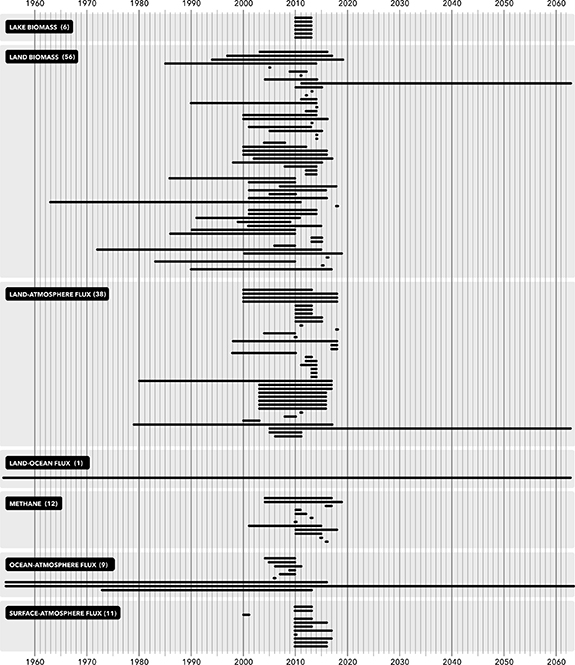
Figure 6. NASA-CMS Phase 2 projects by time domain.
Download figure:
Standard image High-resolution imageThe distribution of ARL and ARL change was calculated for Phase 2 products as a measure of application readiness and change in application readiness (figure 7, table S5). The distribution of ARL values followed a modal distribution, with the most common ARL values in the intermediate range of 5–6 (51), and many fewer examples at beginning ARL 1–2 (11), or most mature status ARL 8–9 (15). All products experienced maturation during the period of development. The distribution of ARL change (Final ARL–Initial ARL) followed a decreasing function, with the largest category of projects increasing 1 ARL value and steadily declining to those advancing a full 8 ARL values over the project.
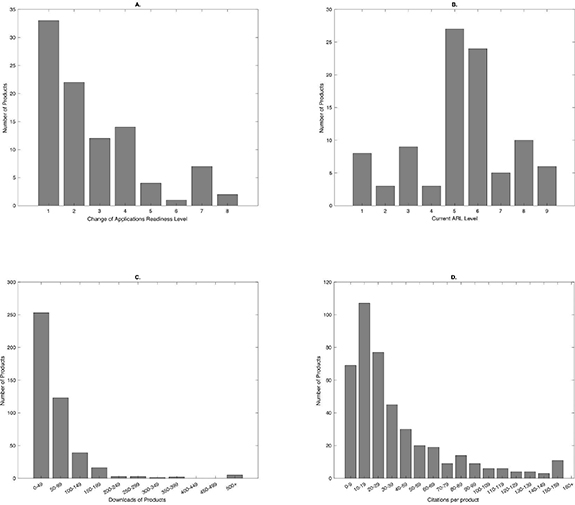
Figure 7. Product metrics. (A) ARL change, (B) ARL current, (C) downloads, (D) citations 2011–2018.
Download figure:
Standard image High-resolution imageStakeholders are defined as users actively engaged in CMS science projects. There were 132 different stakeholders working with CMS scientists in Phase 2 representing different types of organizations, science themes, and nationalities (figure 8). CMS projects engaged stakeholders from a wide variety of organizational types, with the most common types being Federal Government (15%), Company (15%), Non-Governmental Organization (15%), State Government (14%) and University (14%). Additional stakeholders represented Local government (6%), Research Institutes (6%), Intergovernmental Organizations (3%), Media (2%), Museums (1%) and Other (9%). Stakeholders also represented different science themes, with Biomass accounting for 53%, and Flux 30%, and MRV 17%. Stakeholders also represented different nationalities, with U.S. 73%, and followed by a variety of other countries each ⩽5%.
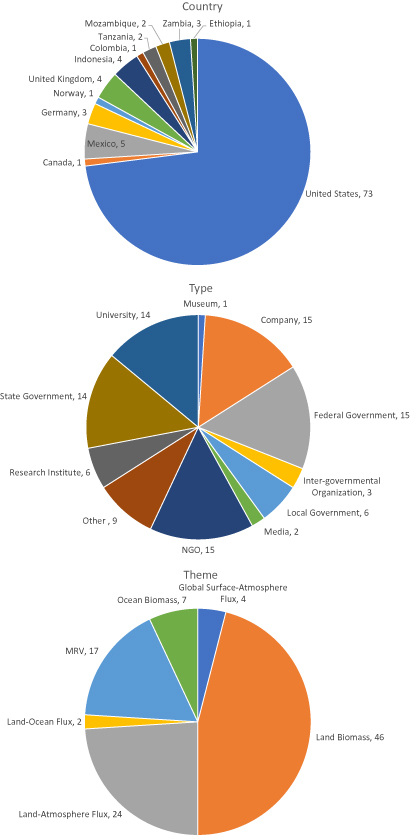
Figure 8. CMS stakeholders by type, theme, an country.
Download figure:
Standard image High-resolution image3.2. Thematic
Qualitative results were synthesized at the thematic level. These results are presented below and in table form in supplementary material (tables S6–S11).
3.2.1. Biomass
Tracking plant biomass in terrestrial ecosystems is an essential component of CMSs. Biomass has been a focus of the NASA CMS since the program's inception, and many CMS projects have advanced our understanding of methods to map, track changes over time, characterize uncertainties in biomass estimates and project future storage potential. In addition, from these results CMS projects have been able to improve our understanding of the controls on biomass accumulation and loss in natural and managed systems.
Methodologically, CMS projects have shown that biomass mapping is achievable at multiple scales, and that such mapping is defensible in the context of MRV and international carbon programs such as REDD+. Mapping is possible through a combination of lidar, optical data, radar data, forest inventory data, and emerging statistical and machine learning methods (Junttila et al 2013, Tyukavina et al 2013, Montesano et al 2013, Zhang et al 2014, Potapov et al 2014, Lagomasino et al 2015, Babcock et al 2015, Duncanson et al 2015, Huang et al 2015, Gu et al 2016, Babcock et al 2016, Swatantran et al 2016, Deo et al 2016, 2017, Huang et al 2017, Treuhaft et al 2017, Fekety et al 2018, Babcock et al 2018, Thomas et al 2018, Rappaport et al 2018, Saarela et al 2018, Xu et al 2018, Kennedy et al 2018, Alonzo et al 2018, Huang et al 2019, Simard et al 2019, Patterson et al 2019, Bullock et al 2020, Arevelo et al 2020). In particular, many CMS projects have advanced the statistical tools needed to make such mapping defensible (Montesano et al 2013, Finley et al 2013, 2014, Cooke et al 2016, Datta et al 2016, Reimer et al 2016, Finley et al 2017, Babcock et al 2018, Saarela et al 2018, Patterson et al 2019, Olofsson et al 2020). Importantly, these new methods are also highly generalizable and can also provide quantitative assessments of product uncertainties. In addition, the work has been conducted across a range of diverse ecosystems and are applicable to new space-borne lidar missions such as GEDI (Healey et al 2012, Duncanson et al 2019, Patterson et al 2019).
CMS studies have also contributed significantly to our understanding of the patterns of biomass, drivers of biomass change, and storage potential in vegetation and the soil. For example, human-caused forest disturbance (deforestation and degradation) remains the key driver of biomass and carbon loss in temperate and tropical forest systems, with fire, climate, and longer-duration stressors (drought, insect pests) playing an important role in some systems (e.g. boreal, savanna, peatland) (French et al 2014, Morton 2016, Longo et al 2016, Cohen et al 2016, Baccini et al 2017, Noojipady et al 2017, Rappaport et al 2018, Rangel Pinage et al 2019, Li et al 2020, Tang et al 2020). There is evidence of recent diminishment of fire in regions of low- to intermediate-forest cover, perhaps because of transitions in human management associated with economic development and increase in closed canopy forests (Andela et al 2017). In global drylands systems, there is a strong link between precipitation and the rate and timing of carbon uptake and storage, but which is also mediated by plant adaptation strategies, including higher than expected investment in leaf-level photosynthetic machinery in global drylands ecosystems, with possibly important implications for response to climate change (Biederman et al 2016, 2017, Hinojo-Hinojo et al 2018). At the same time, increasing prevalence of prolonged drought periods may significantly outweigh any mediation by plant adaptation strategies leading to a chronic reduction in vegetation biomass in dryland systems, including the western U.S. Studies utilizing mechanistic ecosystem modeling have leveraged the high resolution lidar and optical data to move beyond traditional MRV and map both current stocks and future storage potentials for use in planning scenarios (Hurtt et al 2019, Ma et al 2021a; figure 9). The most recent results from these products are in active use in state-level carbon inventories and climate mitigation planning.

Figure 9. Example framework for utilizing lidar and optical remote sensing data together with field data to map above ground biomass, and model future carbon sequestration potential (Huang et al 2015, Huang et al 2017, Huang et al 2019, Hurtt et al 2019, Tang et al 2021, Ma et al 2021a).
Download figure:
Standard image High-resolution imageDespite these advances, gaps remain. Major areas of the world, including a diversity of different ecosystems, disturbance regimes, land-use activities, etc have yet to be mapped or modeled or validated at high spatial resolution. Research has identified that a key bottleneck and source of uncertainty in gridded products is accurate quantification and application of the allometric equations needed to create and scale-up reliable biomass reference data (Xu et al 2018). Additionally, approaches to scale-up established methods to continental and global domains are needed. While the separate mapping of biomass and biomass change from disturbance has been successful, a more coordinated effort is needed to help reconcile issues related to biomass and disturbance loss and recovery in space and/or time. The spatial resolution and temporal mismatch in biomass and disturbance mapping efforts complicates the fusion of these datasets to inform C management, including adequately capturing uncertainties related to these isolated mapping efforts. In addition, a major challenge for the mapping of biomass in some high-latitude or tropical regions, is the general lack of suitable measurements needed to train upscaling approaches. This includes both the training data (e.g. measurements of plant height, structure, biomass) themselves and also the remote sensing observations needed for scaling and creating the maps. Finally, despite better inclusion of methodological uncertainties in estimation, it is unclear how to advise practitioners when uncertainties from different sources disagree.
From these findings, challenges, and knowledge gaps, several important next steps emerge. Efforts must continue to expand biomass mapping over broad (continental to global) domains at a fine spatial resolution (appropriate to capture variability in both natural patterning and in human interventions that drive change) and linked to models for attribution of changes and future projections needed for planning. Validation frameworks are needed to assess accuracy at a variety of scales against high-quality reference data (e.g. Menlove and Healey 2020). In addition, clear protocols for the collection of measurements to use with biomass mapping (including clearly defining how to incorporate measurement uncertainties into scaling efforts) need to be provided to influence how large-scale measurements efforts (e.g. FIA) develop the essential datasets used for biomass accounting. While the goals for MRV are defensible, broad-scale biomass estimates and novel approaches should continue to be explored to help understand the influence of fine-scale variation on scaling efforts and how fine-scale patterns influence larger scale, but more coarse resolution, mapping efforts. These include the continued use of detailed in-situ measurements and validation of allometry using lidar tools (e.g. Xu et al 2018), as well as the incorporation of other novel platforms such as unoccupied aerial systems (Alonzo et al 2020) to provide both fine-scale, targeted (e.g. using UAS to fill in critical observation gaps) and spatially-extensive information on plant structure and biomass to inform scaling approaches or validate other products. Similarly, the temporal cadence of biomass mapping should increase to improve our understanding of biomass change, thus allowing better attribution of changes to drivers. At the same time, a tighter coupling of efforts between biomass and disturbance mapping should be explored as this will be essential for increasing the temporal frequency of biomass estimates and also ensure landscape changes are correctly accounted for. The incorporation of more model-driven biomass upscaling should also be considered, which would allow for the fusion of observation data and process models to infer biomass state based on measurements and mechanistic modeling of plant growth (Fer et al 2018). In general, these improved maps of change must continue to be better integrated into process-based models and with tower-based flux observations. Throughout all of these steps, clearer definitions of product uncertainties are needed, particularly relative to the types of factors included within uncertainty estimates for different products.
3.2.2. Flux
Flux activities in CMS Phase 2 focused on developing new methods for estimating carbon fluxes, characterizing key sources of uncertainty, and deploying new measurements to support flux evaluation. CMS flux products represent both bottom-up (e.g. process models, inventories combined with land surface remote sensing data) and top-down (atmospheric inversion) approaches. CMS investigators have developed multiple observationally constrained bottom-up estimates of the major flows of carbon including fossil fuel (Asefi et al 2014, Gately and Hutyra 2017, Oda et al 2018) and fire emissions (Andela et al 2019) and land (Hardiman et al 2017, Weir et al 2021a) and ocean (Brix et al 2015, Gregg et al 2017, Carroll et al 2020) carbon flux. They have also improved inverse methods that use atmospheric observations to infer surface sources and sinks with a focus on attributing net flux to underlying processes at both regional (Fischer et al 2017, Graven et al 2018, Hu et al 2019) and global (Liu et al 2017, Wang et al 2018) scales (figure 10). Phase 2 projects also improved characterization of major sources of uncertainty including atmospheric transport model errors (Brophy et al 2019, Diaz-Isaac et al 2019, Butler et al 2020) and deployed both ground-based (Fischer et al 2017, Graven et al 2018) and aircraft measurements (Wolfe et al 2018, Hannun et al 2020) to validate local to regional scale flux estimates. CMS Phase 2 also included the first project designed to evaluate the consistency and completeness of CMS products for estimating global and regional carbon budgets.
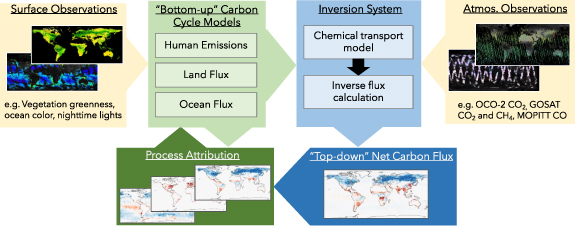
Figure 10. Carbon cycle inversion models, which infer surface-atmosphere flux from atmospheric measurements, have been a central component of CMS. Satellite observations of surface properties (e.g. ocean color, land surface reflectance, nighttime lights, fire radiative power) are used as input to data-driven models that provide a prior estimate of flux. These fluxes are transported through the atmosphere by chemistry and transport models. Atmospheric observations of CO2 and other species are ingested by inverse models, which compute a posterior estimate of net flux. This suite of modeling tools can be used to attribute corrected carbon flux to specific processes including both human emissions and terrestrial and ocean exchange.
Download figure:
Standard image High-resolution imageCMS projects yielded a diverse set of results that represent an increased understanding of both anthropogenic and natural flux processes. These findings show that global inverse models that incorporate satellite CO2 observations are able to reduce flux uncertainty and quantify the relative distribution of regional net fluxes (Liu et al 2014, Wang et al 2020). When combined with other types of observations (e.g. shorter-lived trace gasses, indicators of vegetation productivity), such models can provide additional information about specific flux processes including respiration, gross primary production, and fire emissions (e.g. Liu et al 2017, Konings et al 2019, Magney et al 2019). Multiple studies focused on quantifying the impact of El Nino events on atmospheric CO2 and on understanding the regional mechanisms that control these changes in the tropics (Bowman et al 2017, Chen et al 2017b, Liu et al 2017) and midlatitudes (Hu et al 2019). CMS Phase 2 projects also demonstrated the ability to constrain and validate anthropogenic emissions estimates on regional scales using a combination of in situ measurements and remote sensing data (Chen et al 2016, Fischer et al 2017, Graven et al 2018, Sargent et al 2018). During the COVID-19 pandemic, global data assimilation systems were able to detect the small decrease in global fossil fuel emissions and to evaluate independent country-level estimates of emissions changes (Weir et al 2021b). Bottom-up datasets also yielded new insights into the key processes and trends driving flux changes across land (Chen et al 2017a, Andela et al 2019, Fu et al 2019, Bloom et al 2020) and ocean ecosystems (Gregg et al 2017, Carroll et al 2020). This progress, particularly at global scales, supports the capacity building potential of CMS. Many global flux products provide detailed information for non-Annex I countries that may improve national level reporting mandated by the Paris climate accord.
In addition to demonstrating understanding of processes, many CMS projects focused on highlighting the observational and modeling priorities that are needed to further refine flux estimates. The availability of high-resolution, low-latency global flux and emissions datasets remains an unmet need in the atmospheric carbon monitoring community (Oda et al 2018, Weir et al 2021a). Though uncertainty quantification (UQ) methods have improved throughout CMS (e.g. Bousserez et al 2015, Oda et al 2019), atmospheric transport remains a sizable source of uncertainty for inverse estimates at both regional and global scales (Brophy et al 2019, Diaz-Isaac et al 2019, Butler et al 2020). Many critical carbon cycle processes are poorly captured by climate models (Andela et al 2019, Fu et al 2019) despite research advances in recent years.
While Phase 2 CMS flux projects reflected progress in quantifying both human emissions and natural fluxes, many challenges remain. Large differences in bottom-up flux estimates persist despite incorporation of satellite data in land and ocean models (Ott et al 2015). There is a lack of independent atmospheric data at appropriate spatio–temporal scales for evaluating fluxes (Wolfe et al 2018), especially in the tropics. Though substantial improvements have been made over the past decade, satellite bias and coverage gaps limit both the accuracy (Basu et al 2018) and spatial scale of top-down global fluxes (Wang et al 2018). Regional top-down estimates, which can help improve the spatial scale of flux estimates in key regions like the United States where denser observations are available, are complicated by a lack of boundary condition information. Uncertainty estimates, a required element for all CMS products, are often difficult to interpret because of differences in the quantification method used by various projects. In addition to challenges that influence product quality, flux projects have also had more difficulty connecting with stakeholders than some other areas within CMS. Relevant factors include technical roadblocks like a lack of familiarity with scientific data formats among stakeholders, incompatibility between geographical boundaries and spatial resolution of models, and differences in scientific and policy-relevant carbon accounting definitions. In addition, most CMS research products have long latencies and irregular update schedules, which also limits relevance to stakeholder communities.
Progress made across individual CMS projects provides the opportunity for substantial advances in flux estimation in coming years. Quasi-operational flux modeling systems are reducing latency in flux estimates to support research and stakeholder communities. Better integration of regional and global modeling activities could help support more robust and reliable flux estimates across scales with improved characterization of uncertainties. Net flux estimates may also be improved through incorporation of observations from multiple satellites, allowing either a longer period of record for better understanding of interannual variability and trends (e.g. GOSAT and OCO-2) and/or denser observations in key regions (e.g. OCO-2 and GeoCarb). Integration of multiple types of observations that simultaneously constrain flux, stocks, and disturbance into dynamical data assimilation systems can improve consistency of flux products and improve their ability to yield policy relevant information. New observations that support evaluation of regional flux evaluation can improve confidence in flux estimates. Cross-project coordination is also critical in addressing several known gaps. Improving consistency in uncertainty methods of bottom-up CMS flux datasets would allow them to better inform top-down estimates and to improve quantification of top-down uncertainties. CMS also needs to work toward an integrated approach for engaging potential flux stakeholders, particularly at national and global scales where it is important for NASA and other government agencies to provide consistent, regularly updated, high-quality flux information.
3.2.3. Methane
CMS methane activities in Phase 2 focused on enabling the use of satellite observations of atmospheric methane to quantify and attribute emissions on local, regional, and global scales. The work involved strong collaborations with climate policy stakeholders including the California Air Resources Board (CARB), the U.S. Environmental Protection Agency (EPA), Environment and Climate Change Canada, the Mexican National Institute of Ecology and Climate Change, the Integrated Global Greenhouse Gas Information System, and the Rocky Mountain Institute.
A major component of CMS methane activities has been the exploitation of GOSAT satellite observations (2011–present) to quantify methane emissions, the methane sink (mainly tropospheric OH), and their trends on the global scale (Maasakkers et al 2019, Zhang et al 2021, Lu et al 2021). Other GOSAT analyses have focused on North America (Turner et al 2015, 2016, Sheng et al 2018a, Maasakkers et al 2021), and on tropical wetlands (Parker et al 2018). CMS investigators have conducted atmospheric measurement campaigns to quantify methane emissions on urban to regional scales and support satellite observations. This has involved evaluation of commercial solar-viewing shortwave infrared (SWIR) spectrometers with the TCCON satellite validation standard (Hedelius et al 2016, 2017), and application of these spectrometers to study emissions in Boston (McKain et al 2015) and from dairies (Viatte et al 2017). It has also involved inversion of ground-based network observations to quantify emissions in the Los Angeles Basin (Yadav et al 2019), inversion of NASA SEAC4RS aircraft observations to quantify emissions in the Southeast U.S. (Sheng et al 2018b), and aircraft campaigns using the AVIRIS-NG imaging spectrometer to map methane plumes from point sources and infer emissions (Duren et al 2019, Thorpe et al 2020, Cusworth et al 2020a). Combined analysis of satellite, aircraft, and surface observations over the Los Angeles Basin demonstrated the power of the integrated observing system (Cusworth et al 2020b), as did the combined analysis of multiple satellite data streams to quantify emissions from a gas well blowout (Cusworth et al 2021a).
Inversions of satellite data to infer methane emissions require high-quality, spatially resolved emission inventories to serve as prior estimates. Developing such inventories has been a priority for CMS and has focused globally on wetlands (Tian et al 2015a, Bloom et al 2017, Poulter et al 2017, Zhang et al 2017, Treat et al 2018), rice (Zhang et al 2016), livestock (Wolf et al 2017), and fossil fuels (Scarpelli et al 2020a). It has also involved spatial disaggregation of national inventories for the U.S. (Maasakkers et al 2016) and Mexico (Scarpelli et al 2020b). A detailed map of methane-emitting infrastructure has been developed for the Los Angeles Basin to guide atmospheric measurements (Carranza et al 2018).
Another priority for CMS has been to enable the next generation of satellite observations of methane. The new high-density TROPOMI satellite observations have been used to infer methane emissions on the ∼10 km scale (Varon et al 2019, Zhang et al 2020, Shen et al 2021). Studies have determined the combined value of thermal and shortwave IR (TIR + SWIR) measurements to resolve lower-tropospheric methane (Worden et al 2015) and infer trends in tropospheric OH (Y Zhang et al 2018). CMS has contributed to specifications for future geostationary instruments such as GeoCARB and GeoFTS to constrain methane emissions from the regional scale down to the scale of individual facilities (Cusworth et al 2018, Turner et al 2018, Sheng et al 2018b). CMS has been a mechanism for developing the power of GHGSat and imaging spectrometers such as PRISMA and Sentinel-2 to observe point sources of methane (Cusworth et al 2019, 2021a, Varon et al 2018, 2019, 2020, 2021).
CMS methane activities have yielded a number of important results. They have established that inundation and ecosystem respiration are major drivers of variability and trends in methane emissions from wetlands, as shown by GOSAT observations (Parker et al 2018) and biogeochemical models (Bloom et al 2017, Poulter et al 2017, Zhang et al 2017). Wetland models with low methane to temperature sensitivity generally agree better with satellite observations (Ma et al 2021b). Through the development of spatially-resolved national inventories and their application to inversion of satellite observations, CMS has shown that emissions from the oil sector are underestimated by a factor of 2 in the national inventories for the U.S. (Maasakkers et al 2021) and Mexico (Shen et al 2021). On a point source level, CMS investigators have achieved better understanding of the role of 'super-emitters' in contributing disproportionately to state and national methane emissions (Duren et al 2019, Varon et al 2019, 2021, Cusworth et al 2021b) and have identified the underlying processes for landfills (Cusworth et al 2020a) and gas storage facilities (Thorpe et al 2020). Results from these point-source CMS studies were shared directly with industry and agency stakeholders who conducted follow-up site visits with surface sensors to verify and further refine source attribution. In roughly 50% of those cases, facility operators indicated that the confirmed super-emitters were fixable and a subset of those were repaired. The net magnitude of mitigated methane emissions from those studies is currently being reviewed.
Better understanding has also been achieved of the drivers of global methane trends over the past decade, as illustrated by figure 11. Inversion of GOSAT data suggests that tropical livestock could be a major driver for the decadal trend, while wetlands may contribute to the acceleration of the trend since 2016 (Zhang et al 2021). Changes in OH concentrations could greatly contribute to the interannual variability of methane (Turner et al 2017) though probably not to the decadal trend (Zhang et al 2021).

Figure 11. Attribution of the 2010–2018 trend in atmospheric methane by inversion of GOSAT satellite observations. The top panel shows the growth rates of atmospheric methane for individual years as measured by the NOAA surface network and as inferred from the inversion of GOSAT observations, indicating good agreement between the two and an acceleration of the methane trend after 2013. The middle panel shows the attribution of the trend to different sources and to the methane sink (OH), highlighting major contributions from anthropogenic sources and from wetlands. The bottom panels show the major anthropogenic emissions and their trends by sectors, indicating a major contribution of livestock to the methane trend. Adapted from Zhang et al (2021).
Download figure:
Standard image High-resolution imageMajor gaps remain in our understanding of methane emissions. There is considerable uncertainty in quantifying wetland emissions and how these emissions contribute to the global methane trend. This includes uncertainties in the carbon respiration rate (Bloom et al 2017), inundation dynamics (Parker et al 2018), and contributions from the non-growing season (Treat et al 2018) Improved biogeochemical models for methane emission from wetlands are needed (Xu et al 2016). The factors contributing to the global trend in atmospheric methane over the past decade are also still open to debate.
The next several years offer considerable opportunity for improving our ability to use satellite data for quantifying methane emissions on all scales (Jacob et al 2016). Planet and Landsat products can enable better understanding of land surface characteristics to improve our ability to quantify wetland methane emissions. TROPOMI observations should be transformative for improving the capability of inversions of atmospheric methane to constrain the methane budget on global to regional scales. GeoCARB geostationary observations over the Americas should enable better quantification of emissions from South American wetlands. The emerging constellation of satellite instruments able to quantify point sources (GHGSat, PRISMA, S-2, EnMAP, EMIT, MethaneSat, Carbon Mapper) opens up the possibility for operational leak detection and sustained emissions quantification at the scale of individual facilities. The ability to constrain global OH trends from satellite observations of methane should improve through exploitation of TROPOMI and CrIS data.
3.2.4. Marine, freshwater and wet carbon
CMS projects have contributed to various efforts to better characterize the role of oceans and coastal interfaces in global carbon cycling. Some of this work has been summarized in the Second State of the Carbon Cycle Report (USGCRP 2018) as well as published papers on the North American coastal carbon cycle (Fennel et al 2019) and the carbon budget of Eastern North America (Najjar et al 2018). Additionally, Benway et al (2016) produced a synthesis of current information about coastal carbon budgets and provided a series of recommendations for future research.
Some CMS projects have considered the nature of coastal margins as boundaries to the continental carbon cycle. Related to this is improved observation and modeling of lateral transport of terrestrial carbon and nutrients into the watershed and ultimately to coasts (Liu et al 2013, Lohrenz et al 2013, Xue et al 2013, Tao et al 2014, Ren et al 2015, 2016, Tian et al 2015b, 2015c, 2020; figure 12). A key to understanding this important term is how land use and land cover along with other drivers such as human activity and climate-related changes affect lateral transport processes.
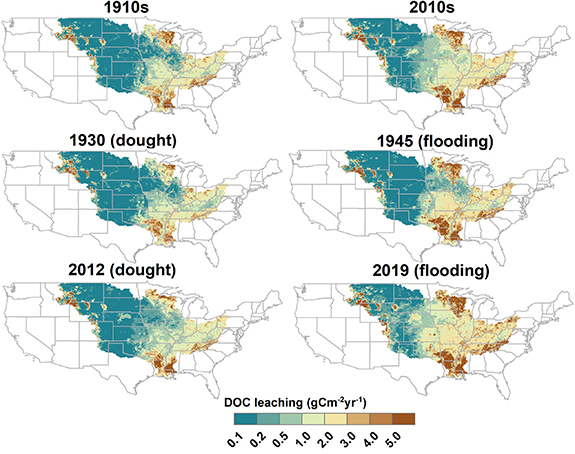
Figure 12. Century-long increasing trend and variability of dissolved organic carbon export from the Mississippi River basin driven by natural and anthropogenic forcing as simulated by Dynamic Land Ecosystem Model (DLEM).
Download figure:
Standard image High-resolution imageConsiderable focus was given to the potentially large reservoirs of carbon biomass undergoing substantial change in sensitive coastal ecosystems. Both mangrove and tidal wetland ecosystems are critical coastal buffer zones and are undergoing rapid changes. CMS efforts include studies of mangroves (Lee and Fatoyinbo 2015, Lagomasino et al 2015, 2016, Fatoyinbo et al 2018, Simard et al 2019) and tidal wetlands (Hopkinson et al 2012, Morris et al 2016, Hinson et al 2017, Byrd et al 2018, Holmquist et al 2018a, 2018b). Mangroves account for a substantial amount of carbon biomass and various CMS efforts examined Lidar-based algorithms for refining aboveground biomass estimates (Lagomasino et al 2015, Fatoyinbo et al 2018, Simard et al 2019). Tidal wetlands also represent an important coastal carbon reservoir (Hopkinson et al 2012, Byrd et al 2018, Windham-Myers et al 2018, Holmquist et al 2018a, 2018b). CMS projects have also evaluated sources of methane and nitrous oxide emissions. This included examination of tidal wetlands and aquaculture sites (Poulter et al 2017, Zhang et al 2017, EPA 2019), as well as more comprehensive assessments over North America and globally (Xu et al 2012, Tian et al 2012b, 2015a, 2016).
CMS efforts have greatly expanded the information about oceans and coastal interfaces and their key role in global carbon cycling. Efforts such as the Second State of the Carbon Cycle Report (USGCRP 2018, Fennel et al 2019) have provided an initial assessment of air-sea and land-ocean fluxes for North America. CMS investigators contributed to chapters covering Inland Waters (Ch 14), Tidal Wetlands and Estuaries (Ch 15), Coastal Ocean and Continental Shelves (Ch 16), and Biogeochemical Effects of Rising Atmospheric Carbon Dioxide (Ch 17). Coastal margins in North America act as a net sink of carbon. The North American Exclusive Economic Zone is estimated to be a net sink for carbon on the order of 160 ± 80 Tg C y−1 (Fennel et al 2019). The estimated carbon input from land is 106 ± 30 Tg C y−1. A global inventory of carbon dioxide fluxes in coastal margins influenced by large rivers (Cai et al 2013) found that estuaries were a net source of CO2 due to metabolism of terrestrial carbon entering these systems. In contrast, a global assessment of coastal areas influenced by large river plumes found that they were a net sink for CO2. Considerable focus was given to the northern Gulf of Mexico and the Mississippi River plume, including extensive ship-based mapping and buoy measurements of pCO2 (Guo et al 2012, Cai et al 2013, Huang et al 2013, 2015a, 2015b) as well as model simulations using a coupled physical-biogeochemical model (Xue et al 2014) and satellite-derived estimation of pCO2 and air-sea flux of CO2 (Lohrenz et al 2018). The biological dynamics influencing carbon dynamics were considered by Chakraborty et al (Chakraborty and Lohrenz 2015, Chakraborty et al 2017), who explored the relationships between phytoplankton community composition and physiological properties of populations and relationships to environmental conditions. Other efforts have examined carbon properties in both the Gulf of Mexico and the Atlantic coast (Wang et al 2013, Najjar et al 2018).
Impacts of human and climate-related forcing on terrestrial watersheds affect export of carbon and other materials to the coastal margins. Changes in land cover and land use along with climate-related factors were determined to impact lateral movement of carbon and other materials through the watershed. Work by Tian et al and others utilized the Dynamic Land Ecosystem Model along with extensive satellite and ground-based observations to examine historical trends and patterns as well as modeled simulations of future scenarios under differing climate and atmospheric carbon forcing (Tian et al 2012a, 2015b, 2015c, Liu et al 2013, Lohrenz et al 2013, Xue et al 2013, Tao et al 2014, Ren et al 2015, 2016, Yu et al 2018). Urban land conversion (Zhang et al 2012, 2014), livestock manure nutrient production (Yang et al 2016), crop production (Lu et al 2018), forest disturbance (Chen et al 2013), drought (Chen et al 2012), and large fires (Yang et al 2015) were considered as significant factors in terrestrial carbon dynamics. More recent work has addressed factors affecting nitrogen loading to the Mississippi River basin (Lu et al 2020, Tian et al 2020). An additional carbon-related concern for coastal ecosystems is ocean acidification and its implications for coastal ecology and carbon cycling. Increasing ocean acidification may also reduce the buffering capabilities of coastal waters diminishing their capacity as carbon sinks (Wang et al 2013, Salisbury et al 2015, Fennel et al 2019).
Consideration by CMS projects was given to productivity and influencing factors in the Upper Great Lakes (Yousef et al 2014, Fahnenstiel et al 2016). Information about primary productivity in the upper Great Lakes was significantly expanded through CMS efforts. Primary production in Lake Michigan was found to decrease over the 1998–2010 period, largely attributed to a decline in chlorophyll biomass as a result of the quagga mussel activity (Yousef et al 2014). A comprehensive assessment of primary production was done for the upper Great Lakes for the period 2010–2013 (Fahnenstiel et al 2016), thereby providing a baseline for future study.
Despite progress in understanding marine, freshwater and wet carbon dynamics, scientific uncertainties and priorities remain. These include continued refinement of terrestrial ecosystem models needed to reduce uncertainties in carbon flux quantification. Improvements are needed in parameterization in areas such as in-stream organic production and transformation, as well as hydrological processes including effects of dams and rivers require further study. Constraining estimates of contributions by coastal margins and inland waters to continental and global carbon budgets requires improved assessments of exchange fluxes and the associated seasonal and interannual variability. While the amount of information has grown substantially, uncertainties represent a challenge because carbon is exchanged across multiple interfaces (land-coastal ocean, coastal ocean-open ocean, ocean-benthic, ocean-atmosphere). There is a need for improved characterization of spatial patterns and relationships to forcing, as well as assessments of these exchange fluxes and the associated seasonal and interannual variability. How coastal margins will be affected by changing climate forcing, sea level rise, and human impacts remains an important question. Tidal wetlands and mangroves represent large reservoirs of carbon and are important as potential sources of carbon dioxide and other greenhouse gases. Contributions of coastal margins to methane budgets are still poorly understood. Also, contributions of tidal wetlands and marshes to nitrous oxide budgets need to be examined. Tidal wetlands and mangroves have been identified as important sinks and sources, but still associated with significant uncertainties. Continental to global assessments are needed, but current knowledge is very limited regarding coastal margins as sources of methane or nitrous oxide.
Although considerable progress has been made in understanding contributions of coastal margins to global carbon, these contributions are still not well constrained, particularly with regard to seasonal and spatial patterns. There is a need for coordinated modeling and observations across the land-ocean continuum, including continued and expanded time-series observations to better discern temporal variability. Approaches should integrate observations, modeling and stakeholder needs (Fennel et al 2019). There is also a need for better quantification of methane and nitrous oxide fluxes in different coastal types (e.g. river, estuary, tidal wetland, mangrove, etc). Continued advancement of novel approaches such as remote sensing techniques for characterizing changes in carbon biomass and fluxes in coastal environments will be important for reducing uncertainty in these variables. Uncertainties in feedbacks need also to be addressed—how will future changes including climate, human impacts, and increasing atmospheric CO2 affect efficiency of ocean uptake? Improved understanding of how coastal margins and associated carbon dynamics will change and what factors, including human activity, will influence that change will be important considerations for policy and decision-making.
3.2.5. Stakeholder
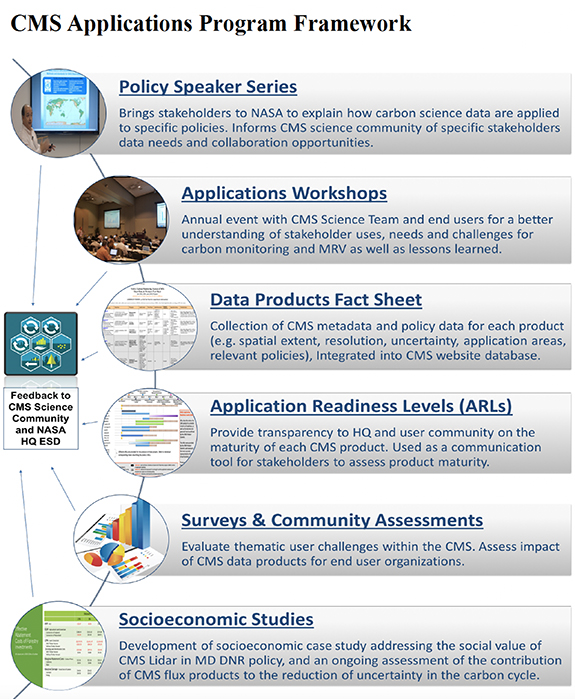
During Phase 2, stakeholder engagement accelerated at the federal, state, and local level, and with international partners. The CMS program funds basic and applied research that is created while engaging with a user community in a way that bridges carbon science and user communities to better serve societal needs (Brown et al 2020; figure 13).
Figure 13. CMS applications program framework for stakeholder engagement.
Download figure:
Standard image High-resolution image
By connecting carbon cycle science research to stakeholders who use the data in their decision making, NASA CMS contributes to understanding and meeting the needs of the climate data user community. For example, Phase 2 produced novel data products on forest carbon product designed to meet state needs beginning in Maryland (Huang et al 2015, Hurtt et al 2019, Lamb et al 2021a), and later expanding to the multi-state Regional Greenhouse Gas Initiative (RGGI) region (Tang et al 2021, Ma et al 2021a, Lamb et al 2021b). New efforts on mapping and monitoring methane across California and other regions (Carranza et al 2018) engaged the CARB to identify and remove methane 'hotspots' across urban areas. Other stakeholders across a wide variety of CMS projects include Northwest Management Inc. The Nature Conservancy, Worcester Tree Initiative, Maryland Valleys Planning Council, World Resources Institute, Blue Source, Chesapeake Conservancy, U.S. Forest Service, the Environmental Defense Fund, the Sonoma County Agricultural Preservation and Open Space District, among many others.
Ensuring that critical information on carbon is used in day-to-day decisions and policy making by stakeholders such as governments, businesses, and institutions requires early engagement and frequent communication between the user and the producer of the information (Cash et al 2006). The CMS program allows scientists to build mature relationships with stakeholders that result in greater success in moving a carbon cycle product from conceptualization to actual use within a decision-making context. It is only through funding a single individual who provides consistent engagement and builds relationships among and between the scientists and these institutions is CMS able to accelerate uptake of datasets in Phase 2 (Brown et al 2020).
Major gaps from Phase 2 include the need for carbon products to be repeated, updated regularly, and for CMS to provide information that describes change through time instead of a single point in time. Change products would require standardization and repeat acquisition of input data, ongoing support of computing resources, access services, and for the policy relevance of the product to be clearly acknowledged and articulated. Gaps also include a relative lack of products that describe the sensitive ecosystems of mangroves and urban forests, and products that link biomass to methane emissions. Economic studies are needed to demonstrate the value of these ecosystems and how information on them can be used in decision making in ways that may result in improved resilience and functioning (Horita et al 2017). Economic analysis of the value of information may include data documenting impact of carbon cycle uncertainty (Cooke et al 2016), and the costs and benefits of forest policy that incorporates carbon sequestration. For example, Lamb et al (2021b) describe how afforestation and reforestation in Maryland can provide both carbon sequestration potential and economic opportunity via forest carbon pricing verified through the use of geospatial products generated through the CMS program.
Recommendations include increased focus on: reconciling carbon stocks and fluxes, developing consistency across scales, quantifying movement and transport of carbon, attributing carbon emissions and sinks to respective sources, cross-sectoral accounting, and UQ (West et al 2013). More data products are needed in new regions and new ecosystems with new stakeholders supporting city, state, and national/international initiatives where demand for decision support is increasing. Capacity to use carbon data products for people who are developing policy is a critical need, as Lamb et al (2021a) demonstrated. With an improved understanding of the value of carbon and the alternative land uses, appropriate incentives and policies can be developed that increase the value of land use while sequestering more carbon.
CMS has developed a community of practice where scientists have learned how to do meaningful stakeholder engagement, the value of this engagement, and have learned through annual Science Team meetings and stakeholder workshops about applications of CMS products (Brown et al 2020). This engagement by each funded project is one of the most novel parts of the CMS program and results in rapid prototyping and discovery of new carbon cycle data and models. By emphasizing in future funding opportunities the need for proposers to identify and engage with stakeholders before proposing, more rapid uptake of new carbon cycle products can be achieved (Brown et al 2020). As Arnott et al (2020) points out, funders of science are receptive to new ways of revisiting the 'social contract' for science so that co-production of knowledge can be prioritized. Ensuring CMS scientists prioritize relationships as well as producing products and writing papers is essential.
3.3. Initiative
CMS Phase 2 has engaged a large and diverse set of scientists and stakeholders in prototyping novel approaches to carbon monitoring in all major components of the Earth system (land, atmosphere, ocean/wet carbon), for both biomass and fluxes, and over a variety of spatial (local to global) and temporal domains. The projects and their results have been described in multiple publications and synthesized at the thematic level above. Here they are aggregated up and synthesized at the initiative level toward a systems perspective.
For biomass, it is clear CMS has demonstrated through multiple efforts that high-resolution mapping and modeling of forest biomass enabled by LiDAR/Radar and optical remote sensing is now possible across a range of systems, at multiple scales and ARLs, and is defensible in the context of MRV and REDD +. The advances thus far based largely on airborne data have yielded important applications in their own right and have also paved the way for subsequent orbital missions such as GEDI and ICESat-2 and others. For flux, atmospheric research and inverse modeling techniques have also qualitatively advanced and led to important new capabilities and findings for carbon. CMS has advanced two state of the art global flux systems, able to track sources and sinks and 3-D transport of carbon in the atmosphere. Importantly, regional networks of in situ and remote-sensing measurements of greenhouse gas concentrations have been shown capable of validating emission estimates. For methane, satellite and aircraft observations have been demonstrated to usefully monitor methane emissions from the national/regional scale down to the scale of point sources. The resulting capabilities can be used in national inventories, and in the identification of superemitter point sources. For wet carbon, research has quantified the importance of coastal margins as a sink of carbon—with high temporal and spatial variability, and that the impacts of human and climate-related forcing on terrestrial watersheds affect export of carbon and other materials to the coastal margins, and subsequently influence coastal carbon dynamics. Wetland and mangrove ecosystems have been shown to represent important reservoirs of carbon undergoing rapid change and may also be important sources of methane and other greenhouse gases. Across all of these themes, and perhaps most importantly, CMS has demonstrated that addressing stakeholder needs and advancing science are mutually beneficial, with societal needs driving new science requirements and resulting in new scientific results of high societal relevance.
Despite these advances, additional uncertainties and challenges remain. For example, the mapping of land biomass and biomass change, while promising, has yet to be accomplished with sufficient accuracy and resolution or attribution across all ecosystems, regions, disturbance regimes, and land-use classifications and time domains to meet stakeholder needs. Challenges remain to continue to improve atmospheric flux products and their connection with stakeholders. Net fluxes from atmospheric data do not have clearly defined stakeholders. Long latency and intermittent availability impacts relevancy for stakeholders. Lack of independent data hampers flux validation. Technical issues—data formats, geographic boundaries, accounting definitions can be improved. Coastal margins are a substantial and highly variable signal in global carbon budgets, but this contribution is still not well constrained, particularly with regard to seasonal and spatial patterns. Limited work on aquatic ecosystems and oceans has been done to date. There is considerable uncertainty in quantifying wetland emissions and how they contribute to total national emissions and the global methane trend. Uncertainties in carbon respiration rate, inundation dynamics, non-growing season emissions all contribute. Different CMS studies suggest that wetlands, livestock, oil/gas exploitation, OH concentrations could all have contributed. Looking across projects, it is not clear how different estimates of uncertainty can be reconciled, or combined, or applied, or how/how well various CMS products could be combined into global system level assessments, and once realized how such advances could be maintained over time. There are many important advances still needed to realize the full potential including: advances in remote sensing and modeling, coordinated advances in computing and data, and new partnerships and stakeholders.
In the future, additional efforts are needed to prototype carbon monitoring capabilities to meet stakeholder needs across a full range of systems, scales, quantities, and stakeholders. It is unreasonable to assume that progress can be made evenly in all areas, or that there is a single system that can meet all of these needs. Future efforts should build on successes, scale-up existing successful approaches, and initiate new activities in areas and domains most needed. Projects are needed that build upon airborne-based prototypes and incorporate new orbital remote sensing datasets to improve and extend coverage of carbon monitoring capabilities, expand the coverage of forest carbon monitoring and modeling capabilities globally (GEDI, ICESat-2), and exploit the next generation of satellite observations to constrain methane fluxes in a way that serves stakeholder needs (GOSAT, TROPOMI, etc). The impact on flux estimates from integration of multiple sensors needs to be assessed (OCO-2, GeoCARB, etc). Projects should continue emphasis on validation and improve and coordinate quantitative estimates of uncertainties to facilitate interoperability of products and their applications. To connect system components, integrated approaches for models and observations across scales, and across the land-ocean-atmosphere continuum, are needed. For maximum utility, an increased emphasis is needed on coupling models and observations to expand the time domain of products from contemporary periods, both backward to reach policy base year, and forward to include planning for climate mitigation. To ensure maximum relevance, continued emphasis on end-to-end stakeholder engagement, a hallmark of CMS, should be continued and expanded, and a plan must be developed to sustain key science advances and update products of high stakeholder importance.
4. Conclusion and discussion
Over the past 10 years (2011–2021), NASA Phase 2 has supported 79 projects to completion prototyping innovative scientific approaches to carbon monitoring on land, atmosphere, and ocean, including fluxes between. The result is one of the largest collections of applied carbon monitoring research to date, evidenced by numerous publications, citations, products, and product downloads.
Key to this effort has been exploitation of the remote sensing and modeling expertise of NASA, collaboration with scientists and data products from other agencies, and the end-to-end focus on stakeholder engagement to meet societal needs. CMS projects have utilized both airborne and orbital remote sensing products and have led the integration of these data with some of the most advanced process models for both biomass and atmospheric fluxes.
In addition to products and metrics, there are numerous qualitative success stories that have emerged. The 2014 Farm Bill directed the U.S Forest Service (USFS) both to increase operational cooperation with NASA and to address monitoring of large areas of uninventoried forest in Interior Alaska. CMS has partnered with USFS to advance the national forest inventory in Alaska utilizing remote sensing over some of the most inaccessible areas. Over Maryland, high resolution forest carbon monitoring and modeling products have been implemented to meet the state's needs, becoming the first state in the nation utilizing remote sensing-based assessment. Over wetlands, CMS products have pioneered mapping forest biomass and providing a global assessment of their carbon stocks in some of the most carbon rich ecosystems in the world. Internationally, CMS innovated a framework for forest MRV for other developing countries. CMS has also had multiple success stories in atmospheric flux. For example, carbon emissions from Indonesian fires, of global importance, have been quantified and used in official IPCC reporting. Innovations quantifying methane flux have identified important, but previously unknown, point sources within the US, and lead to an update of U.S. reporting of methane emissions nationwide. CMS also quantified land-ocean exchange of carbon in the Mississippi river basin, a key missing link in carbon accounting. Two global atmospheric flux systems provide state-of-the-art synthesis and tracking of emissions and fluxes worldwide.
Looking ahead, two key questions emerge. First, how can past advances of societal importance be sustained and updated and utilized? To meet these needs, all NASA CMS products are permanently archived and made freely available via Distributed Active Archive Centers. Beyond that, additional efforts and partnerships are needed to support capacity building to utilize new data products, and to refresh and update important data products over time.
Next, what should be done to meet evolving needs for carbon monitoring? This report details a series of remaining science gaps and science next steps in both thematic areas and initiative wide. These recommendations need to be married to the stakeholder context, in which there is a growing need for carbon data at a variety of policy scales. Numerous cities have climate mitigation goals and carbon budgets, evidenced by the Compact of Mayors. More than 25 states in the U.S. are members of the U.S. Climate Alliance and have climate mitigation goals set in state policy. Most recently, the U.S. has rejoined the Paris Climate Accord and has made new commitments in the Glasgow Pact. These different policy needs at different scales likely drive important differences in science requirements. These needs must be met with expanded and coordinated science advances designed to meet stakeholder needs in a flexible CMS, or system of systems.
Despite NASA's leadership in CMS, it is clear that NASA does not and cannot do this work alone (Hurtt et al 2014b). The vast majority of CMS projects involve critical interagency collaborations with other federal agencies with complementary strengths, including USDA, NOAA, DOE, and others. There is tremendous opportunity now to strategically integrate and deepen these interagency collaborations further toward the development of the most robust CMS capabilities to meet societal needs.
Acknowledgments
This work was supported by NASA Carbon Monitoring System Projects (80NSSC17K0710, 80NSSC21K1059, NNX14AO73G, 80NSSC17K0711, 80NSSC20K0006, 80NSSC21K0965 80HQTR21T0066, 80HQTR18T0016, NNX16AQ25G, 80NSSC21K1001). A portion of this research was carried out at the Jet Propulsion Laboratory, California Institute of Technology, under a contract with the National Aeronautics and Space Administration (80NM0018D0004). S P S was also partially supported by the United States Department of Energy contract No. DE-SC0012704 to Brookhaven National Laboratory.
Data availability statement
The data that support the findings of this study are openly available at the following URL/DOI: https://carbon.nasa.gov/data.html.