

Abstract
The land ecosystems of China are estimated to provide an important sink for the increased atmospheric carbon dioxide (CO2), but are undermined by severe ozone (O3) pollution. Mitigation of O3 damage to ecosystems remains a challenge considering that O3 precursors are emitted from a wide range of anthropogenic sectors and O3 formations are also affected by regional transport. Here, we combine chemical transport and dynamic vegetation models to quantify the benefits of sectoral and regional emission controls for the recovery of gross primary productivity (GPP) in the Yangtze River Delta (YRD). For sectoral emission controls, the largest mitigation of O3 damage to GPP in YRD by 3.1 ± 0.4 and 2.2 ± 0.2 Gg[C] d−1 with 50% reductions in the emissions from industry and transportation sectors, respectively. For regional emission controls, reducing 50% anthropogenic emissions outside YRD can mitigate GPP losses by 18.6 ± 3.5 Gg[C] d−1, larger than the recovery of 10.1 ± 1.6 Gg[C] d−1 by the 50% reductions of anthropogenic emissions within YRD. Moreover, summer months, especially July are the best period for GPP recovery from anthropogenic emission controls. Our results highlight the importance of sectoral and regional emission controls to mitigate O3 damage to ecosystem productivities in YRD.
Export citation and abstract BibTeX RIS

Original content from this work may be used under the terms of the Creative Commons Attribution 4.0 license. Any further distribution of this work must maintain attribution to the author(s) and the title of the work, journal citation and DOI.
1. Introduction
Ozone (O3) and haze episodes are two emerging and connected challenges in China (Li et al 2019, Ma et al 2021, Qu et al 2021, Zhao et al 2022). Since 2013, stringent air pollution control named 'Clean Air Actions' has been implemented by Chinese government to solve the air quality problem. Consequently, concentrations of particulate matter decreased substantially ever since (Fu et al 2019, Zhang et al 2019, He et al 2021). However, O3 pollution is getting worse (Liu and Wang 2020, Lu et al 2020, Dang et al 2021), especially in Yangtze River Delta (YRD) where the ratio of O3-dominated episodes increased from 13.9% in 2013 to 50.4% in 2017 (www.cnemc.cn/jcbg/zghjzkgb/). As a secondary gas pollutant, O3 is produced by chemical reactions of nitrogen oxides (NOx ) and volatile organic compounds (VOCs) in the presence of sunlight (Atkinson 2000, Chen and Brune 2012). In China, O3 precursors such as NOx and VOCs are mainly emitted by anthropogenic sources, including industry, transportation, and power sectors (Lu et al 2019, Li et al 2020). Meanwhile, surface O3 is likely to reach high levels on hot and sunny days due to accelerated photochemical rates and reduced plant stomatal uptake (Gong and Liao 2019, Lin et al 2020, Lei et al 2022).
High O3 concentrations near surface can not only threaten human health (Chen et al 2012, Lu et al 2020), but also reduce terrestrial ecosystem productivity (Yue et al 2017, Agathokleous et al 2020, Unger et al 2020, Lei et al 2021). Open-top chambers and free-air experiments revealed visible O3 injuries on numerous plant species, including trees, shrubs, and herbs (Wan et al 2014, Feng et al 2015). Based on these measurements, some O3 vegetation damage schemes were developed, for example Sitch et al (2007) and Lombardozzi et al (2015), to predict reductions in photosynthesis using O3 stomatal uptake and empirical damaging sensitivities. Numerical models implementing these schemes showed that O3 causes strong damages to ecosystem productivity from regional to global scales (Zhou et al 2018, Unger et al 2020).
Ecosystem is an important carbon sink in China. Every year, terrestrial ecosystem uptakes ∼10% of the total anthropogenic carbon emissions in China (Piao et al 2009, Fang et al 2018). However, the land sink capacity in China is threatened by the worsening O3 pollution that induces losses of ∼15% in ecosystem productivity (Yue et al 2017, Unger et al 2020). Therefore, how to mitigate O3 damages on land ecosystem productivity is an urgent question. Here, we combine chemical transport and dynamic vegetation models to examine how much carbon loss can be avoided through sectoral and regional emission controls of O3 precursors. We focus specifically on the land ecosystems in YRD, where vegetation cover is high and O3 level was increasing fast in recent years. Emission controls include stringent 50% reductions in anthropogenic emissions from five sectors and different regions, a decreasing ratio likely achieved by the 2060s with the national carbon neutrality target (Tong et al 2020, Lamboll et al 2021, He et al 2022). Surface O3 is predicted by the chemical transport model under different emission controls, and is then used to influence carbon cycle in the vegetation model.
2. Methods and materials
2.1. The GEOS-Chem chemical transport model
GEOS-Chem is a widely used global 3D chemical transport model for simulating concentrations of gas-phase pollutants and aerosols with a detailed HOx
–NOx
–VOC–O3–halogen–aerosol chemistry mechanism (Kim et al
2015a, Lee et al
2017, Lu et al
2019, Porter and Heald 2019, Gong et al
2021). This model uses Fast-JX scheme to compute photolysis rates (Bian and Prather 2002). Biogenic VOC (BVOC) emissions are computed based on the Model of Emissions of Gases and Aerosols from Nature (MEGAN v2.1) (Guenther et al
2012). The dry deposition for gases is computed based on the resistance-in-series scheme (Wesely 1989). The global anthropogenic emission inventory is obtained from Community Emissions Data System (Hoesly et al
2018). Anthropogenic emissions in China are computed based on Multiresolution Emission Inventory (MEIC), which estimates SO2, NOx
, CO, NMVOC, NH3, PM10, PM2.5, BC, OC, and CO2 emissions from five source sectors including agriculture (AGR), industry (IND), power (POW), residential (RES), and transportation (TRA) (Zheng et al
2018). Notably, agriculture source sector only includes NH3 emissions. Total anthropogenic emissions from each sector in YRD are summarized in table S1 (available online at stacks.iop.org/ERL/17/065008/mmedia). In this study, nested GEOS-Chem version 12.0.0 with resolution of 0.5°  0.625° is driven by the Modern-Era Retrospective analysis for Research and Applications, version 2 (MERRA2) meteorological fields to predict the changes of tropospheric O3 under different anthropogenic emission controls.
2.2. The Yale Interactive terrestrial Biosphere (YIBs) vegetation model
The YIBs model is a process-based vegetation model designed to simulate global carbon cycle with dynamical prediction of leaf area index (LAI) and tree height (Yue and Unger 2015). Leaf-level photosynthesis is computed using Farquhar et al (1980) scheme. The leaf photosynthesis is further upscaled to canopy level by separating the responses of sunlit and shaded leaves to diffuse and direct radiation (Spitters 1986). Calculations of LAI and carbon allocation follow the Joint UK Land Environment Simulator (JULES) model (Clark et al
2011). The Moderate Resolution Imaging Spectroradiometer (MODIS) land types and cover fractions are aggregated into eight plant functional types (figure S1), including evergreen needleleaf forest, deciduous broadleaf forest, evergreen broadleaf forest, shrubland, C3/C4 grasses, and C3/C4 crops to calculate carbon uptake in the YRD. The YIBs model applies Kim et al (2015b) scheme to build phenology. For crops, the plant date and harvest date are fixed based on observations. For other plant functional types, leaf phenology is generally controlled by temperature, water availability, and photoperiod. The YIBs model has been comprehensively validated against site-level observations and satellite retrievals (Yue et al
2015, 2017, Yue and Unger 2018). Since 2020, the YIBs model has joined the multi-model ensemble project 'Trends in the land carbon cycle (TRENDY)' to estimate global carbon budget (Friedlingstein et al
2020). In this study, the YIBs model is driven by the same meteorological fields (MERRA2) as GEOS-Chem with a higher resolution of 0.25°  0.3125°.
The semi-mechanistic O3 damage scheme is coupled into YIBs to quantify the carbon losses by surface O3 (Sitch et al
2007, Lei et al
2020, Unger et al
2020). The O3-induced photosynthesis loss ( ,
,  ) is calculated by multiplying the O3 damage factor (
 ) to the original leaf photosynthesis (
 ,
,  ):
):

The  is calculated based on excessive O3 flux (
 ,
,  ) and sensitivity coefficient (
 ):
):

The  has two values for each vegetation type, representing low to high O3-damaging sensitivities. The
  is calculated based on stomatal O3 flux (
 ,
,  ) and O3 damaging threshold (
 ,
,  ):
):

The  represents the O3 tolerance for each vegetation type. The
  is calculated based on surface O3 concentrations (
![$\left[ {{{\text{O}}_{\text{3}}}} \right]$](https://content.cld.iop.org/journals/1748-9326/17/6/065008/revision2/erlac6ff7ieqn20.gif) ,
,  ), aerodynamic resistance (
 ,
,  ), boundary layer resistance (
 ,
,  ), stomatal conductance (
 ,
,  ), and the ratio of leaf resistance O3 to leaf resistance of water vapor (
 ):
):

The O3-damaging gross primary productivity (GPP) is calculated by integrating  over all canopy layers:
This scheme has been well validated against hundreds of experimental data collected globally and in China (Yue et al 2017, Yue and Unger 2018).
2.3. Model simulations
In this study, we conduct ten GEOS-Chem runs and 20 YIBs runs to explore the changes of O3-induced GPP reductions in the YRD by different anthropogenic emission control strategies (table 1). In the control run (CTRL), the GEOS-Chem model is forced with all sources of emissions. The SHUT run uses the same emissions as CTRL, except for shutting down anthropogenic emissions in China. In five sensitivity runs, the model is forced with all anthropogenic emissions but 50% emission reductions in YRD from a specific sector, including agriculture (AGR_RED50%), industry (IND_RED50%), power (POW_RED50%), residential source (RES_RED50%), or transportation (TRA_RED50%). We perform another three runs with GEOS-Chem to explore the impacts of collaborative emission reductions and regional transport on O3 pollution, including 50% reductions of anthropogenic emissions outside YRD (YRDout_RED50%), inside YRD (YRDin_RED50%), or the whole anthropogenic emissions in China (CHN_RED50%). For above simulations, anthropogenic emissions of all pollution species are retained or perturbed with the same ratios (e.g. reduce by 50% or 100%). All runs are conducted from January to September in 2017 and the results of last 6 months are used to investigate the mitigation effects of anthropogenic emission controls on O3-induced GPP losses during the growing season (April–September). The simulated hourly surface O3 concentrations from each GEOS-Chem run are used to drive the YIBs model with either high or low sensitivities, making a total of 20 YIBs runs. The derived GPP losses with low and high O3-damaging sensitivities are averaged for comparisons and one standard deviation of low and high O3-damaging sensitivities represents uncertainties of O3 damage on GPP.
Table 1. Summary of simulations with GEOS-Chem models.
| Name | Emissions |
|---|---|
| CTRL | All emissions |
| SHUT | Shut down anthropogenic emissions in China |
| AGR_RED50% | Reduce agriculture emissions alone by 50% in YRD |
| IND_RED50% | Reduce industry emissions alone by 50% in YRD |
| POW_RED50% | Reduce power emissions alone by 50% in YRD |
| RES_RED50% | Reduce residential emissions alone by 50% in YRD |
| TRA_RED50% | Reduce transportation emissions alone by 50% in YRD |
| YRDout_RED50% | Reduce anthropogenic emissions by 50% outside YRD |
| YRDin_RED50% | Reduce anthropogenic emissions by 50% in YRD |
| CHN_RED50% | Reduce anthropogenic emissions by 50% in China |
2.4. Validation data
Ground-based hourly O3 concentrations in 2017 growing-season are collected from the observational network of the China Ministry of Ecology and Environment (MEE) (http://datacenter.mee.gov.cn/). With quality control, continuous measurements at 157 sites in YRD are selected to evaluate the simulated surface O3 from GEOS-Chem. We use the daily maximum 8 h average (MDA8) O3 as the metric in validation. Benchmark GPP are obtained from the Global LAnd Surface Satellite (GLASS) product generation system (Yuan et al 2010, Zhao et al 2013). The GLASS GPP agrees well with FLUXNET observations (Yu et al 2018) and has been widely used in the estimate of global and regional carbon budgets (Jiang et al 2021).
3. Results
3.1. Model validations
Simulated mean surface O3 concentrations and GPP during the growing season in 2017 are validated using site-level measurements from MEE and benchmark GPP from GLASS (figure 1). We choose 2017 here as the regional MEIC inventory used in GEOS-Chem is only updated to 2017 (http://meicmodel.org/). Observed O3 shows high values in the north and east of YRD (figure 1(a)), following the large regional emissions (figure S2). Compared to observations, the GEOS-Chem model well captures the spatiotemporal variation of surface O3, with a high correlation coefficient of 0.6 (p < 0.01) and a low normalized mean bias of 4% for 28725 statistical samples (figures 1(b) and (c)). Similarly, the YIBs model reasonably depicts the spatial distribution of GPP with an increasing gradient from the north to the south of YRD (figures 1(d) and (e)). The correlation coefficient is 0.7 (p < 0.01) and the normalized mean bias is only 10% for 467 statistical samples between observations and simulations (figure 1(f)). The limited biases in both the simulated O3 and GPP consolidate our strategies in quantifying the changes of O3-induced carbon losses under different emission controls using the GEOS-Chem and YIBs models.
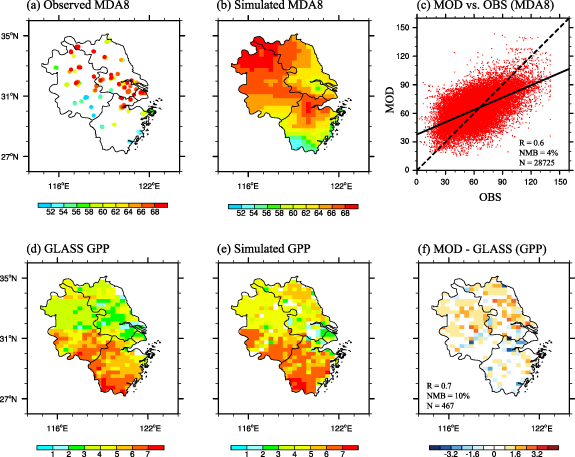
Figure 1. Validations of simulated daily MDA8 ozone (O3) (units: ppb) and GPP (units: g[C] m−2 d−1) in YRD. Panels (a) and (b) represent observed and simulated 2017 growing-season (April–September) mean MDA8 O3, respectively. Figure (c) shows the comparison of daily MDA8 O3 between observations and GEOS-Chem simulations. Panels (d)–(f) represent 2017 growing-season mean GPP from YIBs simulations, observations, and their differences, respectively. The correlation coefficients (R), normalized mean biases (NMB) are shown in panels with the indication of sample numbers (N) used for statistics.
Download figure:
Standard image High-resolution image3.2. O3 damage to ecosystem productivity
Ecosystem productivity in YRD is threatened by the severe O3 pollution (figure 2). In 2017, surface O3 reduces regional GPP by 184.1 ± 44.5 Gg[C] d−1 during the growing season in YRD (figure 2(a)), accounting for a fraction of 10% to the total GPP. Regional maximum reductions are distributed in Zhejiang province and southern Anhui province, although the high surface O3 concentrations are predicted in the northern Anhui province and southern Jiangsu province. Such discrepancy is likely because that northern Anhui province and southern Jiangsu province is mainly covered by crops which have a higher O3 damage critical threshold than other ecosystem types (Unger et al 2020). In the growing season, O3-induced GPP reductions reach maximums in summer (June–August) due to large GPP and high surface O3 concentrations (figure 2(c)). With sensitivity simulation SHUT, we quantify the effects of anthropogenic emissions on ecosystem productivity in YRD. It is found that shutting down all anthropogenic emissions in China decreases regional mean O3 by 29.2 ppbv during the growing season in YRD (figure S3(a)). Consequently, O3-induced GPP loss is alleviated by 144.9 ± 31.5 Gg[C] d−1 in YRD (figure 2(b)). The largest benefit of GPP recovery occurs in July in response to the largest O3 reduction by shutting down all anthropogenic emissions (figures 2(c) and S3(b)). Although anthropogenic emissions contribute only 45% to the total surface O3, shutting down anthropogenic emissions helps mitigate 79% of total O3-induced ΔGPP during the growing season in YRD. Therefore, exploring the effects of anthropogenic emission controls on O3-induced ΔGPP is of great value for ecosystem health in YRD.

Figure 2. (a) Simulated O3-induced GPP (units: g[C] m−2 d−1) reductions with all emissions. (b) Avoided O3-induced GPP reductions by shutting down anthropogenic emissions in China. The regional GPP changes are shown on each panel. (c) Seasonal cycle of O3-induced regional GPP reductions (units: g[C] d−1) with all emissions (red) and shutting down anthropogenic emissions (green) during the growing season in RYD. The error bars represent low to high O3-damaging sensitivities.
Download figure:
Standard image High-resolution image3.3. Changes of surface O3 by sectoral and regional emission controls
Simulated surface O3 in YRD is influenced by different anthropogenic emission control strategies (figure 3). For 50% anthropogenic emission reductions in industrial and transportation sectors, regional mean surface O3 in YRD decreases by 0.6 and 0.4 ppb during the growing season, respectively (figures 3(b) and (e)). In contrast, regional mean surface O3 increases by 1.0 ppb during the growing season with 50% reductions in agriculture emissions (figure 3(a)). For this specific sector, emissions are mainly in the form of ammonia, the reduction of which does not affect O3 precursors but decrease ammonium and PM2.5 concentrations (figure S4). Consequently, the reductions of aerosols reduce the uptake of HO2 and results in more production of surface O3 (Li et al 2019). As a comparison, reductions of anthropogenic emissions in other sectors such as power and residential have smaller impacts on surface O3 with regional mean changes of 0.2 and 0.1 ppb, respectively (figures 3(c) and (d)).
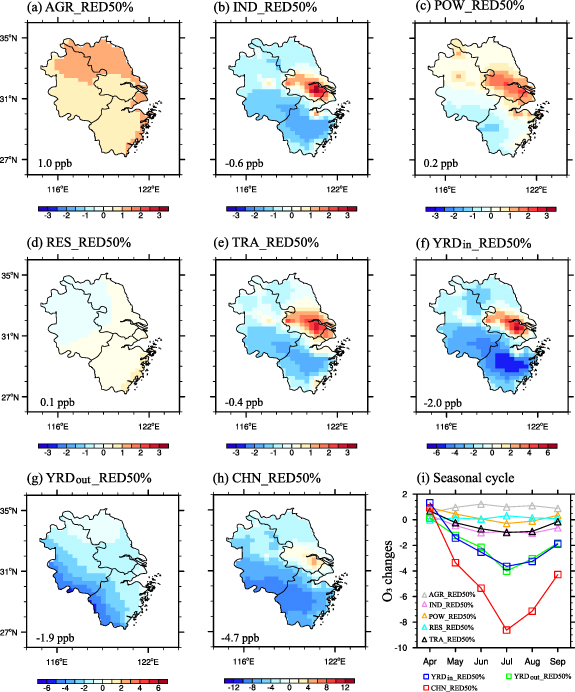
Figure 3. Simulated changes in MDA8 O3 (units: ppb) by sectoral and regional anthropogenic emission controls. MDA8 O3 changes are caused by 50% reductions in emissions from agriculture (a), industry (b), power (c), residential (d), and transportation (e) sources, respectively. Panels (f)–(h) represent MDA8 O3 changes due to reducing 50% anthropogenic emissions inside YRD, outside YRD, and over all China, respectively. The regional mean MDA8 O3 changes are shown on each panel. Panel (i) represents seasonal cycle of regional mean MDA8 O3 changes during the growing season driven by sectoral and/or regional anthropogenic emission controls.
Download figure:
Standard image High-resolution imageCompared to emission controls of a single sector, collaborative emission reductions have better effects in the mitigation of O3 pollution. For 50% emission reductions in all sectors within YRD, regional mean surface O3 shows a large reduction of −2.0 ppb during the growing season (figure 3(f)), which has better mitigation effects than the sum of independent emission reductions of five sectors (figures 3(a)–(e)). This is because that there are inhomogeneous emissions for O3 precursors, such as NOx and VOCs from different sectors. For example, power sector accounts for 20% of total NOx emissions but only <1% of total VOCs emissions. Thus, anthropogenic emission control from power sector means only NOx emissions reductions, which will increase surface O3 in YRD. Regionally, the largest surface O3 reduction of −7.0 ppb is found in central Zhejiang province. However, an increase of surface O3 up to 6.0 ppb is predicted in the south of Jiangsu province when regional anthropogenic emissions are reduced by 50% (figure 3(f)). This is because southern Jiangsu is considered as a VOC-limited regime due to low HCHO/NO2 ratios (Wang and Liao 2020, Li et al 2021, Xu et al 2021). The O3 concentrations in the region would be elevated with the reduced NOx emissions alone or the same proportional reduction of VOCs and NOx emissions (Yang et al 2021). Such phenomenon that O3 increases with the reduction of VOCs and NOx emissions in YRD is also observed during the 2019 novel coronavirus pandemic, which provides a natural experiment to assess the effects of precursor changes on surface O3 (Wang et al 2021, Zhu et al 2021).
Similar to local emission control, the 50% reductions of anthropogenic emissions outside YRD results in a reduction of −1.9 ppb in regional mean O3 concentrations (figure 3(g)). Such change is most significant in the western YRD with O3 reductions exceeding −5.0 ppb. The magnitude of O3 reduction decreases gradually from the west to east, suggesting that regional transport of O3 and its precursors to YRD is mainly from inland areas. As a comparison, reducing 50% anthropogenic emissions over China results in a considerable reduction of −4.7 ppb in regional mean surface O3 over YRD (figure 3(h)), with a spatial pattern merging the O3 changes by 50% reductions of emissions inside (figure 3(f)) and outside (figure 3(g)) YRD.
We further investigate the seasonal variations in O3 changes by different anthropogenic emission controls during the growing season in YRD (figure 3(i)). The results show that O3 reductions driven by regional anthropogenic emission controls, including YRDout_RED50%, YRDin_RED50%, and CHN_RED50% exhibit similar seasonal variations, increasing from April to July and then decreasing. However, there are inconsistent seasonal variations of O3 changes driven by sectoral anthropogenic emission controls. The O3 changes reach a maximum in July for 50% anthropogenic emission reductions in power, transportation, and residential sectors, but in June for 50% anthropogenic emission reductions in agriculture and industry.
3.4. Mitigation of O3 damages to ecosystem productivity
Emission controls bring benefits to the recovery of ecosystem productivity during the growing season in YRD (figure 4). O3-induced regional ΔGPP is mitigated by 3.1 ± 0.4 Gg[C] d−1 with 50% emission reductions from industry sector (figure 4(b)) and 2.2 ± 0.2 Gg[C] d−1 with 50% emission reductions from transportation sector (figure 4(e)). However, 50% emission reductions from agriculture, power, and residential sectors result in additional carbon losses of 5.2 ± 0.9, 0.1 ± 0.1, and 1.4 ± 0.3 Gg[C] d−1, respectively (figures 4(a), (c) and (d)) due to enhanced regional surface O3. The sum of regional ΔGPP is −1.5 ± 0.8 Gg[C] d−1 from the individual emission controls at the five sectors during the growing season in YRD.

Figure 4. Simulated growing-season mean changes in O3-induced GPP reductions (units: g[C] m−2 d−1) by different emission controls. O3-induced GPP changes are caused by 50% reductions in anthropogenic emissions from agriculture (a), industry (b), power (c), residential (d), and transportation (e) sources, respectively. Panels (f)–(h) represent O3-induced GPP changes due to reducing 50% anthropogenic emissions inside YRD, outside YRD, and over all China, respectively. The regional GPP changes caused by changes in O3 are shown on each panel. Panel (i) represents seasonal cycle of regional GPP recovery (units: g[C] d−1) during the growing season in YRD by sectoral and/or regional anthropogenic emission controls. The error bars represent low to high O3-damaging sensitivities.
Download figure:
Standard image High-resolution image
We further explore the impacts of regional and sectoral collaborative emission controls on ecosystem productivity during the growing season in YRD. With the YRDin_RED50% simulation, the O3-induced regional ΔGPP is mitigated by 10.1 ± 1.6 Gg[C] d−1 (figure 4(f)), which is much larger than sum of independent emission reduction in five sectors. Such difference illustrates that collaborative emission reductions in all sectors have larger benefits for the recovery of ecosystem productivity. Although there is smaller surface O3 reduction from YRDout_RED50% than YRDin_RED50% simulations, a larger regional GPP recovery of 18.6 ± 3.5 Gg[C] d−1 is achieved in the former experiment (figure 4(f)). This is because surface O3 reductions from YRDout_RED50% simulation is mainly located in southwestern YRD (figure 3(f)), where the largest GPP is predicted (figure 1(e)). The largest benefit of ecosystem productivity is simulated by reducing 50% anthropogenic emissions in China, which mitigates O3-induced ΔGPP by 33.3 ± 6.1 Gg[C] d−1 in YRD (figure 4(h)).
The seasonal variations in GPP recovery from sectoral and regional anthropogenic emission controls follow those in O3 changes (figure 4(i)). For regional anthropogenic emission controls, the O3-induced GPP losses are mitigated by 43.2 ± 7.2, 19.8 ± 3.1, and 72.2 ± 12.1 Gg[C] d−1 in July for YRDout_RED50%, YRDin_RED50%, and CHN_RED50% simulations, respectively. These numbers account for 39%, 33%, and 36% of total GPP recovery during the growing season in YRD. For sectoral anthropogenic emission controls, the maximum GPP recovery of 6.3 ± 0.8 Gg[C] d−1 occurs in June for IND_RED50% simulation, but 4.7 ± 0.5 Gg[C] d−1 in July for TRA_RED50% simulation. These results indicate that summer months, especially July are the best period for GPP recovery from anthropogenic emission controls.
4. Conclusion and discussion
The land ecosystems of China are undermined by severe O3 pollution in recent years. In this study, we combined GEOS-Chem and YIBs models to assess the benefits to ecosystem productivities from sectoral and regional emission controls during the growing season in YRD. For sectoral emission controls, industry and transportation have larger contributions to the recovery of O3-induced GPP damages than power and residential sectors. Reducing 50% emissions from industry and transportation sectors decrease regional mean surface O3 by 0.6 and 0.4 ppbv, which can mitigate O3-induced GPP losses of 3.1 ± 0.4 and 2.2 ± 0.2 Gg[C] d−1 during the growing season in YRD, respectively. For regional pollution controls, the reduction of 50% anthropogenic emissions outside YRD can mitigate a GPP loss of 18.6 ± 3.5 Gg[C] d−1 during the growing season in YRD, which is higher than the 10.1 ± 1.6 Gg[C] d−1 mitigated by a reduction of 50% in local anthropogenic emissions alone. In addition, anthropogenic emission controls in summer months, especially July can bring larger benefits of GPP recovery than the rest period of the growing season.
The predicted O3 reductions in YRD by shutting down all anthropogenic emission in China are comparable to previous studies (Wang et al 2011, Lu et al 2019). Our simulated GPP recoveries from independent sectoral emission controls are in general consistent with simulations by Unger et al (2020), except that the latter predicted a positive contribution by agriculture emission reductions to mitigating O3-induced carbon losses while we predicted an opposite contribution with negative effects. In the GAINS inventory used in Unger et al (2020), agriculture sector includes NOx , CH4 and NH3 gases, which affect O3 production substantially. However, the agriculture sector in the MEIC inventory used in this study includes only NH3, leading to increases of surface O3 following the decreased ammonium and PM2.5. In addition, compared with global assessment by Unger et al (2020), our regional assessment reveals some new insights for the benefits of GPP recovery from anthropogenic emission controls: (a) the responses of GPP recovery show large spatial heterogeneity. The 50% reduction of emissions from industry and transportation sectors results in a general recovery of O3-induced GPP reductions in YRD, but with regional degradation in eastern Jiangsu province, which is defined as a VOC-limited regime. (b) Compared to emission controls of a single sector, collaborative emission reductions in all sectors have larger benefits for the recovery of O3-induced GPP losses. With 50% emission reductions in all sectors in YRD, the O3-induced regional ΔGPP is mitigated by 10.1 ± 1.6 Gg[C] d−1, which is much larger than sum of independent emission reduction in five sectors. (c) Anthropogenic emission control outside the region is also an effective way to mitigate local O3-induced GPP losses. The GPP recovery by a 50% emission cut outside YRD is about twice that by a 50% emission cut inside YRD. This is because the regional GPP recovery is dependent on both O3 changes and the forest coverage. (d) The efficiencies of anthropogenic emission controls on GPP recovery vary through the growing season. Summer, especially July is the best period for recovery of O3-induced GPP losses by anthropogenic emission controls. (e) The net effect of emission control on GPP recovery is nonlinear. The 50% reduction of all emissions results in a GPP recovery of 33.3 ± 6.1 Gg[C] d−1 in YRD, accounting for only 18% of the total regional GPP losses (figure 2(a)). As a comparison, the 100% reduction of all anthropogenic emissions leads to a GPP recovery of 144.9 ± 31.5 Gg[C] d−1, which is up to 79% of the total GPP loss. Such nonlinearity suggests that only the deep cut of anthropogenic emissions (e.g. >50%) can bring effective benefits to the ecosystem carbon assimilation.
Our study revealed large benefits of recovering ecosystem functions associated with the pollution reduction towards carbon neutrality. Currently, reductions of emissions from industry and transportation sectors brings the largest benefits to the recovery of carbon uptake by land ecosystems in YRD. Such benefits will be much stronger with simultaneous emission controls of multiple sectors and regions than a single sector or from local areas. These gains in carbon sequestration, though likely vary from cities to metropolitans, should be considered to in part offset the large costs in the air pollution regulation. In our current estimate, we applied a constant 50% reduction rate for all emission sectors. However, the cost of emission control varies among sectors and regions, leading to varied reduction percentages for O3 precursors in reality. Therefore, scientific pathways of emission reduction are required and the associated GPP recovery need further investigations.
Acknowledgments
This work was supported by the Jiangsu Science Fund for Distinguished Young Scholars (Grant No. BK20200040).
Data availability statement
The data that support the findings of this study are available upon reasonable request from the authors.
Conflict of interest
The authors declare no competing interests.