


Abstract
Under global warming, terrestrial water resources regulated by precipitation may become more unevenly distributed across space, and some regions are likely to be highly water-stressed. From the perspective of the hydrological cycle, we propose a method to quantify the water resources with potential precipitation capacity in the atmosphere, or hydrometeors that remain suspended in the atmosphere without contributing to precipitation, namely cloud water resource (CWR). During 2000–2017, CWR mainly concentrates in the middle-high latitudes which is the cold zone of the Köppen classification. In a warming world, CWR shows a significant increase, especially in the cold zone. Climate change with Arctic amplification and enhanced meridional circulation both contribute to the change of CWR through influencing hydrometeor inflow. By studying the characteristics of CWR and its influencing mechanisms, we demonstrate a potential for human intervention to take advantage of CWR in the atmosphere to alleviate terrestrial water resource shortages in the future.
Export citation and abstract BibTeX RIS

Original content from this work may be used under the terms of the Creative Commons Attribution 4.0 license. Any further distribution of this work must maintain attribution to the author(s) and the title of the work, journal citation and DOI.
1. Introduction
Cloud, a mixture of liquid water and ice crystals, which is an indispensable part of the atmosphere due to its effects on radiation transfer, latent heat fluxes, and precipitation in the earth-atmosphere system [1–3], is held in the atmosphere as a type of potential aloft water resources. In contrast to mean instantaneous state variables like cloud water path or water vapor content which cannot reflect regeneration and renewal of cloud hydrometeors [4, 5], cloud water resource (CWR) quantifies the accumulation of cloud hydrometeors over a certain region within a given period time (see section 2), which can be interpreted as those hydrometeors participating in the hydrological cycle and remaining in the atmosphere without contributing to ground precipitation but with precipitation potential that can be human manipulated (figures 1(a) and (b)).
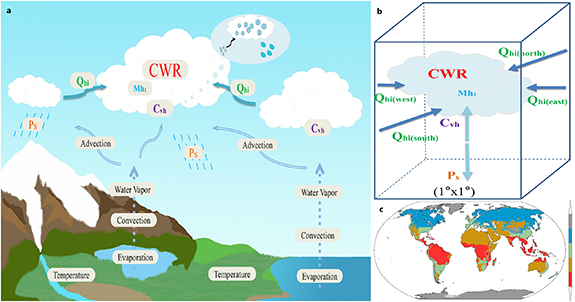
Figure 1. Schematic diagram illustrating the concept of CWR and land subdivision. (a) Schematic background, and (b) abstract grid cell with all component terms. (c) Köppen classification based on temperature and precipitation data from ERA5 during 2000–2017. Color bars represent tropical (red), arid (brown), temperate (green), cold (blue) and polar (gray) zones.
Download figure:
Standard image High-resolution imageGlobal warming accelerates the hydrological cycle [6, 7], but it is less clear what the change will be on CWR. Clearly defining and understanding how the hydrological cycle works and changes exert a far-reaching influence on future climate projections. Precipitation, evaporation, and runoff are often considered as the most important parts, forming the terrestrial hydrological cycle. The terrestrial water resource regulated by precipitation is quite unevenly distributed in space and is expected to become more variable in response to global warming [8, 9]. Model simulation results suggest that global temperatures will continue to rise and extreme weather events such as drought or heatwaves will become more frequent [10–12] and hence, exploring alternative water resources has received a great deal of attention. Addressing water shortages often requires exploring unconventional solutions. It is well known that water vapor from evaporation forms clouds first through phase transformation (condensation and deposition) rather than directly forming precipitation. Cloud hydrometeors as the direct source of precipitation and a key part to string the hydrological cycle tend to be ignored because they are difficult to measure [13–15]. Here we provide a way to evaluate the potential atmospheric precipitation capacity for human intervention over a specific period and area, through artificial precipitation enhancement approaches, such as aerial cloud seeding with dry ice, silver iodide, urea, or salt powder [16, 17].
2. Data and methods
2.1. The Köppen–Geiger climate classification
To understand the regional characteristics of CWR, the Köppen–Geiger climate classification is applied. Global land is divided into five regions, namely, tropical, arid, temperate, cold, and polar [18]. To some extent, the influence of different climatic conditions can be examined by classifying the continents into different climatic types and comparing the variation of CWR in each climatic category. The 2 m temperature and total precipitation of European Centre for Medium-Range Weather Forecasts Reanalysis v5 (ERA5) are used for Köppen classification during 2000–2017 (figure 1(c)).
2.2. The three-dimensional (3D) time-varying cloud water diagnostic quantification method
Our method to quantify CWR is called the 3D time-varying cloud water diagnostic quantification method of CWR based on satellite and reanalysis data [19, 20]. The diagnostic results are mainly based on hydrometeor field products, which are established using CloudSat/CALIPSO satellite data by identifying the relative humidity threshold of cloud area and the profile of cloud water content with temperature. Hydrometeor field products have a total of 21 layers ranging from 1000 hPa to 100 hPa.
For an area defined by a 1° × 1° grid box over one year, CWR is defined as:

where, Mh1, a state term, is the hydrometeor content at the beginning time in computation period terms, which refers to 0000UTC on 1 January of each year here. Since the state term varies greatly with time, the mean mass of hydrometeor (MMh), monthly mean hydrometeor content, over the study period are often studied for long-term research in our study. It is obtained by vertical integration of the hydrometeor field which is the same as the cloud water path often studied in previous work [21, 22]; Qhi, an advection term, is the total input hydrometeor inflow through the four horizontal boundaries of the 1° grid box. The hydrometeor inflow is calculated using the winds field from National Centers for Environmental Prediction/National Center for Atmospheric Research reanalysis data pointing into the inner grid on the boundary times the hydrometer field. The values at each pressure layer are calculated and then the vertical integration is performed; Cvh, a source term, is the amount of atmospheric hydrometeor converted from water vapor through condensation/deposition processes, a diagnostic term estimated by the equation of atmospheric hydrometeor budget; and Ps is a sink term, the total precipitation deriving from the 1° × 1° daily rainfall product of Global Precipitation Climatology Project. Both advection and source/sink terms are the total annual amount for the unit grid cell. The sum of CWR and Ps is called the gross mass of hydrometeors (GMh). In a certain area for a certain period of time, the calculation method of the gross mass of water vapor (GMv) is similar to that of CWR, and its component terms are atmospheric water vapor at the initial time, water vapor horizontal flow, evaporation from the cloud, and surface evaporation. The evaluation and analysis of CWR and other terms are both carried out based on the average over each 1° grid cell accumulated over each year.
3. Results
3.1. Response of CWR to global warming
We study the characteristics of potential CWR and its component terms at the scale of a 1° grid over each Köppen zone (figure 1(c)) and the global land area during 2000–2017. The distribution of the vertical integral of CWR (figure 2(a)) is concentrated in the middle-high latitudes of the Northern Hemisphere, especially in Eastern North America and Western Europe. The equator, along with some South Asia regions, also have higher concentrations than surrounding regions, indicating that there are abundant cloud hydrometeors with the potential to turn to precipitation. In terms of the Köppen classification, the cold zone has the most abundant CWR with a mean grid value of 2.78 × 103 mm (table 1). The amounts of CWR in tropical and temperate zones are 1.50 × 103 mm and 1.76 × 103 mm respectively, while the arid zone has the lowest amount of 0.86 × 103 mm. It is perhaps contrary to the expectation that the tropical zone which is known to be rich in moisture like the mean mass of hydrometeor (MMh, figure 2(b)) or surface precipitation (Ps, figure 2(e)), is not the region with the most abundant CWR. Both CWR and Ps are less abundant in the arid zone. The hydrometeor precipitation efficiency (PEh), the ratio of Ps to the gross mass of hydrometeors (GMh), is high in tropical and temperate zones and low in others (figure 2(f)). The global PEh is about 30.5% over land, of which as high as 53.4% corresponds to the tropical zone. Hence high Ps in the tropics reduces CWR since most hydrometeors contribute to rainfall. Our study shows that a region with the richest moisture substances does not have the greatest unrealized precipitation potential, whereas Western Europe, Northwest North America, Northeast China, and other similar regions have the opportunity to retrieve CWR in the atmosphere as a resource [23, 24].
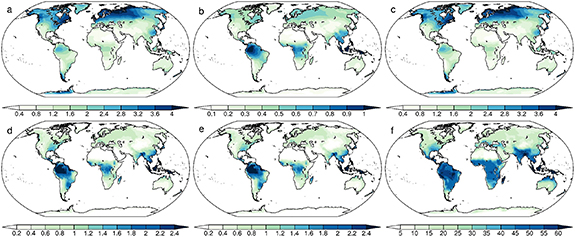
Figure 2. Climatological distribution of the vertical integral of CWR and related parameters for 2000–2017. (a) CWR (103 mm), (b) MMh (mm), (c) Qhi (103 mm), (d) Cvh (103 mm), (e) Ps (103 mm) and (f) PEh (%).
Download figure:
Standard image High-resolution imageTable 1. Means/trends (shaded) of the vertical integration of CWR and related parameters over each Köppen zone and total global land area for the period 2000–2017. CWR (103 mm/102 mm dedade−1), MMh (mm/10−1 mm dedade−1), Qhi (103 mm/102 mm dedade−1), Cvh (103 mm/101 mm dedade−1), Ps (103 mm/101 mm dedade−1) and PEh (%/% dedade−1). * and ** indicate p < 0.05 and p < 0.01 respectively. Only areas between 80° S and 80° N are used in the calculation. All values calculated do not include Antarctica. The linear trends of annual time series for CWR and its component terms are calculated by the least-squares fit regression.
| Tropical | Arid | Temperate | Cold | Polar | Land | |||||||
| CWR | 1.50 | 1.51 | 0.86 | 1.74** | 1.76 | 2.79** | 2.78 | 3.18** | 2.36 | 2.88** | 1.77 | 2.33** |
| MMh | 0.65 | 0.75 | 0.17 | 1.74* | 0.41 | 0.48** | 0.43 | 0.28* | 0.33 | 0.31** | 0.40 | 0.41* |
| Qhi | 1.45 | 1.43 | 0.81 | 1.67** | 1.70 | 2.75** | 2.74 | 3.17** | 2.34 | 2.91** | 1.73 | 2.29** |
| Cvh | 1.83 | −1.64 | 0.32 | 1.59 | 1.16 | −0.64 | 0.66 | 1.43 | 0.46 | −1.45 | 0.89 | 0.31 |
| Ps | 1.79 | −4.17 | 0.28 | 0.74 | 1.11 | −1.92 | 0.63 | 0.89 | 0.45 | −1.42 | 0.85 | −0.84 |
| PEh | 53.4 | 4.05* | 21.5 | −2.76** | 39.8 | −4.34** | 19.0 | −1.70** | 19.7 | −2.35** | 30.5 | −2.96** |
In response to global warming, CWR is rapidly increasing. Not only those regions that are already rich in CWR show strong increases such as Western Europe and North America, but also some water-stressed regions with scarce CWR are also experiencing rapid growth including the Sahara Desert, Western Australia Desert, the Indian Peninsula, the Tibetan Plateau and the Mongolian Plateau (figure 3(a)). The trend distribution of CWR is roughly similar to that of MMh (figure 3(b)). CWR shows an overall increasing trend of 2.33 × 102 mm decade−1, among which the cold zone is increasing at 3.18 × 102 mm decade−1. The tropical zone, due to a decrease near the Amazon Plain and the Congo Basin, shows an overall statistically insignificant growth trend of 1.51 × 102 mm decade−1. Compared with CWR, Ps increases only slowly or even decreases in some regions (figure 3(e)), resulting in a decrease of PEh over land (figure 3(f)). From the perspective of potential atmospheric water resources, increasing CWR on a global scale may increase the potential precipitation resource to be utilized in the future.
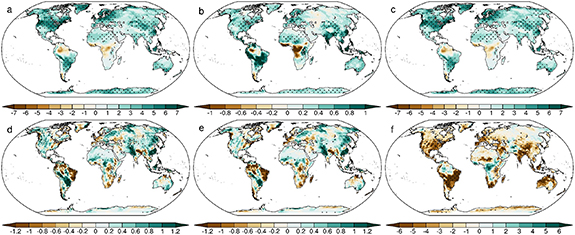
Figure 3. Spatial trends of the vertical integral of CWR and related parameters for 2000–2017. (a) CWR (102 mm decade−1), (b) MMh (10−1 mm decade−1), (c) Qhi (102 mm decade−1), (d) Cvh (101 mm decade−1), (e) Ps (101 mm decade−1) and (f) PEh (% decade−1). Dotted areas show the trend is significant at p < 0.05.
Download figure:
Standard image High-resolution imageSince the magnitude of MMh is small (so is the hydrometeor content at the beginning moment (Mh1) (see section 2)), three orders less than CWR, variations in CWR are mainly determined by hydrometeor inflow (Qhi), condensation in the cloud (Cvh) and surface precipitation (Ps). The distributions of CWR vs Qhi (figure 2(c)), as well as Cvh (figure 2(d)) vs Ps are similar with spatial similarity coefficients exceeding 0.99 (p < 0.01) for both pairs. In addition, similar spatial trend patterns of CWR vs Qhi (figure 3(c)), as well as Cvh (figure 3(d)) vs Ps (figure 3(e)), can be demonstrated by highly correlated temporal anomalies, which further demonstrate their pairwise relationships. In other words, for one year within a 1° grid box, most of the hydrometeors that fall to the ground forming precipitation (Ps) come from the condensation process in the cloud (Cvh), while the remaining hydrometeors (CWR) with potential to form precipitation that suspends in the atmosphere are mainly determined by the horizontal hydrometeor flow (Qhi). As the advection term, changes in Qhi are governed by both dynamic and thermodynamic components [25–27], that is to say, fluctuations in atmospheric circulation and local hydrometeor growth.
3.2. Mechanisms underlying the trend in CWR
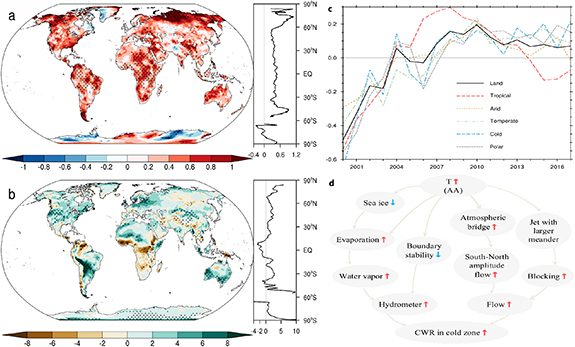
Global warming is indisputable, with land warming of about 1.59 °C in the last decade compared to pre-industrial times [28]. The main effect of temperature changes on hydrometeor growth can be explained in two ways. One is that a warmer environment is favorable for water vapor storage, following the Clausius–Clapeyron scale [7, 29]. An abundance of water vapor is the necessary condition for the formation of hydrometeor and precipitation, which is consistent with the view that warming speeds up the hydrological cycle [30, 31]. Another is that increased temperature will decrease the stability of the boundary layer conducive to the formation of cloud hydrometeors [32, 33]. In high latitudes, most warming is expected to be focused at the surface (due to snowmelt) and so this may destabilize the boundary layer. This is consistent with the largest increases in CWR being in higher latitudes. It is noted that CWR is the most abundant and fastest-growing in the cold zone, with the strongest trends mainly distributed in the middle-high latitudes near the Arctic and the North Atlantic where temperature and precipitable water both increase significantly (figures 4(a) and (b)). Warming is most pronounced in the Arctic, from two to four times the global average in models [28, 34], known as the Arctic amplification [35, 36]. Arctic warming has contributed to the dramatic melting of Arctic ice. Rapid loss of sea ice, leading to prolonged periods of ice-free seas, particularly in the Barents and Kara seas [37], has accelerated evaporation and increased atmospheric water vapor content accordingly. This has led to an increase in low clouds at the margins of the Arctic ocean [38], which can then be transported southwards to high latitude continents by the polar easterly winds [4, 39].
Figure 4. Possible factors contributing to the trend in CWR. (a) The trend of surface air temperature and its zonal mean, unit: °C decade−1. (b) Trend of annual gross mass of water vapor (GMv) and its zonal mean, unit: 103 mm decade−1. (c) Anomaly series of the vertical integral of CWR over each Köppen zone and the entire global land area for 2000–2017. Unit: 103 mm. (d) Schematic summary of thermodynamic and dynamic mechanisms underlying the positive increase in CWR in the cold zone.
Download figure:
Standard image High-resolution image
The global atmospheric circulation controls the unstable regions of the atmosphere, the tracks of cyclones and the direction of large-scale flows, determining the horizontal transport path of water vapor, and cloud hydrometeors [40, 41]. The difference in temperature between the Arctic and mid-latitudes is also a fundamental driver for large-scale weather systems [42]. The reduced meridional temperature gradient could broaden the atmospheric ridge and increase the south-north amplitude of the mean flow, which in turn could admit more intense cyclones with moisture resources through a more varied storm track to interior areas of mid-high latitude continents [43, 44]. Arctic amplification tends to encourage the negative phase of Arctic Oscillation/North Atlantic Oscillation and polar westerly jet stream with larger meanders [45, 46]. Such conditions are favorable for the maintenance of persistent pressure anomalies like the Ural blocking high pressure [43]. In this case, poleward flows carry Atlantic hydrometeors northward through Western Europe while equatorward flows carry hydrometeors formed over warming Barents and Kara Seas southward to the heart of the Eurasia continent. Both Western Europe and Eastern North America can receive moisture from the Atlantic if synoptic conditions are favorable, being relatively flat and free from mountain barriers. Hence onshore flow can carry warm and wet water vapor or clouds from the Atlantic deep into the continental interiors.
4. Conclusions
CWR is defined as all cloud hydrometeors with potential precipitation capacity holding in the atmosphere. Bearing in mind that the increasingly uneven distribution of global terrestrial water resources, we propose a method based on CWR to evaluate the potential precipitation capacity which remains in the atmosphere. The potential resources can be quantified through CWR. There is abundant CWR in the atmosphere that can be potentially retrieved and it tends to increase under global warming (figure 4(c)). Undoubtedly a warming climate can enhance atmospheric water holding capacity and, also reduce atmospheric stability of boundary layer to form cloud hydrometeors. Especially in the cold zone of mid-high latitudes, near the Arctic and the North Atlantic, the Arctic amplification promotes hydrometeors increasing while altering atmospheric circulation which may transfer more hydrometeors from lower latitudes to there (figure 4(d)).
This study successfully used diagnostic methods to estimate CWR, which opens up new perspectives to use other reanalysis products and/or satellite products and/or Earth system models' simulations to study the quantification of uncertainties and future projections of CWR. Although we suspect that both dynamic and thermodynamic factors contribute towards the significant increase in CWR in the early 21st century, we are not able to quantify the relative importance of the two factors at the current time. If CWR can be turned into rain by human manipulation such as cloud seeding, it can help with alleviating terrestrial water shortages in some areas. To realize the potential identified, detailed studies on how much of them can be utilized in practical weather modification applications for different terrain and climate conditions are needed.
Acknowledgments
This study is supported by the National Key R&D Program of China (2016YFA0601702). The authors appreciate the contribution of the European Centre for Medium-Range Weather Forecasts (ECMWF) for datasets that have been generated under the framework of the Copernicus Climate Change Service (C3S, https://cds.climate.copernicus.eu).
Data availability statement
The data that support the findings of this study are available upon reasonable request from the authors.