

Abstract
Pathways toward limiting global warming to well below 2 ∘C, as used by the IPCC in the Fifth Assessment Report, do not consider the climate impacts already occurring below 2 ∘C. Here we show that accounting for such damages significantly increases the near-term ambition of transformation pathways. We use econometric estimates of climate damages on GDP growth and explicitly model the uncertainty in the persistence time of damages. The Integrated Assessment Model we use includes the climate system and mitigation technology detail required to derive near-term policies. We find an optimal carbon price of $115 per tonne of CO2 in 2030. The long-term persistence of damages, while highly uncertain, is a main driver of the near-term carbon price. Accounting for damages on economic growth increases the gap between the currently pledged nationally determined contributions and the welfare-optimal 2030 emissions by two thirds, compared to pathways considering the 2 ∘C limit only.
Export citation and abstract BibTeX RIS

Original content from this work may be used under the terms of the Creative Commons Attribution 4.0 license. Any further distribution of this work must maintain attribution to the author(s) and the title of the work, journal citation and DOI.
The mitigation of climate change is motivated by the risk of large, pervasive and persistent climate impacts. Policies to mitigate climate change in a welfare-optimal way are usually derived in one of two different approaches: cost-benefit analysis (CBA) or cost-effectiveness analysis (CEA). These approaches account for climate impacts in different ways. CBA weighs climate damages against mitigation costs to find optimal temperature levels and climate policies in an integrated model system [1–3]. A comprehensive CBA would require monetizing all climate impacts, including non-market damages. For that to be possible, costs and benefits would have to be traded off in the presence of deep uncertainty about those. Particularly hard to evaluate is the risk of large-scale, irreversible disruptions triggered by warming beyond a threshold value (tipping point) [4]. Examples include the melting of the ice sheets of Greenland and West Antarctica or the dying of coral reefs [4–6]. As a result, many CBA do not account for the risk of climate impacts from crossing tipping points. Accounting for such risks is known to increase the social cost of carbon (SCC) [7].
The second approach, CEA, is used to model pathways that minimize mitigation costs subject to a temperature guardrail. CEA is directly applicable to the climate-policy paradigm of preventing dangerous anthropogenic interference with the climate system [8] and the associated target to keep warming well below 2 ∘C or even 1.5 ∘C [9]. CEA is motivated in part by temperature guardrails beyond which the risk of climate impacts from passing tipping points in the Earth System rises rapidly [10, 11]. Another motivation for temperature guardrails is the precautionary principle: avoiding areas of deep uncertainty about climate impacts where trade-offs between costs and benefits of mitigation can no longer be properly assessed [8, 12]. In its Fifth Assessment Report [13] and Special Report on Global Warming of 1.5 ∘C [14], the Intergovernmental Panel on Climate Change used insights from a type of CEA model, detailed-process integrated assessment models (IAMs) [15], for its climate mitigation scenario assessment. In contrast to CBA, CEA does not account for any climate impacts that occur below the temperature guardrail.
The omission of damages in CEA is becoming more relevant, as empirical evidence of on-going climate impacts accumulates. Gradually intensifying impacts of climate change include, for example, changes in agricultural yields, water availability, the occurrence and intensity of extreme events, sea-level rise, effects on health, labor productivity, and ecosystem services [16]. Many of these already occur throughout societies and economies today [17]. There is evidence that such gradual impacts from climate change cause persistent socio-economic damage, for example by affecting long-run economic growth or societal stability [17–20]. The uncertainty about the long-term consequences of such gradual climate damages, however, remains large.
Figure 1 compares CBA with CEA by contrasting their damage functions. The damage function in CBA models is continuous and is an explicit element of the analysis. By contrast, the damage function implied by CEA assumes no damages below the temperature limit and infinite damages above that. CBA and CEA can be combined into the least-total-cost (LTC) approach. LTC pathways are welfare-optimal climate change mitigation strategies for staying below a temperature limit in the presence of gradual climate-change damages that already occur below this temperature limit [21, 22].
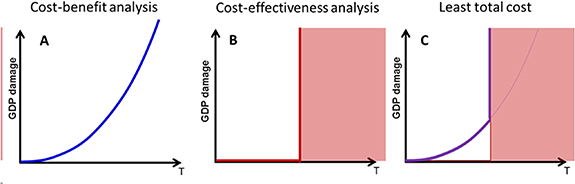
Figure 1. Explicit or implicit economic damage functions in climate policy analysis. CBA accounts for gradual economic damages in deriving optimal climate change mitigation pathways (A). CEA seeks to minimize mitigation costs for limiting warming below a threshold, implicitly assuming zero damages below and infinite damages above the threshold (B). Least-total cost (LTC) analysis combines the two: the resulting welfare-optimal policy accounts for damages occurring below the temperature threshold and limits warming to below it.
Download figure:
Standard image High-resolution imageThe three main contributions of this study are: first, we construct a new damage function based on recent empirical damage estimates that explicitly reflects uncertainty about the long-term persistence of such gradual climate damages. Second, we develop a new technique for implementing LTC pathways in an IAM with high process detail in mitigation technologies. Third, we derive implications for emissions pathways and near-term ambition for international climate policy.
1. Persistence of climate damages and the social costs of carbon
Empirical studies quantify impacts of global warming on economic output. Recent studies find impacts through changes in the growth rate of GDP with increasing temperatures [18, 23–27]. These studies are not conclusive about whether the income reductions due to such growth damages are temporary ('level effect') or permanent ('growth effect'). The presence of growth effects implies a slow or no recovery from income damages from global warming.
Most integrated analyses of impacts and mitigation model damages as level effects only. This is implemented as a contemporaneous reduction in economic output through a damage function [3, 28, 29]. The damage function in a given year is affected only by temperature in that year, but not by temperatures in the past. In such models, economic growth is, except through investment effects, not affected by rising temperatures. These studies commonly find moderate overall damages and costs from global warming.
A number of recent studies model climate impacts on the growth rate of output. Such studies find much higher overall damages [24, 30] and consequently recommend more stringent optimal mitigation action [31–36]. For more details about how the model we use differs from DICE-like models, see the comparison in the next section.
Two controversial aspects in these studies are the application of empirical estimates for out-of-sample temperatures that are expected to occur in the future and the implied total lack of adaptation despite continually increasing climate impacts [30, 38]. We address this issue with the introduction of a finite persistence time for damages.
The question of whether level or growth effects are dominant—with the resulting stark differences in the long-term consequences—is thus a key uncertainty for the long-term economic impacts of global warming [39]. Piontek et al [40] show that cumulative climate damages depend on the persistence of annual climate impacts. This persistence depends, in turn, on whether impacts affect output, production factors, or labor productivity. A comprehensive empirical quantification of these damages channels is not published. Consequently, our study includes the persistence time, which is defined as the typical time a damage in a given year persists into the future, as a parameter. This parametric approach to macro-economic damages reflects uncertainty due to different economic impact channels and the scope for adaptation under future climate change. A range of persistence times interpolates between level effects (a persistence time of zero) and growth effects (a persistence time of infinity). For this study, we choose a range of persistence times from 5 to 30 years (see the supplementary material (available online at stacks.iop.org/ERL/16/104053/mmedia) for more details). This allows mapping out the consequences of the damage uncertainty for mitigation policies.
To compare different empirical damage specifications and persistence times, we calculate the SCC, that is, the damage caused by the additional emission of one ton of CO2. We use the IAM REMIND to derive the SCC in a CBA. The persistence time strongly influences the SCC (figure 2): the SCC is 201 $(tCO2)−1 for the original specification from Burke et al [24] (abbreviated BHM15) with its infinite persistence time. This is consistent with the results of Ricke et al [30]. For a persistence time of zero years, the SCC is only 9 $(tCO2)−1. The damage function from the DICE2016 model, in comparison, yields an SCC of 11 $(tCO2)−1 in our model.
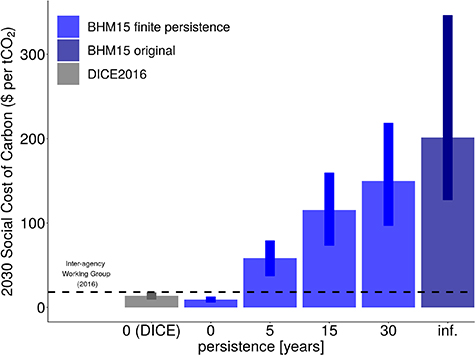
Figure 2. The social costs of carbon in 2030 critically depend on the persistence of damages. Calculated from a CBA using the REMIND model, for different damage functions. Persistence times are 5, 15, and 30 years. Ranges are the 20–80th percentile interval over the two empirical damage specifications from BHM15 (see supplement for details) and climate uncertainty. Infinite persistence is the original specification from BHM15. A persistence time of zero and the DICE2016 [37] damage function are included for comparison. The dashed line is the value of the SCC put forward by the Interagency Working Group on Social Costs of Greenhouse Gases (for a discount rate of 5%).
Download figure:
Standard image High-resolution imageConsistent with the CBA literature [34, 35], the resulting level of warming in our model is 1.7 ∘C above pre-industrial for the original BHM15 damage function with infinite persistence. By contrast, using the DICE2016 damage function (which has no persistence of damages) in our model results in a warming of 2.7 ∘C above pre-industrial 8 .
2. Modeling mitigation pathways with climate damages
We use the IAM REMIND [42, 43] to derive welfare-optimal transformation pathways. The model is a welfare-maximizing, Ramsey-type general equilibrium model with 12 world regions that spans the 21st century [44, 45]. REMIND includes an energy system model that captures inertia and path-dependencies by representing more than 50 energy conversion technologies as capital stocks. Energy prices reflect resource scarcities, resource trade, and final energy taxes. The combination of both detailed abatement options and long-term scope allows for the assessment of near-term climate policies compatible with long-term climate targets [46–48]. The most relevant greenhouse gas emissions in energy and land-use systems are accounted for [43].
We use MAGICC6 [49] as a climate model. It is coupled to REMIND, to translate greenhouse gas emissions into global mean temperature change. MAGICC6 emulates the results from atmosphere-ocean general circulation models well [50] and has been used by the Intergovernmental Panel on Climate Change [13].
Temperature increase is approximately linear in cumulative CO2 emissions, though this relationship is subject to large uncertainties [49, 51–53]. These uncertainties are accounted for by sampling from different MAGICC6 parameter configurations representative of the spread in temperature outcomes (see supplementary figure 4). From a probabilistic run of MAGICC6 with 600 outcomes for an RCP2.6 emissions scenario, we select MAGICC6 configurations at certain percentiles of the temperature distribution in 2100. To quantify the influence of climate uncertainty in our results, we run the model framework using configurations at the 5th, 30th, 50th, 70th, and 95th percentile. Regional temperatures, which drive the damage functions, are derived from global mean temperature using a statistical downscaling based on CMIP5 results [54] (section 3 of the supplementary material).
The linked system of macro-economy, energy- and land-system, climate and climate damages is solved ensuring full consistency between the various model components (figure 3).
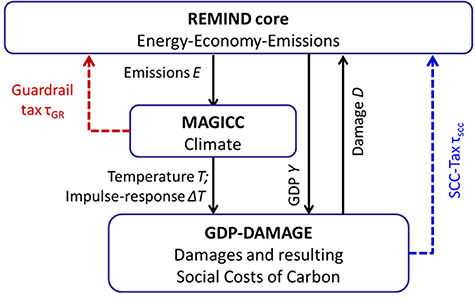
Figure 3. Illustration of the IAM REMIND. Emission and GDP pathways derived in the REMIND core model are fed into the climate model MAGICC6; resulting in temperature and the temperature impulse responses. Climate damages, the SCC and the guardrail tax are calculated from this information, and used in the next iteration of the REMIND core model. At the fixed point of this iteration, the solution is the same as if a single numerical optimization model was run (supplementary material, section 2).
Download figure:
Standard image High-resolution imageIn contrast to DICE-like IAMs [3, 35, 55], REMIND has the climate system and mitigation technology detail required to describe near-term climate policy. Capturing the effect of starkly declining emissions over 10 or so years requires a climate model with good temporal resolution [56]. The MAGICC6 climate model has annual time resolution, as compared to the 10-year resolution of DICE. Furthermore, studies show that DICE significantly underestimates the short-term temperature response to emissions [57]. Emissions pathways compatible with 2 ∘C often include negative emissions, which DICE does not allow for.
The emissions reductions required for 2 ∘C pathways require large-scale investments and a restructuring of the global energy system within a couple of decades. Parameterizing the mitigation costs of such a transition, as DICE does, misses several key effects: capital stocks in the energy system often have very long depreciation times. Furthermore, many energy technologies show cost reductions through R&D investments and learning-by-doing effects. This creates path dependencies. Mitigation costs thus depend on the rate of emission reduction. REMIND tracks the regional age structure of capital stocks in the energy system. Assets stranded by climate policy thus contribute to mitigation costs in our model. To capture rapid technological change, endogenous learning-by-doing effects are included. Even though we do not show regional results, the regional resolution of the model makes for better modeling of near-term emission pathways. Regions have different mitigation potentials and pre-existing climate policies as of today, which are included in the model. Consequently, detailed-process IAMs are often used in international climate policy assessments [13, 14].
3. Welfare-optimal pathways for gradual damages and a temperature guardrail
The SCC accounts for gradual climate damages based on empirical estimates. Instead, the temperature guardrail of the Paris Agreement is largely motivated by the precautionary principle, in view of tipping elements and potentially unknown climate impacts if warming increases beyond the range experienced in the Holocene [10].
Our model framework includes both gradual damages and a temperature guardrail (figure 1(c)). LTC pathways minimize the sum of costs from climate damages and mitigation activities for limiting warming to below the guardrail. The theoretical literature suggests that in the presence of both climate damages and a temperature guardrail, the welfare-optimal carbon price is the sum of the SCC and a price component related to the temperature guardrail [22]. In our LTC pathways, the carbon price is the sum of the SCC and a price component we call the guardrail tax. We derive analytical expressions for both price components in a reduced model (i.e. the relevant first-order conditions of the optimization problem), evaluate them using variables from the REMIND and MAGICC6 models and iteratively price them into REMIND as taxes on emissions (for technical details, see section 2 of the supplementary material). The welfare-optimal carbon price in our framework is thus the sum of the SCC and the guardrail tax at the solution point of our model framework.
We implement the temperature guardrail as a limited CO2 budget until the time of CO2 neutrality; the stringency of this budget approximately determines the temperature at peak warming [58]. As an implementation of the 2 ∘C limit we use a budget of 1300 Gt CO2 from 2011 onward, which is derived from the budgets given in chapter 2 of the Special Report on Global Warming of 1.5 ∘C [14] for 67% likelihood of stabilizing below 2 ∘C. The guardrail tax grows exponentially at the interest rate, following Hotelling's rule, as long as cumulative emissions are below the budget [13, 58]. After the budget constraint is reached, which happens around 2070 in most pathways, the level of the guardrail tax is adjusted to keep CO2 emissions to zero. The carbon price is levied on CO2, CH4, and N2O emissions, aggregated using global warming potentials [59], and implemented from 2025 on. The carbon price is globally uniform, as the socially optimal policy takes into account the global effects of each region's emissions. The tax revenue is redistributed as a lump-sum to the single representative household of each region.
To better understand the distinctive features of LTC pathways, we also implement CEA pathways, which minimize only the cost of limiting warming to below a temperature guardrail. Gradual climate impacts still do occur in the CEA pathways, but are not reflected in the carbon price. The carbon price in CEA consists only of the guardrail tax. LTC pathways are welfare-optimal ('first-best') in the sense that both the temperature target and climate damages are both fully internalized, and consequently accounted for in the carbon price. By contrast, CEA pathways are not welfare optimal ('second-best') in the sense that although the temperature target is internalized, climate damages are not. Consequently the CEA carbon price does not include the SCC, even though climate damages are present.
Three key components of uncertainty are included: (i) the persistence time in the damage function; (ii) physical uncertainties in the climate system; (iii) future socio-economic, demographic, technological and institutional development.
The damage function uses estimates from two empirical specifications from BHM15 for the reduction of GDP growth through local temperature changes, referred to as 'long-run' and 'short-run' changes. We express the uncertainty over the persistence time scale by using a model ensemble with persistence times of 5, 15, and 30 years, as well as their original estimate (with the implied infinite persistence time). Together, the product of two empirical specifications and four persistence times yield eight damage specifications that span the damage-related dimension of the ensemble of model runs.
Physical uncertainties in the climate system are covered by sampling configurations of the MAGICC6 model along temperature outcomes. Different possible future socioeconomic trends are represented by different assumptions described by the shared socioeconomic pathways (SSPs) 1, 2, and 5 [60, 61]: Sustainable development in SSP1, a fossil-fuel intensive high growth scenario in SSP5, and the middle-of-the-road scenario SSP2. Assumptions for the global population in 2100 stretch from 7 to 9 billion [62] across scenarios. GDP per capita in 2050 is around twice as high in SSP5 as in SSP1 [63]. Energy demand in 2100 is assumed to be more than double and baseline emissions are around double already in 2050 in SSP5 compared to SSP1 [61]. Baseline radiative forcing in 2100 is slightly above RCP8.5 for SSP5, indicating high challenges, and somewhat below RCP6.0 for SSP1, indicating lower challenges for mitigation [61]. Lower challenges decrease the mitigation costs for a given climate target [64].
The SSPs thus form a range of scenarios with different mitigation costs, but other factors contribute to mitigation cost uncertainty as well. For example, uncertainty about technological availability and costs is known to be a strong determinant of mitigation costs [36, 65]. For this study, we assume that all mitigation technologies are fully available. Partial, or delayed availability of mitigation technologies increases mitigation costs [13, 65].
We sample 80 runs of the REMIND model system along the damage and climate physics uncertainty dimensions under SSP2 as the ensemble for the main results. We do so because SSP2 shows the least divergence from socioeconomic preferences and rates of technological improvement observed in the past [66]. Additionally, we sample 80 runs each for SSP1 and SSP5 for a sensitivity analysis in the socio-economic dimension. In total, there are 240 runs. We summarize this ensemble of model runs into median pathways and percentile ranges to express uncertainty.
4. Near-term emission reduction efforts and the adequacy of the nationally determined contributions
The difference in near-term carbon prices between LTC and CEA pathways for the 2 ∘C limit is shown in figure 4(a). In 2030, the LTC carbon price is 115 (85–218) $(tCO2)−1, compared to 61 (57–63) $(tCO2)−1 in the CEA case (medians and 20–80th percentile range of the ensemble for SSP2 only; all dollar values are US$2015.). Whereas the CEA carbon price rises exponentially over time, the LTC carbon price rises much slower (figure 4(b)). A consequence of the high near-term ambition in the LTC pathway is that in the long term, much lower carbon prices are required to reach the 2 ∘C target than in the CEA pathway.

Figure 4. Carbon prices for 2 ∘C in welfare-optimal LTC pathways (blue) are higher in the near-term than for CEA (red). (a) Median carbon prices in 2030 are 115 (85–218) $(tCO2)−1 for LTC, significantly above the 61 (57–63) $(tCO2)−1 for CEA. The range in brackets are the 20th–80th percentiles across the scenario ensemble, also indicated in dark ribbons in the plot; light ribbons are the min–max range. (b) Higher near-term carbon prices of LTC are mirrored by lower prices from 2050 on; ribbons as in (a). (c) Effect of different socio-economic baselines. (d) Uncertainty decomposition of the full ensemble of 240 runs into contributions of socio-economic baseline, climate, and impact specifications.
Download figure:
Standard image High-resolution imageThese results are robust against different socio-economic baselines: larger challenges for mitigation in the socio-economic baseline, such as in SSP5, require higher carbon prices than baselines with lower challenges to mitigation, such as SSP1, to meet the 2 ∘C limit (figure 4(c)). The SSP5 scenario describes a future with high economic growth and high energy demands, as well as an abundant and cheap supply of hydrocarbons [67]. Both factors combined require a higher carbon price to keep emissions within the budget for the 2 ∘C target. This is consistent with results of earlier studies [61].
The range of 2030 carbon prices is dominated by uncertainty about the damage function in LTC pathways, whereas uncertainty about socio-economic baselines explains most of the range of CEA carbon prices of the full scenario ensemble (figure 4(d)). Compared to the range of LTC pathways, the range of CEA pathways is much smaller 9 .
Near-term emissions are lower in the median LTC pathway than in the CEA counterpart (figure 5). In 2030, global CO2 emissions are 28 (23–31) GtCO2 for the median LTC pathway, compared to 33 (33–33) GtCO2 for CEA. The near-term ambition of the median LTC pathway is similar to 1.5 ∘C pathways with temperature overshoot from the SR1.5 (median 29.1 GtCO2), whereas the CEA pathway is in line with their higher-2 °C scenarios (median 33.5 GtCO2). The gap between 2030 emissions projected under the currently pledged nationally determined contributions (from the SR1.5 database[14]) and the welfare-optimal LTC pathway for the 2 ∘C limit is two thirds larger compared to what the CEA assessment indicates. In the median LTC pathway, the average emission reduction rate from 2020 to 2030 is 3.2% yr , almost double the rate of the median CEA pathway, indicating the much higher near-term mitigation effort.

Figure 5. Global CO2-only emissions for 2 ∘C in welfare-optimal LTC pathways (blue) are below emissions for CEA (red) in the near term. Projections under the nationally determined contributions (NDCs) (yellow) are included. (a) Median emissions in 2030 are 28 (23–31) GtCO2 yr−1 for LTC, significantly below the 33 (33–33) GtCO2 yr−1 for CEA, increasing the gap to the NDCs. The range in brackets are the 20th–80th percentiles, also indicated in dark ribbons in the plot; light ribbons are the min–max range. (b) Lower near-term emissions of LTC are mirrored by higher emissions from 2050 on. (c) Effect of different socio-economic baselines on 2030 emissions. (d) Uncertainty decomposition of the full ensemble of 240 runs into contributions of socio-economic baseline, climate, and impact specifications. See supplementary figure 3 for a plot that includes many greenhouse gases.
Download figure:
Standard image High-resolution image
To sum up, CEA pathways systematically underestimate the optimal near-term policy ambition and overestimate the long-term ambition if climate damages are non-negligible below warming levels of 2 ∘C. This conclusion holds for other temperature limits as well, but the difference between LTC and CEA decreases for lower temperature limits, with only a minor effect remaining for 1.5 ∘C pathways (supplementary figure 5).
5. Discussion
Our main results are consistent with related findings in the literature. In particular, [36] find that accounting for damages in Paris-compatible mitigation pathways doubles near-term carbon prices, very close to our results. Both studies analyze the drivers of the uncertainty of optimal carbon prices. Whereas they find that damage and mitigation cost are the largest drivers of uncertainty in the near-term, damage specification are the largest factor in our results. They model a broader range in the uncertainty of mitigation cost and discount rate than our study. Our study, by contrast, allows for more credible modeling of near-term carbon prices due to the process-detailed model (see the discussion above for details).
6. Conclusion
Climate change mitigation policies, in particular the ambition of mitigation efforts in the current decade, not only influence the likelihood of meeting the temperature limit set forth in the Paris Agreement, but also the severity of climate impacts. Whereas the policy debate largely focuses on the impacts beyond the 1.5 ∘C and 2 ∘C thresholds, near-term impacts at lower warming levels can be substantial and have persistent consequences beyond their immediate effect.
This study combines recent empirical damage estimates and modeling of the persistence time, a key uncertainty, into a new damage function. This damage function is evaluated within an IAM with high technological detail and a state-of-the-art climate model. We demonstrate that welfare-optimal mitigation pathways, which minimize the sum of damage costs and mitigation costs for a Paris-based temperature guardrail, result in substantially greater near-term mitigation efforts than a pure cost-effectiveness pathway. A pure cost-effectiveness pathway, which postpones climate policy ambition until later in the century, achieves the 2 ∘C target at higher cost than least-total cost pathways.
Future research could include damages beyond reductions in economic output. To reduce the uncertainty over optimal policies, it is crucial to further the empirical understanding of impact channels, their persistence over time, and adaptation.
Climate impacts, mitigation costs, and adaptive capacity vastly differ across regions and households. The cost-optimal policies derived in this paper do not reflect within-region inequalities in income, impacts, and mitigation costs. Reflecting such concerns in social welfare is known to change the optimal policy [68, 69]. In particular, a regressive incidence of climate impacts without appropriate compensation mechanisms has been found to increase the SCC [70], which would further increase the difference between cost-effectiveness and least-total cost pathways. On the mitigation side, a redistribution of the carbon price revenues could offset or reverse a regressive policy incidence [71, 72]. An improved modeling of inequality along both the mitigation and impact dimensions, and also of adaptive capacity, are important directions for future research.
Despite the significant uncertainties, our results have important implications for climate policy. Previous research based on CEA has pointed out the inadequacy of currently committed mitigation efforts to achieve the Paris Agreement at the lowest cost. Our results demonstrate that the gap between current climate policy efforts and optimal pathways is larger than previously thought, as soon as climate damages below the temperature limit are taken into account. We argue that the least-total cost approach should be used to inform climate policy-making, in particular with respect to near-term action.
Data availability statement
The data that supports the findings of this study are available upon reasonable request from the authors.
Acknowledgments
A S and F P received funding from the Leibniz Gemeinschaft through the ENGAGE project. F P also acknowledges funding through the CHIPS project, part of AXIS, an ERA-NET initiated by JPI Climate, funded by FORMAS (SE), DLR/BMBF (DE, Grant No. 01LS1904A), AEI (ES) and ANR (FR) with co-funding by the European Union (Grant No. 776608). A S thanks Anastasia Linnik for comments that helped improve the manuscript.
Author contributions
A S and G L conceived the research idea and the method to integrate climate impacts into the model framework. A S, in close collaboration with G L, led the study, derived the analytical expressions for the optimal taxes, and implemented the model framework. A S, F P and B S performed the model runs, analyzed the results and produced the figures. J R contributed to the climate system modeling and provided uncertainty parameterizations of the MAGICC6 model. A S and G L wrote the paper with contributions from all other authors. O E and E K supervised the project and contributed to the framing of the article.
Author information
The authors declare no competing financial interests. Correspondence should be addressed to A S.
Footnotes
- 8
In recent literature, parameter updates for the DICE model [41] yield optimal temperatures below 2 ∘C.
- 9
Additionally including the uncertainty in the carbon budget increases the uncertainty for CEA pathways (see supplementary figure 5 for other temperature targets).