

Abstract
Green Roofs (GRs) are one of the measures considered for Urban Heat Island (UHI) mitigation. The cooling effects of GRs are well studied in the literature. However, previous work has not addressed the impacts of GRs on heavy rainfall in cities. This study develops and tests the hypothesis that incorporating green roofs in urban areas enhances the magnitude of rain for heavy rainfall events. To test this, examples of heavy rainfall events over three different years are examined over Mumbai, India, one of the megapoleis that continues to witness heavy rains and urban flooding. The heavy rain events are simulated using Weather Research and Forecasting (WRF) model for different green roof fraction (GF) scenarios (10%, 25%, 50%, 75%, and 100%) over the urban area. The GF simulations are compared to the 'no GF' simulation (control run). The results indicate a consistent increase (1%–72%) in the total accumulated precipitation in all GF scenarios. Additional moisture and increased equivalent potential temperature aided the formation and sustenance of localized pockets of enhanced rain occurrences, contributing to the total amount of rainfall for the rain events for the domain. The increase in rainfall amounts leads to higher runoff and can increase the risk of flash floods. Thus, it is necessary to account for this rainfall-based feedback of GR before adopting it as a mitigation option. The results of this work may be helpful in effective urban planning and managing the urban climate extremes.
Export citation and abstract BibTeX RIS
1. Introduction
Urban environments are facing numerous consequences of climate change, including increased heat (Bazaz et al 2018), enhanced precipitation (Shepherd 2005, Liu and Niyogi 2019), heatwaves (Meehl and Tebaldi 2004, Russo et al 2014), and droughts (Zhang et al 2019). The precipitation patterns are affected by urbanization by altering the moisture, thermodynamical, and microphysical processes (Oke et al 2017). For example, a case study over Beijing, China, showed that the urban heat island intensity (thermal effect) plays a vital role in determining the impact on the rainfall (Zhang et al 2017). Also, the bifurcation of thunderstorms and rainfall enhancement in and around the city is well documented (Niyogi et al 2011, Dou et al 2020). A meta-analysis of the different urban rainfall modification studies globally is available in Liu and Niyogi (2019).
In response to these growing urban hazards, attention has been growing towards the mitigating aspects of green urban infrastructure, including a hybrid of green and built environments (Gill et al 2007). Green infrastructures such as forests, parks, green roofs (GRs), and walls help increase human comfort and contribute to ecosystem resilience (Aliaga et al 2013, Kim and Song 2019). In highly dense urban areas, due to the non-availability of space for parks, GRs have been considered one of the promising mitigation options that cover the roofs of the buildings with soil and vegetation (Shafique et al 2018). Green roofing is typically done by two methods: intensive and extensive, depending on the substrate material (Santamouris 2014, Morakinyo et al 2017). Intensive GR is suitable for moderately large trees with deep soil layers and typically requires maintenance through fertilizers, weeds, and water. At the same time, extensive GR is used for small plants requiring thin soil layers. Extensive GR generally requires less maintenance, though they sometimes require irrigation and fertilizers (Berndtsson 2010).
Some of the benefits of using GR include the reduction of water flows in case of a flash flood event by trapping the rainfall as an interception loss (Beck et al 2011, Stovin et al 2013), increase thermal comfort by reducing the urban heat island (Susca et al 2011, Dong et al 2020), reduction of carbon footprint (Kotsiris et al 2019), and increase in efficiency of buildings (Niachou et al 2001, Parizotto and Lamberts 2011, Jaffal et al 2012). The effectiveness of GR has been investigated using different modeling techniques, including building energy use (Fang 2008, Fioretti et al 2010) and hydrological modeling (VanWoert et al 2005, Mentens et al 2006, Hilten et al 2008, Carson et al 2013).
GR may also lead to some undesired, negative impacts. For example, a case study for Chicago, USA, by Smith and Roebber (2011) showed that GR could reduce the land temperature leading to the weakening of lake-breeze circulation, impacting the pollutant flushing due to ventilation in the city. Moreover, potentially decreasing the natural cooling effect during the warmest days of the year. Jim and Tsang (2011) conducted a green roof study over Hong Kong by monitoring the microclimate and soil parameters, suggesting that the GR could be more effective for the temperate climate than the tropical regions.
Most of the studies mentioned above have focused on the temperature, urban heat island, and runoff effects of GR. In contrast, no studies are found that ascertain the impacts of GR on the coupled urban rainfall and is the focus of this study. The Weather Research and Forecasting (WRF) model is used to evaluate GR's effects on rainfall over Mumbai, India. The experiments are carried out for different green roof fractions (GF) scenarios compared with a control (non-GF) simulation for different observed heavy rain events.
2. Methodology
2.1. Study area
Mumbai is considered economic capital located on the west coast of India. As of 2018, the city spans over 705 km2, with a population of nearly 20 million, and is expected to increase to 24 million by 2030 (UN 2018). The annual rainfall for Mumbai is 2373 mm, out of which 95% is during the monsoon season from June to September (IMD 2019). The east of the city is surrounded by 'Western Ghats' mountains, and a coastal setting in the west makes it vulnerable to frequent storm surges and flooding (Grossman and Durran 1984, Kumar et al 2008).
2.2. WRF model configuration
The study used the WRF model with Advanced Research WRF dynamic core (WRF-ARW; version 3.9.1.1; Skamarock et al 2008). The model was configured with three nested domains. The outermost domain's spatial resolution was 9 km with 163 × 141 grid points, the first nested domain at 3 km with 316 × 295 grid points, and the second nested (innermost) domain at 1 km with 352 × 352 grid points. The model was set up using two-way nesting and 38 vertical levels with 9 levels within 850 hPa. Figure 1 shows (a) the domain configuration, along with topography. The Moderate Resolution Imaging Spectroradiometer (MODIS) LULC available with the WRF-ARW is used along with urban Local Climate Zones (LCZ, Stewart and Oke 2012). The LCZs for the region is obtained from Patel et al (2020) that improves the urban land surface representation by classifying the urban surface based on the height and packing of the buildings, surface cover around the building and thermal properties of the material (Brousse et al 2016, Patel et al 2020). The LULC map with MODIS and urban classes replaced with LCZs is shown in figure 1(b). The LCZ over Mumbai (shown in solid black line) majorly consists of compact high-rise, compact mid-rise, compact low rise and lightweight low-rise. The heavy industries and large low-rise zones are located outside the city.
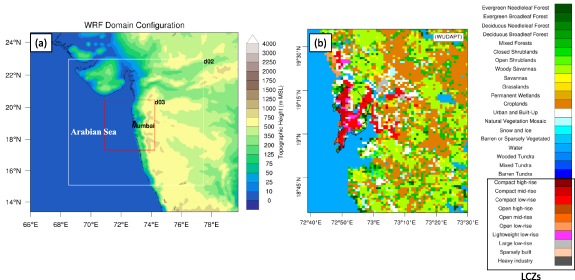
Figure 1. (a) WRF domain configuration with topography in the background. (b) Land use/land cover used in the simulations.
Download figure:
Standard image High-resolution imageThe National Centers for Environmental Prediction Final Operational Model Global Tropospheric Analyses (NCEP FNL) data (available at http://rda.ucar.edu/datasets/ds083.2) was used as initial and boundary conditions, which is available at the six-hourly temporal and 1-degree spatial resolution. The physics options used were as follows: Radiation Shortwave and Longwave parameterization follow Dudhia (1989) and rapid radiative transfer model of Mlawer et al (1997), respectively. The land surface scheme used the Noah Land Surface Model (Tewari et al 2004) with the single-layer urban canopy model (SLUCM) as the urban scheme and Bougeault and Lacarrere (1989) planetary boundary layer parameterization. The Grell-3D (Grell 2002) cumulus scheme was used for the outer two domains. In the case of the innermost domain 3, explicit cumulus representation was used due to the fine grid spacing. Thompson et al (2008) was used for the could aerosol and microphysics processes. The selection of physics options was based on prior work over the study domain (e.g. Patel et al 2019, 2020).
The green roof simulations are performed following Yang et al (2015). Firstly, a grid cell is divided into the vegetated and urban partitions (based on the urban fraction). The Noah model simulates the vegetation feedback, and the urban section uses SLUCM. In SLUCM, the urban landscape is further divided into ground, wall, and roof sub-modules. In green roof simulations, the roof component is additionally separated into a fraction of the green roof. Additional information related to the parameterization, model configuration, and parameters represented variables are provided in equations (1)–(4) and (8) of Yang et al (2015).
2.3. Synoptic of the events
In this study, three heavy rainfall events from 2013, 2014, and 2017 years were considered. The events were chosen as typical examples of heavy rainfall over Mumbai during the southwest monsoon's active phase. In the 2013 event, a low-pressure trough shifted from north Gujarat (north of Mumbai) towards Mumbai, and the presence of orography in the east led to the convergence (Lei et al 2008a). Mumbai received a mean rainfall of 308 mm from 0530 13 June 2013 to 0030 17 June 2013 Local Standard Time (LST) (+0530 GMT). For the 2014 event, average rainfall of 252 mm, occurred from 0530 13 July 2014 to 0030 17 July 2014 LST primarily due to a cyclonic circulation over the northeast of the Arabian Sea and south of Gujarat. In 2017 event, a low-pressure region over the Bay of Bengal was extended inland to central India. Simultaneously, the presence of a mid-tropospheric cyclonic (MTC) circulation over Gujarat caused the shifting of the low-pressure area towards Mumbai. The active monsoon trough moved from the Arabian Sea towards the west coast, causing convergence over Mumbai, leading to an average of 363 mm of rainfall from 0530 27 August 2017 to 0030 30 August 2017 LST. For more information related to the events, refer to the supplementary information figures A1–A3 (available online at stacks.iop.org/ERL/16/074051/mmedia).
2.4. Experimental design and evaluation
A control WRF simulation without any GF was performed for all three events. The GR simulations include the GF of 10%, 25%, 50%, 75%, and 100%. The experiments were conducted using the same WRF configuration. Hence, a total of 18 (three events and six scenarios) simulations were performed. The choice of using a higher percentage of GF follows Sharma et al (2016), where a large percentage of the GF was needed to have noticeable effects of GR when using SLUCM. The observational datasets include observed rainfall from 41 automatic weather stations (AWSs) obtained from the Municipal Corporation of Greater Mumbai.
To understand the mechanism for the changes in the rainfall values, we employ vertically integrated moisture flux convergence (VIMFC) (figure 5) and equivalent potential temperature (Theta-E) (figure 6) over the urban region. These two variables are useful indicators of convection and rainfall processes. VIMFC is given by,
where, g (m s−2) is the acceleration due to gravity, u (m s−1) and v (m s−1) are x and y components of wind velocity respectively, q (g kg−1) is the specific humidity, and p (Pa) is the pressure. The following will express the values of VIMFC in the units of g m−2 s−1.
3. Results and discussions
The cumulative rainfall from observed, Control, and different GF simulations (2017 event) are shown in figure 2. The Control simulation is underestimating the observed rainfall. All the GF simulations enhance the cumulative rainfall from the Control. The highest cumulative rain is observed in the GF 10% simulation with 586 mm of rainfall, while the lowest is for GF 25% (416 mm). In all GF simulations, the increase in the rainfall amounts is observed from 0100 to 2100 29 August 2017, which suggests the role of a strong convergence than the control run. Interestingly, the variation in the rainfall values within the GF simulations does not show a systematic pattern of increasing GR percentage with increased rainfall. The behavior is investigated further for 2013 and 2014 rainfall events. The six-hourly and daily accumulated precipitation of all simulations are shown in supplementary figures A4–A9.
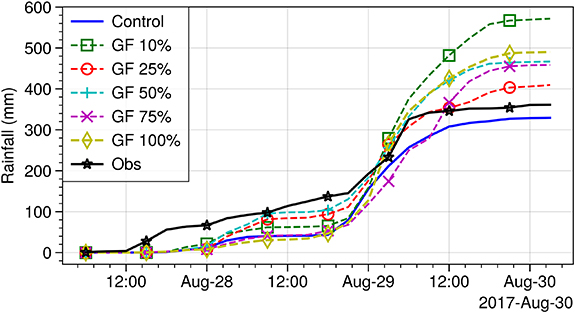
Figure 2. Cumulative rainfall (mm) for the 2017 event for observations (Obs), control, and different GF scenarios.
Download figure:
Standard image High-resolution imageFor the 2014 event, the Control simulation overestimates the rainfall amount with respect to the observations (shown in figure A10). A similar pattern of overestimating in GF simulations with respect to Control is observed; however, the magnitude is smaller than the 2017 event. GF 75% (372 mm) shows the maximum cumulative rainfall, while the minimum of GF simulations is given by GF 10% (327 mm). The GF simulations do reveal the same behavior as noted for the 2017 case, where the maximum and minimum cumulative rainfall amounts are noted for the GF 10% and GF 25%, respectively. The increase in the rainfall amounts of GF simulations occurs majorly for two periods from 0300 to 0800 13 July 2014, 1400 14 July–1800 15 July 2014. In the 2013 event, the Control simulation is overestimates the cumulative rainfall till 0400 16 June 2013 with a total amount of 200 mm (shown in figure A11). Similar to the 2017 and 2014 events, the GF simulations yielded more rainfall than the Control. GF 50% (292 mm) had the highest rain while the lowest is for GF 75% (201 mm). The increase in the rainfall amounts of GF simulations is observed during 0700 to 2300 13 June 2013, and 2000 15 June 2013 to 0200 16 June 2013. From the above results, it is evident that the changes in the urban surface properties lead to significant changes in the rainfall, as observed in other studies (Shepherd and Burian 2003, Dou et al 2015, Liu and Niyogi 2019, Doan et al 2021).
The different share of GF values of rainfall is compared to the control run shown in figure 3. The highest difference was observed in GF 10% in the 2017 event, whereas the lowest difference was observed in GF 10% in the 2014 event. The least variation within the GF simulations was observed in the 2014 event. In the 2013 event, the maximum change in rainfall was observed in GF 50% with, 1.5 times the control run, whereas lowest in GF 75% with 1.02 times. On the other hand, in the 2017 event, the maximum rainfall change was observed in GF 10% (73%) while the lowest in GF 25% (22%) higher than the control run. Overall, the relative change in rainfall amounts is greater than control simulations in all the events. We further investigate the hourly rainfall estimates from the GF simulations (shown in figure 4). The points above the dashed line show overestimation and vice-versa from the Control rainfall estimates. The 2017 event clearly shows the increased rainfall estimated in all GF simulations. GF simulations' values extend from 20 to 60 mm of rain with respect to the 10–25 mm of Control rainfall estimates. The 2014 event shows a mixed result with a minor increase in rainfall amounts in parity with the relative change of the rainfall values. Similar to 2017, the 2013 event shows a higher rainfall amount from 15 to 35 mm while the Control rainfall values are between 5 and 20 mm. Overall, an increase in the hourly rainfall amounts is observed for the GF simulations. The amplified rainfall amounts are more prominent in the case of the 2017 event. The following changes in the rainfall amounts can be attributed to the land surface feedback (in this case, green roof) that changes the intensity and location of the rainfall by modulating the local convergence zones (Kumar et al 2008, Patel et al 2020). It is verified using VIMFC, equivalent potential temperature (Theta-E), atmospheric moisture content, and vertical wind velocity as atmospheric variables and surface feedback variables such as temperature, heat fluxes, and winds.
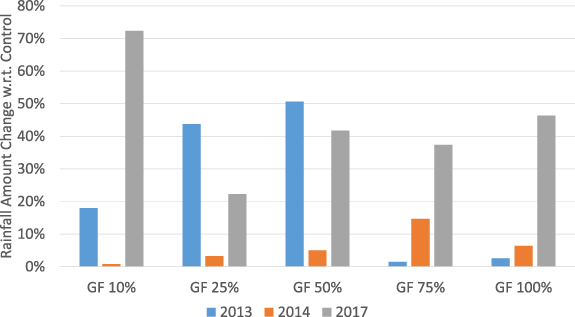
Figure 3. Relative change (%) in the total accumulated precipitation under different GF scenarios for the three events.
Download figure:
Standard image High-resolution image
Figure 4. Hourly rainfall values of all the GF simulations with respect to control for (a) 2013, (b) 2014, and (c) 2017.
Download figure:
Standard image High-resolution image
Figure 5. VIMFC change from control of different green roof scenarios for 2017 event.
Download figure:
Standard image High-resolution image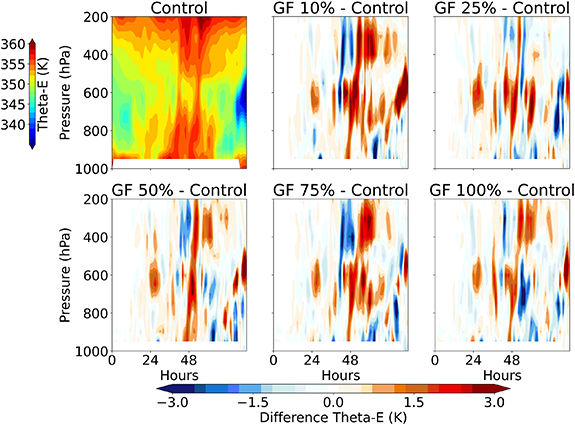
Figure 6. (a) Equivalent potential temperature (Theta-E) (K) over the urban area in control simulation for the 2017 event. Difference of Theta-E between control and GF (b) 10%, (c) 25%, (d) 50%, (e) 75%, and (f) 100% simulations.
Download figure:
Standard image High-resolution imageFigure 5 shows more convergence occurring in the urban regions, especially in GF 10%,ultimately leading to the increased urban rainfall. As the system develops past the initial period, there are relatively smaller changes in the VIMFC. Still the changes are clustered locally, leading to more convergence after 24 h of initialization. The result agrees with the Lei et al (2008a) study, where urban surface temperatures significantly affect the storm, particularly during the initialization of the storm. For GF 25%, there is lesser VIMFC than the Control at 1300 28 August 2017 and 1200 29 August 2017, leading to the lesser rainfall than the other GF simulations. Theta-E (figure 6) shows an increase of more than 2 K in all GF simulations at around 48 h, which leads to stronger convergence over the city. The higher moisture availability amidst increased convergence contributes to higher rainfall amounts ranging from 22% to 72%. The increased moisture content is a combination of moisture advection due to convergence and higher surface latent heat, which lead to higher Theta-E. The increase in Theat-E is noted above the boundary layer, between 800-200 hPa in all the GF simulations leading to an increased possibility of triggering the convective uplift.
For the 2014 case, the VIMFC changes with respect to the Control run are shown in figure A15. It can be observed that during the initial timesteps, the changes are insignificant, which is in parity with the cumulative rainfall amounts. After 24 h, in all GF simulations, a higher Theta-E relative to the control is observed between 800 and 600 hPa (shown in figure A16). The Theta-E vertical gradient indicates more unstable atmosphere, localized mesoscale circulation and convergence zones between 0000 (0530 LST) and 1200 (1730 LST) 14 July 2014. For the GF 75% simulation, the increased Theta-E and higher VIMFC after 24 h favored increased precipitation and is evident in the increased rainfall from the Control simulation. Similarly, the combination of VIMFC (figure A17) and Theta-E (figure A18) explain the rainfall amount changes in the 2013 event. In the case of GF 50%, the VIMFC and Theta-E show higher values than the rest of the GF scenarios, resulting in more rainfall. Similar to the 2017 and 2014 cases, during the initial timesteps, the GF simulations' changes are negligible, which is expected. However, after 12 h, the increased convergence can be seen in all the GF simulations. Also, GF 75% shows a negative VIMFC show from 1400 (1930 LST) to 2300 (0430 17 June 2013 LST) 16 June 2013 and a lower Theta-E, which means lesser rainfall, thus explaining the reduced rain than the other GF simulations. From the above results, it can be observed that GF's use increases the amount of rainfall by creating more convergence (VIMFC) due to the increased instability in the atmosphere (Theta-E). Interestingly, the GF percentage increase does not lead to a monotonic increase in the rainfall.
The vertical wind velocity changes and specific humidity for the GF simulations are illustrated in figure 7. The positive values represent an increased values relative to the Control and vice-versa. In the case of the 2017 event, there is more vertical wind velocity than the control simulations and more moisture availability tending to more rainfall. GF 10% consistently has more instability and more moisture than the remaining GF simulations. Interestingly, GF 25% has more instability in the 700–400 hPa while more moisture at 675–500 hPa. All the GF simulations have increased vertical velocity; considering the moisture content, an increase is observed from the surface to 500 hPa. In 2014, the increased specific humidity was observed in the 650–200 hPa, while all the GF simulations show increased vertical velocity. Due to additional moisture availability than the control simulation, 2014 events produce slightly more rainfall than the Control simulation. Rainfall amounts are also consistent with the amount of moisture content and vertical wind velocity.

Figure 7. Vertical wind velocity (m s−1) and specific humidity (kg/kg) (× 10−4) difference between Control and GF simulations for 2013 (a)–(d), 2014 (b)–(e), and 2017 (c)–(f) events.
Download figure:
Standard image High-resolution imageThe land surface feedback to the atmosphere is complex, and it is difficult to generalize the results—highlighting the need for further experiments. What can be concluded from the current set of numerical experiments is that there is a consistent signal that GF's introduction in the urban regions produces more rainfall. The rainfall modification due to GF is a non-linear process that is complex feedback of factors such as local instability, moisture content, and surface energy balance.
Comparison between the Control and GF simulations (figure 8) shows that by 1100 UTC (1630 Local Time), 28 August 2017, urban areas decreased the land surface temperature (LST) ( 5 ∘C) and 2-m air temperature by (
 2 ∘C) through the cooling effect of the green roofs. The surface cooling affects the static instability, which reduces the vertical mixing in the urban area, and PBL height is reduced by up to 250 m. There are regional differences in the boundary layer fields for the different GF. In particular, GF 75% and GF 100% simulations show a localized increase in the LST (
 5 ∘C) and 2-m air temperature
  2 ∘C in the north-eastern boundary (denoted by the blue box) of the urban region. The vertical mixing also increases in response to the surface heating, and PBL height is about 800 m in contrast to ≈500 m.
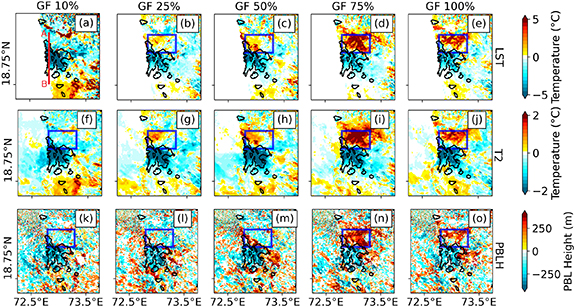
Figure 8. Difference between the control and GF simulations; GF 10% (a), (f), (k), GF 25% (b), (g), (l), GF 50% (c), (h), (m), GF 75% (d), (i), (n), and GF 100% (e), (j), (o), for land surface temperature (LST) (a)–(e), 2 m air temperature (T2) (f)–(j), and planetary boundary layer height (PBLH) (k)–(o) at 1100 UTC (1630 Local Time) of 28 August 2017. The black polygons indicate the urban region. Positive values represent values more than the control.
Download figure:
Standard image High-resolution imageCross-sectional fields across the domain AB (shown in figure 8(a)) (figure 9) show that, for Control, the PBL is relatively wet and well-mixed. For the GF, the PBL is higher due to the vigorous vertical mixing and is either same or wetter than that of the Control. The temperature over the urban surface at the PBL is cooler than the Control, which suggests the impacts of GF cooling through the PBL and not just the surface.
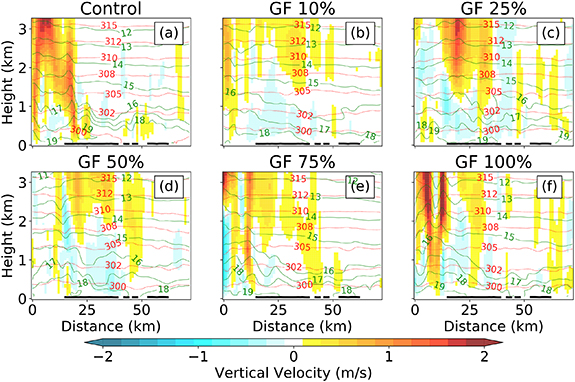
Figure 9. The cross-section of line AB (shown in figure 8(a)) for control (a) and GF (b)–(f) simulations at 1100 UTC (1630 Local Time) of 28 August 2017. The vertical wind velocity (m s−1) is represented as background shade, red color dashed contours are potential temperature in (K), and mixing ratio (g kg−1) is shown as solid green contours. The urban area is indicated by the solid black line.
Download figure:
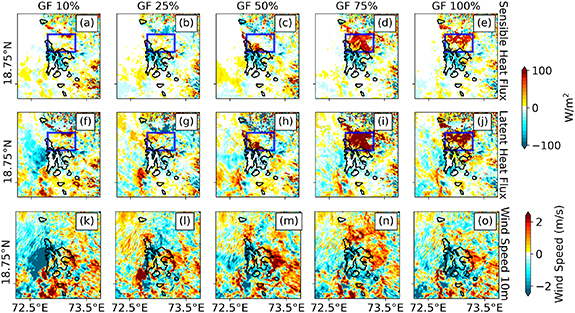
Standard image High-resolution imageThe thermodynamic feedback as a result of the GF ultimately helps enhance the storm (figure 10). The heat fluxes indicate a lower sensible heat (≈60 W m−2) over the urban region due to the additional moisture from the GF compared to Control; and an increase in the sensible heat (≈75 W m−2) in the north-eastern boundary (denoted by the blue box) of the urban region especially in case of GF 75% and GF 100%. The latent heat flux over the urban region increases with respect to the green roof fraction. This is expected as green roof leads to higher evapotranspiration and cooling of the surface. Similar to sensible heat flux, the latent heat flux also depicts an increase in the north-eastern part of the urban boundary. Thus, the sum of heat fluxes shows an increase in the heat flux over the edge of the urban region while a reduction over the urban area. The reduced wind speed over the urban region suggests feedback due to roughness or drag caused due to the GF. Sensitivity analysis suggests that the GF introduction influences the surface radiative turbulent (sensible and latent) flux gradients, which alter the location of convergence zones over the city, hence the location of rainbands.
Figure 10. Difference between the control and GF simulations at 1100 UTC (1630 Local Time) of 28 August 2017 for sensible (a)–(e), latent (f)–(j), the sum of latent and sensible heat fluxes (k)–(o) and 10 m wind speed (p)–(t). The red color shows the increase in GF simulations, and blue represents the reduction than the control.
Download figure:
Standard image High-resolution image
4. Conclusions
GR is a promising climate adaptation measure where managing urban heat island effect and reducing flash flood potential are considered notable positive impacts possible. However, there are no/limited studies available, which assess the response of heavy rainfall events under different GR scenarios. In response to this gap, this study conducted detailed experiments taking the case of GR effectiveness for Mumbai, India, a coastal, tropical city that has been vulnerable to heavy rains and flash flooding. Three heavy rainfall events from 2013, 2014, and 2017 were considered for the analysis using the WRF model. The experiments considered different GR scenarios, i.e. GF 10%, 25%, 50%, 75%, and 100%. The results from the GF simulations are compared with the respective Control simulations.
The results indicate that while each of the events and experiments conducted yielded different results for different GF, there was a consistent signature of increased rainfall over the urban area. That is, the GR simulation shows an increased amount and intensity of rainfall over the city relative to the Control. The increased rainfall amount varied from 1% to 72% over the innermost (covering the city) domain. The increased rainfall due to GR can be attributed to the higher equivalent potential temperature and gradients in the surface mesoscale fields, which favored strong convergence over the city. The mesoscale environmental changes simulated due to changes in the GF lead to a higher intensity and increases VIMFC supported the increased amount of rainfall. The changes in the thermal fluxes due to the additional latent heat also play an essential role in defining the local zone of convergence and increasing rainfall.
Although the rainfall amounts in GF simulations are increased in these cases, they will need to be tested for other cities in future investigations. It is also important to include climate simulations over the city to understand the changing patterns of precipitation. Nonetheless, GR has different benefits ranging from reducing UHI. Still, an increase in rainfall might require a rethinking over the consideration of the GR as a mitigation measure in the cities, where heavy rain-based flooding is a challenge.
Acknowledgments
This work benefited in part through, Project MoES/PAMC/H&C/36/2013-PC-II from the Ministry of Earth Sciences, India; Department of Science & Technology (SPLICE—Climate Change Programme), India, Project DST/CCP/CoE/140/2018, Grant: 10013072 (UC ID: 18192442); US National Science Foundation OAC-1835739, AGS-1522492, USDA Hatch Project 1007699. The lead author acknowledges the SERB Overseas Visiting Doctoral Fellowship (SB/59/Z-03/2017-XI,2018-19) for a 1 year research visit to Purdue University.
Data availability statement
The data that support the findings of this study are available upon reasonable request from the authors.