

Abstract
The present study examines the role of the Southern Indian Ocean (SIO) warming on the cyclone destruction potential or Power Dissipation Index (PDI) during two contrasting periods of 1980–1998 and 1999–2016. The PDI in the SIO during 1999–2016 is found to have doubled compared to the same during 1980–1998. PDI was computed using the tropical cyclone track data in the SIO region for cyclone category three and above. The increasing trend in PDI during the latter period is primarily due to an increase in the intensity of cyclones and their duration. The increasing PDI is associated with a sea surface temperature warming and an upper ocean heat content increase as well as a significant slowdown in translation speeds. The increase in upper ocean heat content during the recent decades enhances the intensification of cyclones and their duration, which is consistent with the slowdown of cyclones. Analysis of the relevant atmospheric parameters indicates that processes in the atmosphere did not play a major role in the recent decades in increasing cyclone intensity. We show that in the SIO, ocean processes play a major role in the PDI rise during the recent period. Any continued increase in PDI will cause more loss of life and socioeconomic damage to the island countries such as Mozambique, Mauritius, Mascarene Islands and Madagascar, as well as the coastal inhabitants along East Africa.
Export citation and abstract BibTeX RIS

Original content from this work may be used under the terms of the Creative Commons Attribution 4.0 license. Any further distribution of this work must maintain attribution to the author(s) and the title of the work, journal citation and DOI.
1. Introduction
Tropical cyclones (TCs) (cyclones in the Indian Ocean), also called typhoons (in the Pacific) or hurricanes (in the Atlantic), are among the most hazardous natural calamities that affect the coastal regions (Blake et al 2011). TCs are characterized by intense circular storm centered around low atmospheric pressure, with strong winds, and heavy rainfall causing loss of life and property damage. Variability and change in the number, intensity and rate of intensification of the TCs are vital owing to their observed response to global warming (Li et al 2010). On the positive side, TCs contribute significantly to rainfall over the affected regions (Lyon and Camargo 2009, Pezza et al 2012). Cyclones are argued to be a part of the poleward heat transport required by the equator-to-pole temperature gradient (Emanuel 2001, Uotila et al 2011). Due to its atmospheric and oceanic properties, a large number of tropical cyclones form in the Southwestern Indian Ocean, which also show a relation to the modes of coupled climate variability (Burns et al 2016).
The loss of property and life have been well-documented in this region. For example, tropical cyclone 'Idai' (4–21 March 2019) was one of the most severe tropical cyclones that affected the Southern Indian Ocean (SOI). Idai made landfall in Mozambique, where more than 1300 people were killed, and more than 3 million people were directly affected. It is one of the costliest cyclones in the southwestern Indian Ocean, with total damage estimated at approximately $2.2 billion. Just after four weeks of cyclone Idai, another intense cyclone 'Kenneth' formed in the region during 21–29 April 2019, which also caused considerable socioeconomic damage. With the expected continuation of the Indian Ocean warming, and its relation and feedback to the Pacific warming, the importance of understanding the factors influencing the number and intensity of TCs in this region is obvious (Zhang et al 2019b).
Earlier studies (Emanuel 2005, Webster 2005) have shown that cyclone frequency, and intensity are directly linked to an increase in sea surface temperatures (SSTs) caused by natural modes of climate variability and/or global warming. Zhang et al (2018) and Vidya et al (2020) have reported that the SIO SST and upper ocean heat content have increased significantly during the last two decades. This warming is mainly due to the increased advection of upper-ocean warm water from the western Pacific through the Indonesian Throughflow (ITF; Lee et al 2015, Dong and Mcphaden 2016, Zhang et al 2018). The apparent secular variability in the tropical Pacific warming continues to be debated (England et al 2014), especially in terms of the relative warming rates of the eastern and western halves of this important region (Cane et al 1997, Kosaka and Xie 2013, England et al 2014, Zhang et al 2018, Seager et al 2019). Increased advection of this warm western Pacific water into the SIO (Vidya et al 2020) can significantly contribute to the TC characteristics in this region. Warmer oceanic regions can support the enhanced intensification of the cyclones by supplying more energy from the upper ocean (Emanuel 2000, Wing et al 2007). However, our aim is not to engage in a debate about the global warming responses of the Pacific and Indian Oceans or the relation between them, since the role of the southern ocean warming in the Indian Ocean warming may also be an important consideration which has not received as much attention (Jayasankar et al 2019b). Our main goal in this study is to examine the role of SIO warming on the cyclone destruction potential or Power Dissipation Index (PDI) during two contrasting periods of 1980–1998 and 1999–2016. The choice of the dividing year for the two periods is motivated more by the proposed regime shift (Wanson and Tsonis 2009) which has also served as the debating point for the so-called global warming hiatus. This is discussed further in the Data and Method section below.
2. Data and method
Most of the cyclones (~85%) in the SIO occur from November to April (Mavume et al 2010). Hence, all the analyses in this study are performed for the period November–April and referred to as the 'cyclone season'. The PDI, a commonly used parameter to depict the destructive potential of tropical cyclones, is defined as the cube of the 6 h maximum surface wind speed integrated over the lifespan of the cyclones (Emanuel 2005). The PDI is computed using the methodology provided by Emanuel (2007) as follows,
Where Vmax is the maximum surface wind speed at each 6 h time interval (t) over the cyclone duration ( ). The annual PDI in each year is defined as the summation of all the cyclones (N) that occur during the cyclone season (November–April). In order to avoid the over-weighting of the contribution by any particular cyclone, Emanuel (2007) proposed velocity-weighted duration (
 ) of a cyclone as follows,
Where  is the lifetime peak intensity of the cyclone. The average duration of all the cyclones in each season is calculated as follows,
The annual averaged intensity (in wind speed cubed) during November–April in each year is calculated as follows,
The above parameters are calculated using the best-track tropical cyclone data obtained from the Joint Typhoon Warning Center (JTWC; source: www.metoc.navy.mil/jtwc/jtwc.html?southern-hemisphere). The JTWC maintains an archive of tropical cyclone data, known as 'best tracks' and each best-track data contains positions of tropical cyclone locations and intensities (maximum sustained surface winds) at every 6 h interval. We use the Saffir-Simpson scale to define tropical cyclone categories. As per Saffir-Simpson scale, wind speeds ranging from 17 to 33 m s−1 are defined as a tropical storm (Cat-0), 33–43 m s−1 as category-1, 43–50 m s−1 as category-2, 50–59 m s−1 as category-3, 59–70 m s−1 as category-4 and greater than 70 m s−1 as category-5 (Cat-5) tropical cyclones. Cyclones of category-3 and above tend to cause more catastrophic devastation over land. In addition, major oceanic and atmospheric responses occur only when the cyclone winds become stronger than 59 m s−1 (category-3). Hence, in the present study, we have considered only TCs with the intensity level of category-3 and above. Our conclusions on the trends are not altered by considering all the categories.
Since a cyclone can impact far away regions from its center, all the atmospheric variables are averaged over the region within a 1000 km radius from the center of the cyclone track during the days of the cyclone passage. Atmospheric variables such as relative humidity at 600 hPa, winds at 850 hPa and 200 hPa, geopotential height at 850 hPa and the mean sea level pressure for the period 1980–2016 are obtained from daily means of ERA-interim (Dee et al 2011) with a spatial resolution of 0.75 × 0.75°. Winds at 850 hPa are used to calculate relative vorticity. Vertical wind shear (VWS) is calculated based on the wind speed difference between 200 hPa and 850 hPa using the following equation:
With the above, the annual mean of each parameter (relative vorticity, relative humidity, and vertical wind shear) for each year is calculated.
Monthly mean SST is obtained from the Met Office Hadley Centre's sea ice and sea surface temperature dataset (HadlSST1) for the period 1980–2016 (Rayner et al 2003) with a spatial resolution of 1 × 1 . The upper-ocean heat content (UOHC) in the upper 200 m is calculated using the equation
Where ρo is the reference density of seawater (1027 kg m−3), Cp is the heat capacity of the sea water at constant pressure, h is the deepest layer of integration (200 m here), and T is the potential temperature. The monthly mean ocean potential temperature with a spatial resolution of 1 × 1 is acquired from the European Centre for Medium-Range Weather Forecasts (ECMWF) Ocean Reanalysis System 4 (ORAS4) (Balmaseda et al 2013). The least-squares linear regression test has been performed to evaluate the trends. Significance of all the trends are tested with two-tailed t-test at 95% confidence interval. Details of the statistical analysis are given in table 1.
Table 1. Represents the means of all variables during 1980–1998 and 1999–2016, and corresponding P values and T values. The values, which are significant above 95% CL, is given in italics.
| Variables | 1980–1998 | 1999–2016 | P value | T value |
|---|---|---|---|---|
| SST (°C) | 27.72 | 27.86 | 0.14 | −1.5 |
| PDI (×1012 m3 s−3) | 0.28 | 0.65 | 0.00 | −4.58 |
| Number | 4.11 | 4.61 | 0.44 | −0.78 |
| Intensity (ms−1) | 51.29 | 55.27 | 0.00 | −3.59 |
| Duration (days) | 6.008 | 9.88 | 0.00 | −4.25 |
| VWS (ms−1) | 16.84 | 17.77 | 0.05 | −2.02 |
| R.H. (%) | 53.64 | 53.04 | 0.65 | 0.46 |
| Vorticity (×10−5 s−1) | −0.54 | −0.59 | 0.22 | 1.25 |
| UOHC (×1010 J m−2) | 7.47 | 7.52 | 0.03 | −2.24 |
In the present study, we have considered the cyclone characteristics in the SIO for two periods; 1980–1998 and 1999–2016. As mentioned in the Introduction, a regime shift in climate was proposed around 1999 by Wanson and Tsonis (2009), but a debate has also raged about a potential slowdown in global warming as also stated in the Introduction (Kosaka and Xie 2013a, England et al 2014, Zhang et al 2018). Since the cyclone season in the SIO extends from November of one year to April of the following year, in the present study, we have considered the year starting from 1999 as the dividing line. As an aside, we note that some earlier studies (for example, Hu and Fedorov 2017, Zhang et al 2019a) have argued that weakening of global warming trend ceased in 2012 and a strong warming occurred during the period 2014–2016; these 3 years are the three warmest years for our study period. However, SIO shows a similar warming trend starting from 1998 to the end of 2016 (Vidya et al 2020). Re-emphasising that our goal is not to focus on the so-called Global Warming Hiatus, we just contrast the two periods for the cyclone characteristics and their putative driving mechanisms during the two periods.
3. Results and discussion
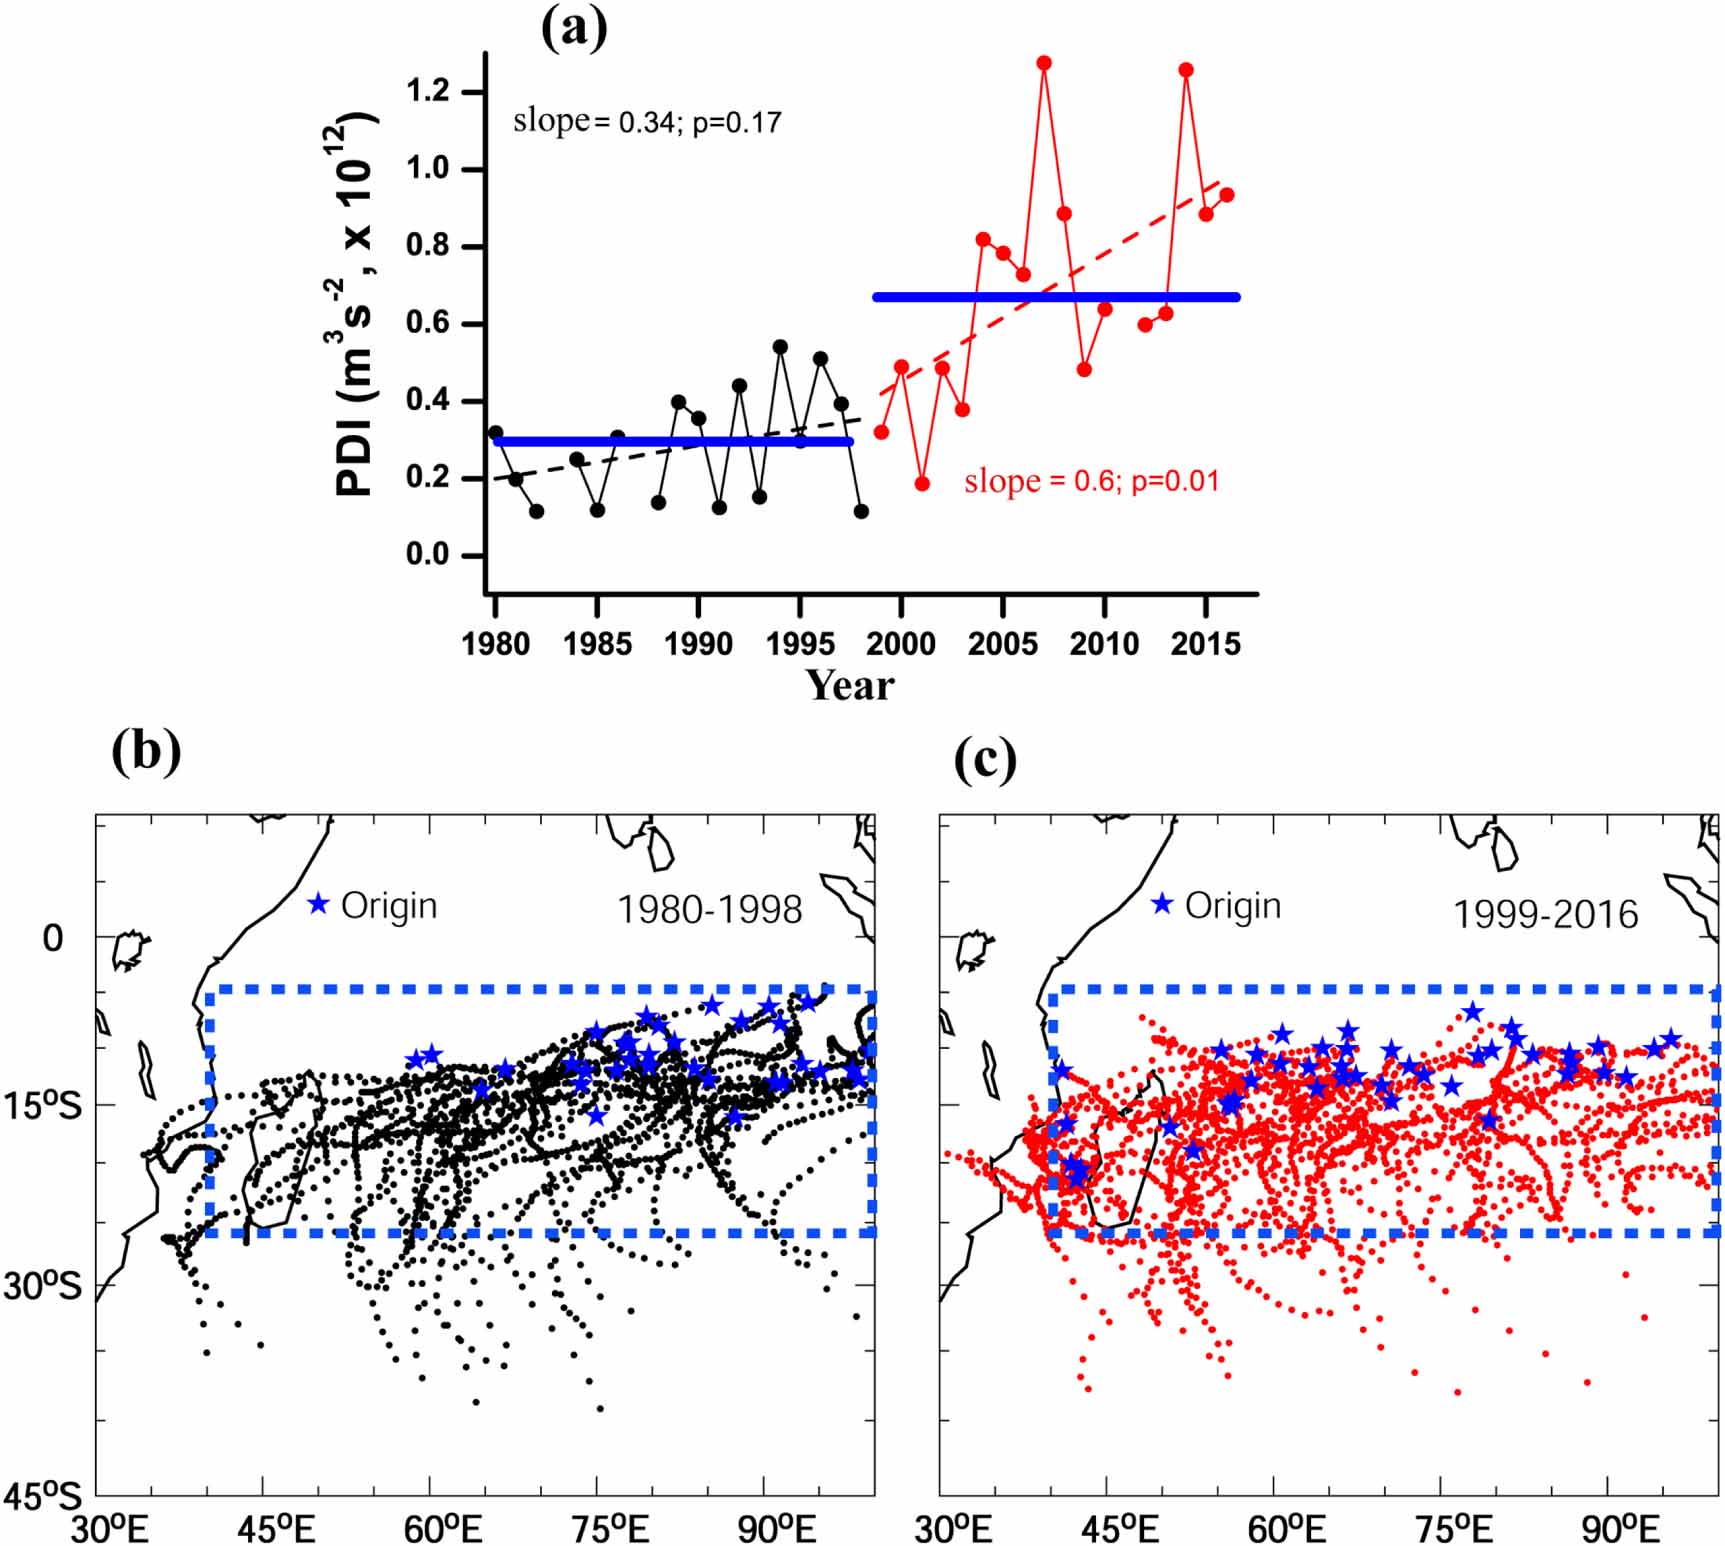
The PDI in the SIO region (5°S–25°S and 40°E–100°E) shows ~100% increase during the recent decades (1999–2016) compared to the preceding two decades (1980–1998) (figure 1(a)), i.e. almost a doubling. Although the trends are positive during both the periods, the trend was not significant during the first period. The PDI was computed using the tropical cyclone trajectories shown in figures 1(b) and (c), respectively. Note that an apparent westward shift in the average position of the cyclogenesis location is evident during the second period. The interannual variability is also much higher during the latter period compared to the first period, the reasons for which are not the focus here.
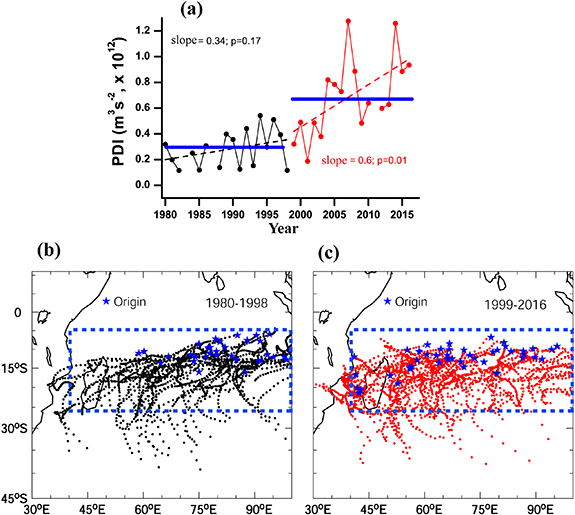
Figure 1. (a) Time series of the Power Dissipation Index (PDI); horizontal blue lines indicate the mean PDI for the respective period. Cyclone tracks (category three and above) (b) during 1980–1998 and (c) during 1999–2016, in the Southern Indian Ocean. Blue stars indicate the cyclone origins and the blue dashed box indicates the cyclogenesis (40°E–100°E and 5°S–25°S) region. In (a), slope indicates the regression value and 'p' values indicate the significance of the trends. The missing years in (a) indicate the absence of cyclones with category-3 and above.
Download figure:
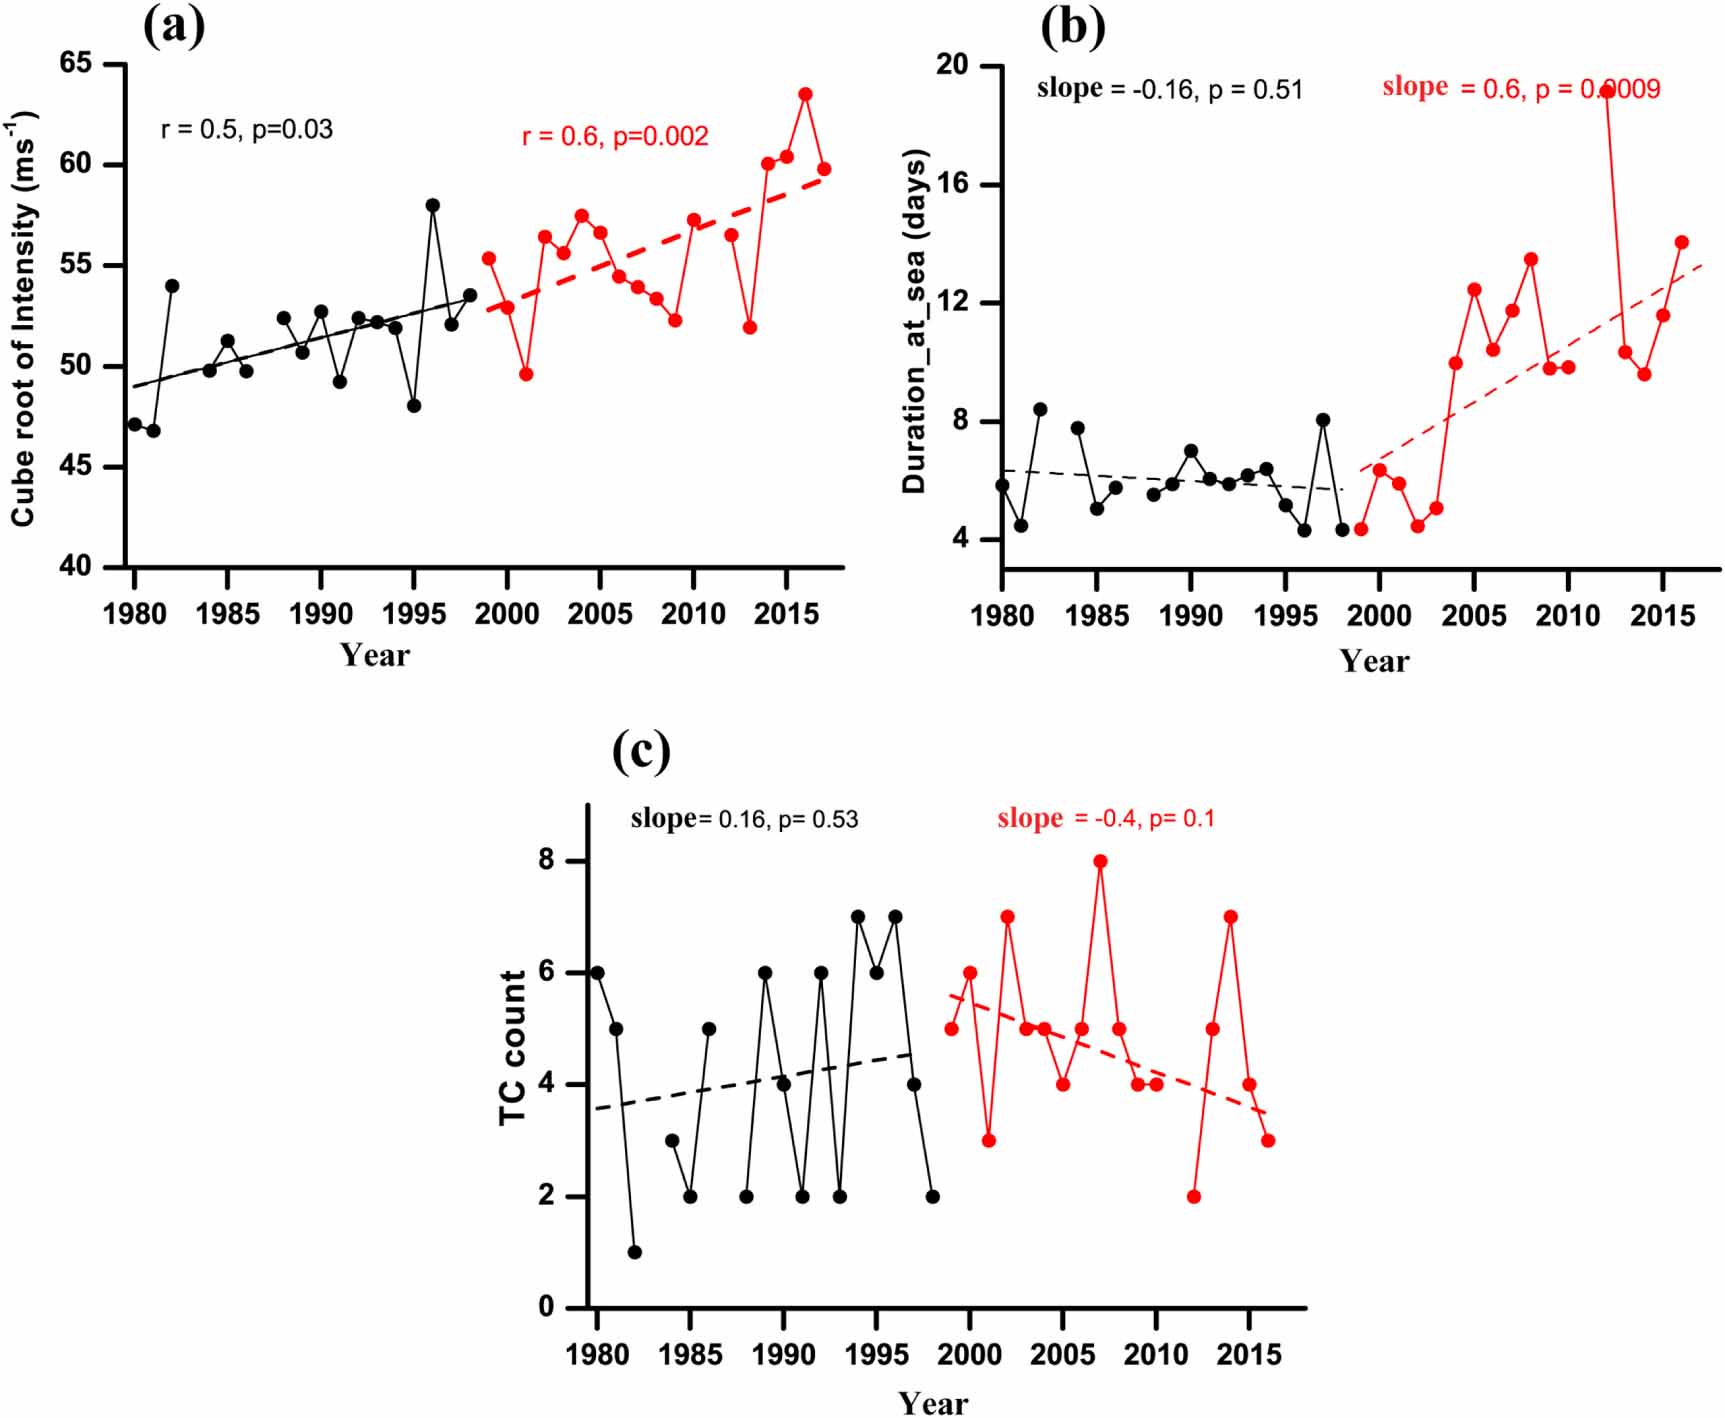
Standard image High-resolution imageTo understand the reason for the increase (doubling) in PDI during the recent period, we examined three important factors, viz., cyclone intensity (I), duration (D), and frequency (N) which control the PDI. Duration is the average lifespan of a cyclone calculated based on velocity-weighted duration following equations (2) and (3). Here, we assessed the individual variables to understand the importance of each component to the PDI during both the periods. Similar to PDI (figure 1(a)), the intensity of cyclones also showed an increasing trend in both the periods, with a stronger trend during 1999–2016 (figure 2(a)). A significant increasing trend in the duration (figure 2(b)) and a decreasing trend in the number of cyclones (figure 2(c)) is observed during the recent decades. However, neither the duration nor the number of cyclones show any significant trend during the first period (figures 2(b) and (c)). Note again that the cyclone PDI, the intensity and duration increased significantly during 1999–2016 compared to 1980–1998 (table 1).
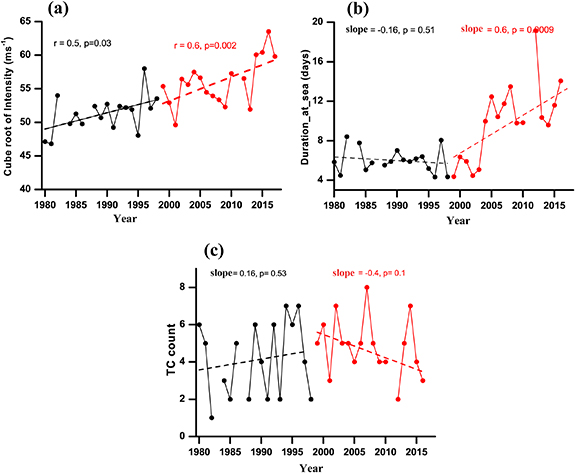
Figure 2. Time series of factors contributing to PDI. (a) Averaged intensity in m s−1 (cube root of intensity), (b) averaged cyclone duration in days, and (c) cyclone count in the SIO during the cyclone season (November–April). The black line indicates the first period and red line the second period. Slopes indicate the regression value and 'p' values indicate the significance of trends. Missing years correspond to the absence of cyclones of category-3 and above.
Download figure:
Standard image High-resolution imageMalan et al (2013) showed that in the SIO, a stronger anticyclonic condition to the east of Madagascar causes a decreasing trend in tropical cyclones after the monstrous 1997–98 El Niňo event. Girishkumar and Ravichandran (2012) showed that in the Bay of Bengal, positive SST anomalies during El Niňo events cause atmospheric changes which result in a reduction in the number of cyclones. Consistent with the above studies, we also observe a strengthening anticyclonic pattern to the east of Madagascar during recent decades (figure S1 (available online at stacks.iop.org/ERL/16/014027/mmedia)). Based on figures 2(a) and (b), it can be argued that during 1999–2016, the increasing trend in PDI is due to positive trends in the intensity of the cyclones and their duration. To elicit the reasons for the increase in cyclone intensity and duration from the first to the second period, we further explore the oceanic and atmospheric factors that can influence them.
3.1. Oceanic parameters and cyclone intensity
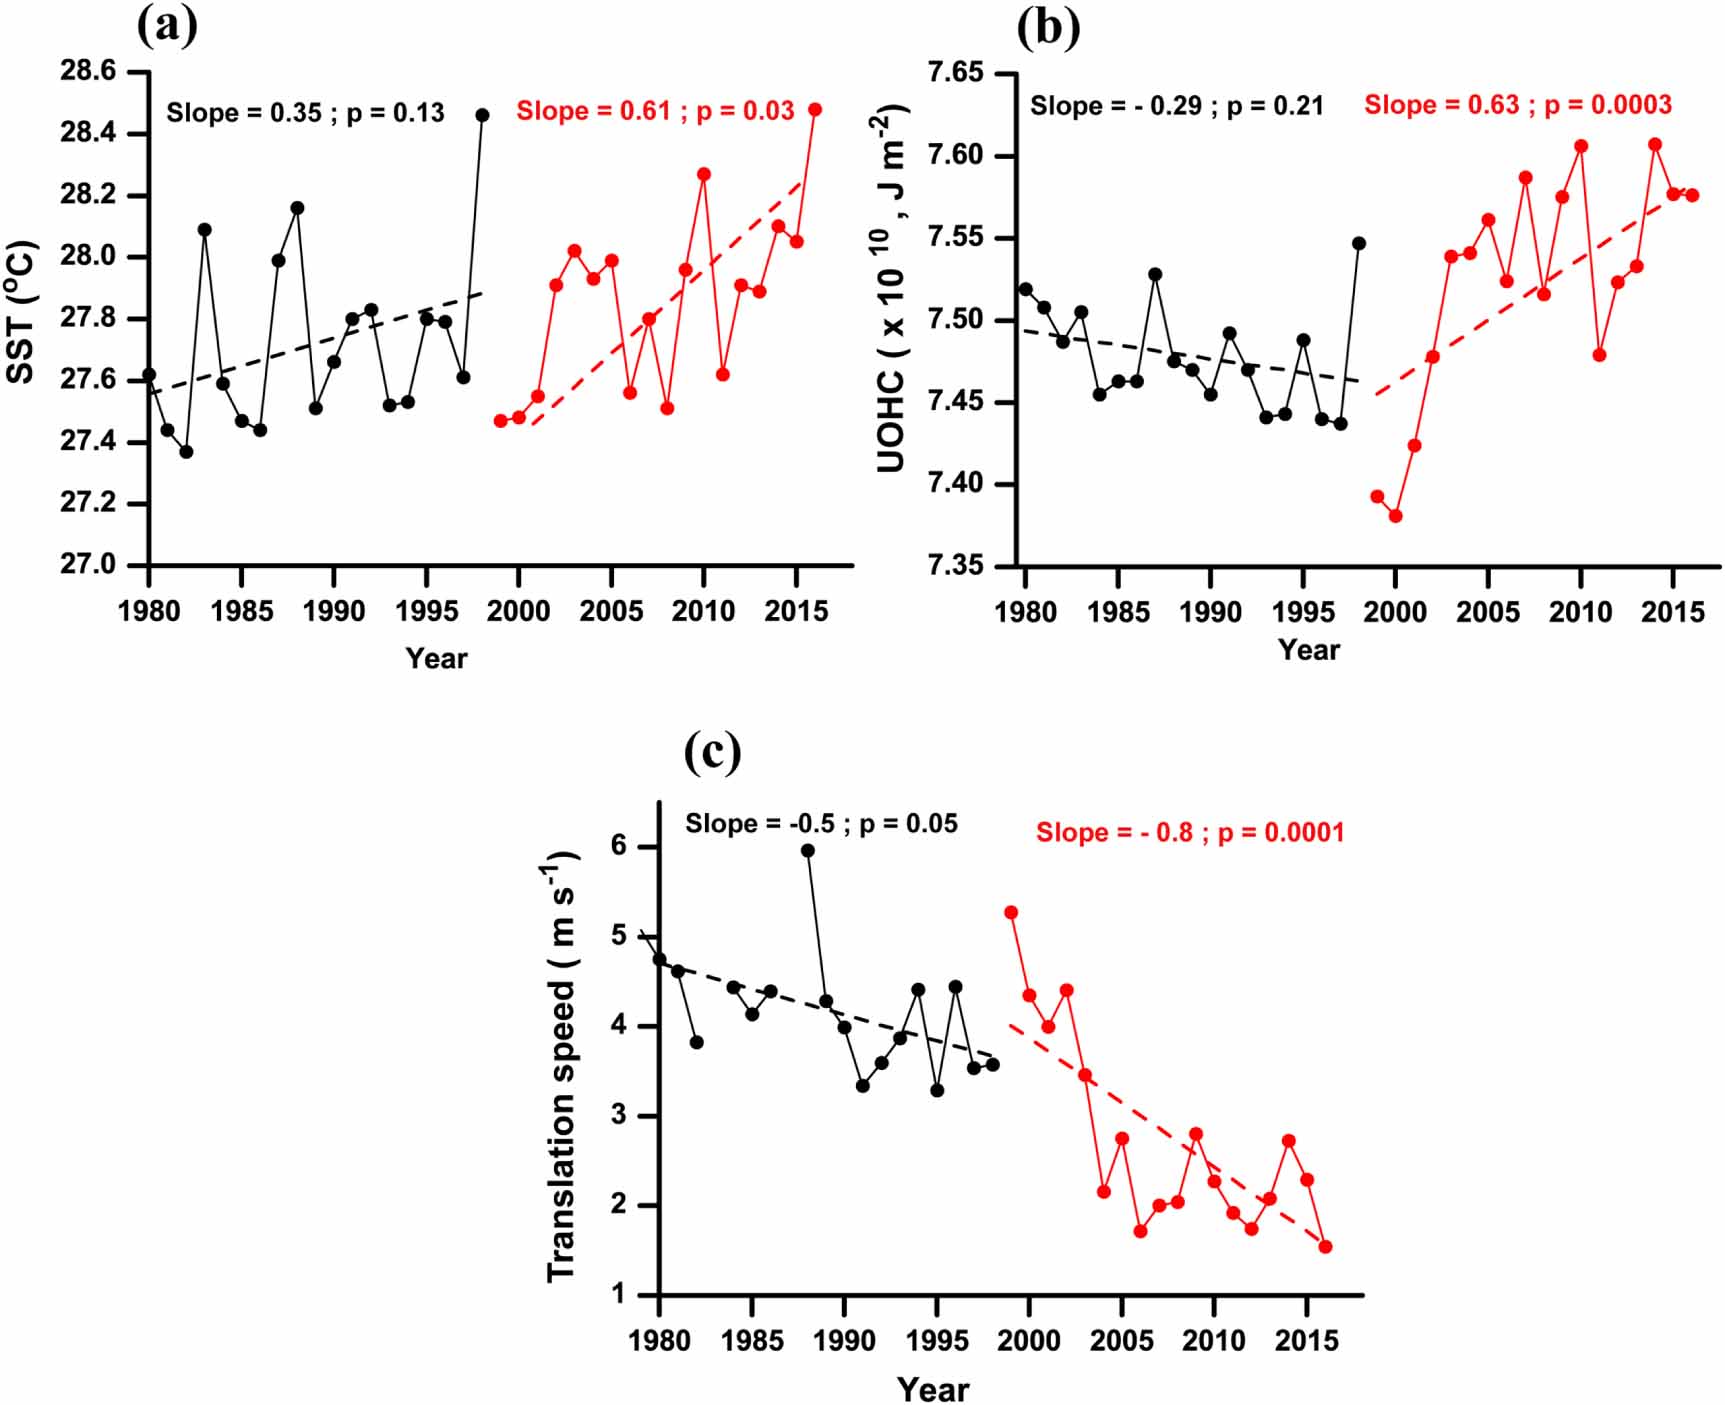
Figures 3(a) and (b) depict the annual mean SST and upper ocean heat content (UOHC) in the cyclogenesis region (40°E–100°E; 5°S–25°S). SST and UOHC are the important oceanic parameters which are directly linked to the cyclone intensity, and hence the PDI (Emanuel et al 2004, Lin et al 2008, 2013). SST (figure 3(a)) and UOHC (figure 3(b)) show an increasing trend during the latter period, while trends are not significant during the former. The mean UOHC in the cyclogenesis region has increased by ~0.45 × 10⁹J m−2 during the second period compared to the first, and the difference is statistically significant (table 1). In addition, we also calculated the annual mean translation speed during both the periods. The average translation speed during the first period was 4.3 ± 0.5 m s−1, while during the second period it slowed down to 2.7 ± 0.8 m s−1. In contrast to the SST and UOHC, cyclone translation speed showed a significant decreasing trend across the two periods (figure 3(c)).
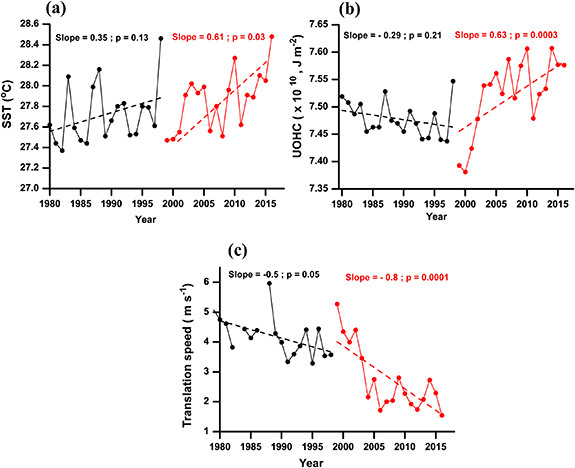
Figure 3. Time series of annual mean (a) SST and (b) upper ocean heat content (UOHC) in the cyclogenesis region (40°E–100°E and 5°S–25°S) and (c) cyclone translation speed calculated from the cyclone tracks. Black dotted lines indicate the trend during 1980–1998 and red dashed lines indicate the trend during 1999–2016. The slope indicates the regression value and 'p' values indicate the significance of the trends.
Download figure:
Standard image High-resolution imageTo identify the exact mechanism for the increase in PDI during the recent decades, we perform a spatial correlation analysis between UOHC and PDI (figure 4(a)). The UOHC shows a significant positive correlation with the PDI in the cyclogenesis region (figure 4(a)), indicating that PDI and UOHC are strongly related during the recent decades. In addition, the temporal correlation between UOHC and intensity is also positive (r = 0.54, p = 0.03; figure 4(b)), implicating the increase in UOHC for increased intensification of cyclones and thus the increases in PDI. This is mainly because, the increase in SST and UOHC help to intensify the cyclone by the sustained supply of heat fluxes to the atmosphere (Emanuel 1987, Mawren and Reason 2017). Our results are consistent with the previous studies (Manatsa et al 2012, Malan et al 2013, Dilmahamod et al 2016, Mawren and Reason 2017), which also showed an increase in UOHC over the SIO for the post-1997 El Niňo period. We further analyse how these increases in cyclone intensity affect the cyclone duration and translation speed.
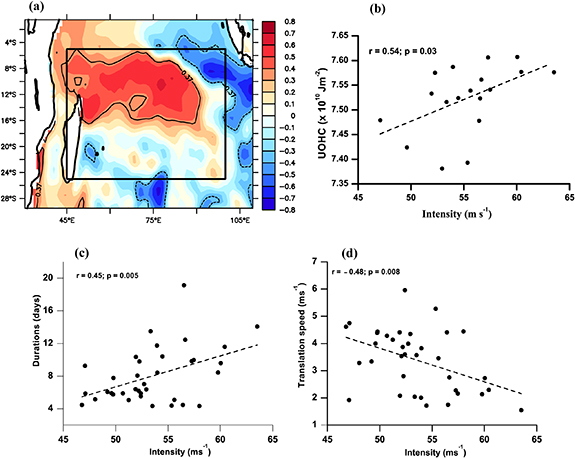
Figure 4. Spatial correlation between (a) PDI and UOHC during 1999–2016. Temporal correlation between, (b) intensity vs. UOHC, (c) Intensity vs. duration, and (d) intensity vs. translation speed. Black contours in figure 4(a) indicate the 90% confidence level.
Download figure:
Standard image High-resolution imageCyclone intensity vs. duration shows a positive correlation as well (r = 0.45; p = 0.005; figure 4(c). However, intensity vs. translation speed shows a negative correlation (r = −0.48; p = 0.008; figure 4(d)). This further confirms that the increase in intensity during the recent decades causes an increase in cyclone duration associated with a reduced translation speed. Thus the increased UOHC in the SIO can be blamed for the increased cyclone intensity and duration (Webster 2005, Malan et al 2013, Emanuel 2015) due to a more persistent energy availability from the ocean to the surface during the life cycle of a cyclone (Mawren and Reason 2017). Bhatia et al (2019) report a recent increase in cyclone intensification rates in the Atlantic basin associated with the warming there and our results are consistent with their findings.
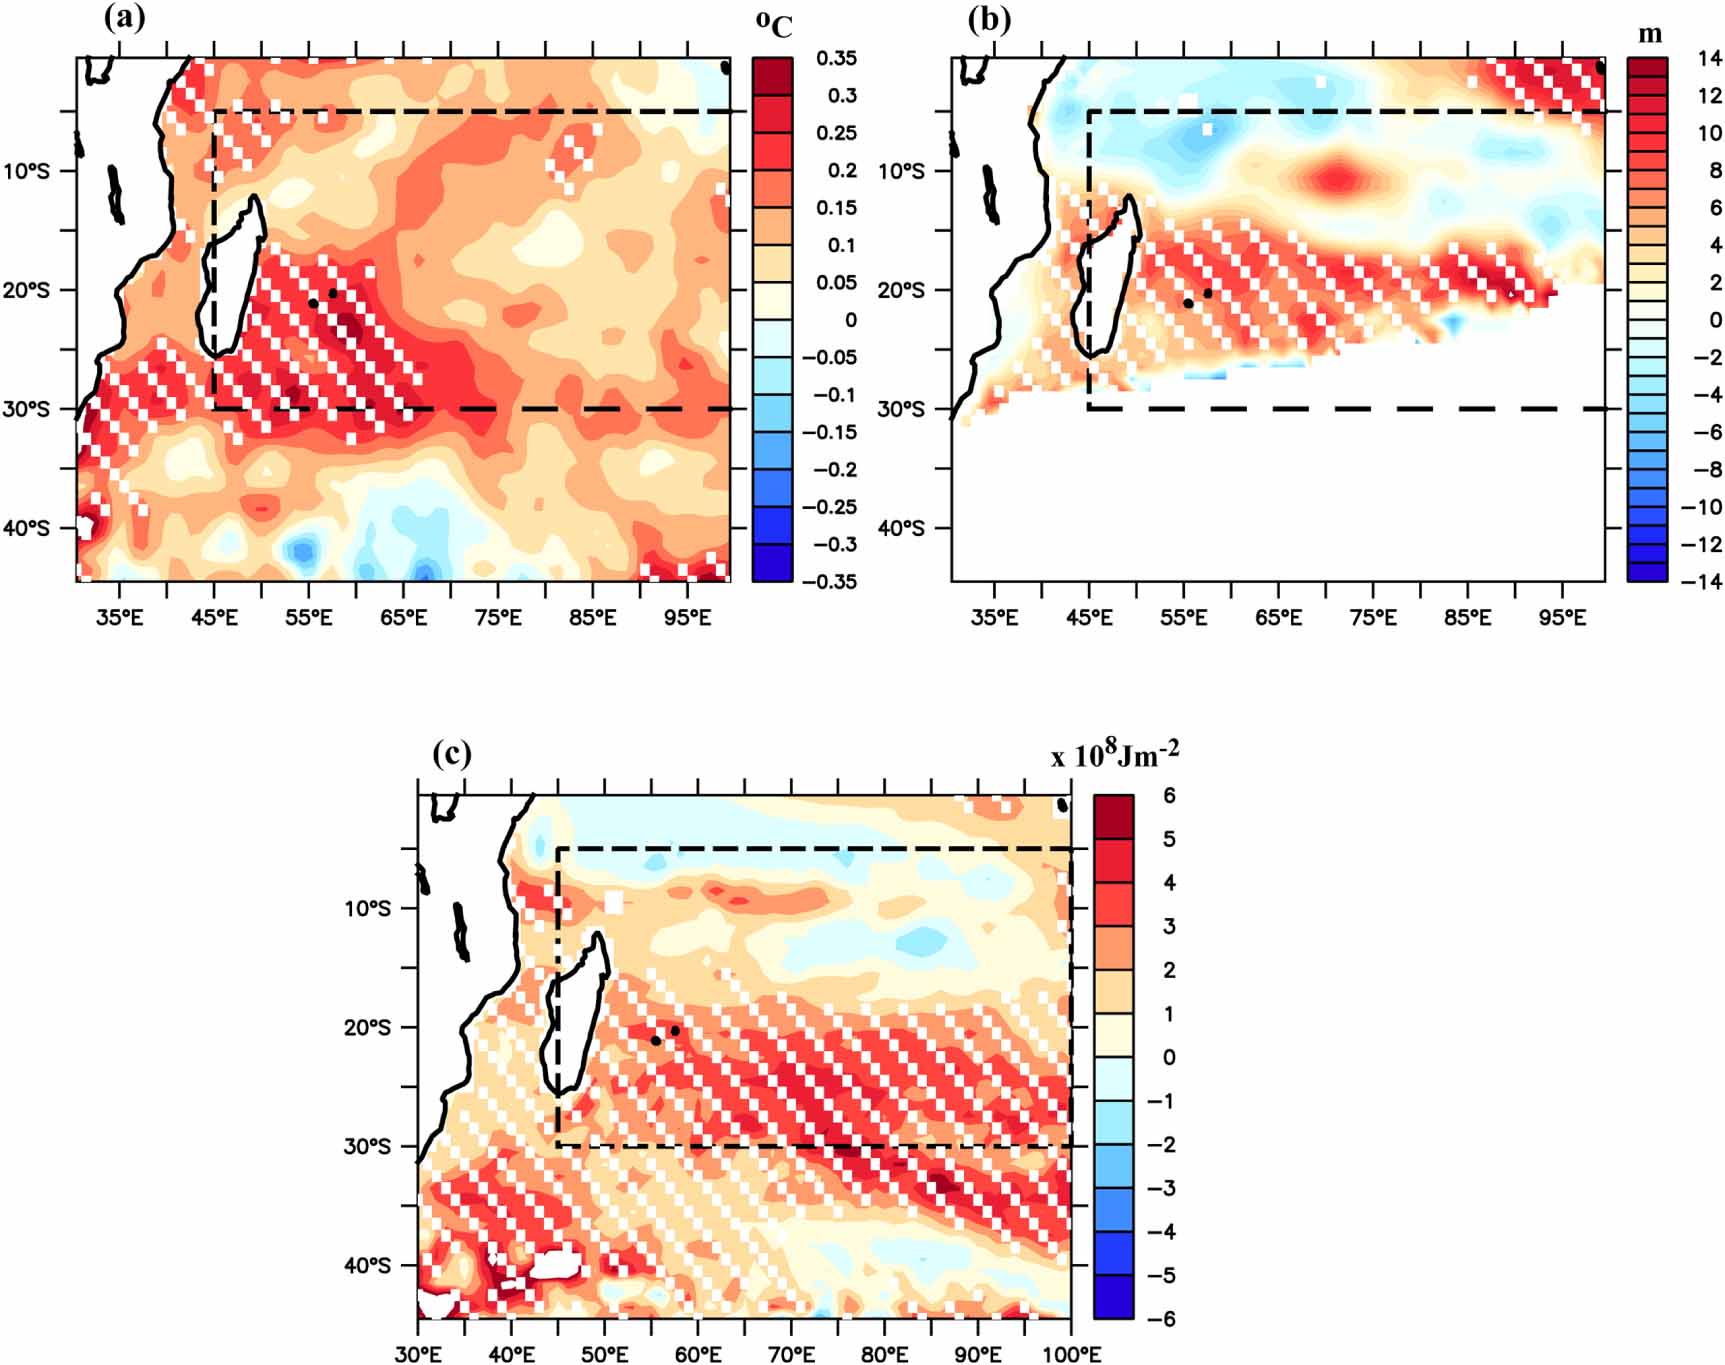
In addition, spatial maps of anomalies (second − first period) of SST (figure 5(a)), thermocline depth (figure 5(b)) and heat content in the upper 200 m (figure 5(c)) also display positive changes to the east of Madagascar reaffirming the significant warming of the upper ocean (SIO) across the decades. A deeper thermocline and a larger heat content in the western SIO during the latter period impede SST cooling during the cyclone passage and favour reduced cyclone translation speed and underlie its intensification into stronger categories.

Figure 5. Differences between 1999–2016 and 1980–1998 in (a) sea surface temperatures between 1999–2016 and 1980–1998, (b) thermocline depth (D26), (c) upper ocean heat content. Black dashed rectangle indicates the cyclogenesis region. White dots represent anomalies above the 90% significance level.
Download figure:
Standard image High-resolution imageThe negative correlation between the cyclone intensity and translation speed (figure 4(c)) further supports our hypothesis. Hence, we believe that the increase in the intensity of the tropical cyclone in the SIO is primarily due to warming of the upper ocean even though we make no arguments for the processes that caused the warming itself. We do want to add a caveat that the upper-level steering winds are also argued to be important for the slowdown of the cyclones across the globe (Kossin 2018) which is not considered here.
Recent studies (Liu et al 2015, Dong and Mcphaden 2016, Zhang et al 2018, Jyoti et al 2019, Vidya et al 2020) have indicated a significant warming of the SIO since the end of the 20th century. Zhang et al (2018) showed that an increased ITF during the recent decades is the major contributor to the warming in the upper 700 m of the SIO. Intensification of the trade winds over the tropical Pacific during the recent decades has been argued to cause an increase in the ITF (Liu et al 2015, Hu and Sprintall 2017) and transport more heat from the western Pacific into SIO. Lee et al (2015) showed that during the recent period, Pacific Ocean heat content decreased with a simultaneous increase in the SIO heat content. The abrupt increase (70% of the global ocean heat) in the SIO heat content and cooling (reduced heat content) in the tropical Pacific was also blamed on the ITF by Ueda et al (2015). The detailed mechanism of the SIO warming since 1998 and its implications are described in Vidya et al (2020). More recently, Jyoti et al (2019) have shown that the resultant warming of the SIO caused an increase in seal level rise which is 37% faster in the SIO than the global mean sea-level rise after the regime shift of 2000. Thus, warming of the SIO during the latter period of our study results in increasing trends in cyclone intensity and duration, which contribute to the total increase in PDI. As noted earlier, the Indian Ocean meridional overturning circulation can be expected to play a role in the tropical Indian Ocean warming as well, although the timescales of this direct link between the Southern Ocean and the tropical Indian Ocean remain to be quantified.
3.2. Influence of atmospheric variables on cyclone intensity
In addition to the oceanic parameters, we also assess the atmospheric contribution to the increased cyclone intensity and duration from the first to the second period. The vital atmospheric factors which can influence the cyclone intensity are (a) low-level relative vorticity at 850 hPa (figure 6(a)), (b) high relative humidity (RH) at 600 hPa (figure 6(b)), and (c) minimum VWS (figure 6(c)) between 850 hPa and 200 hPa (Emanuel 2005). All the atmospheric variables are taken within a 1000 km radius from the center of the cyclones (along their tracks) during the same days of the cyclone passage. Minimum VWS, maximum relative vorticity and relative humidity are the main atmospheric dynamic and thermodynamic factors necessary for the formation of a cyclone (Matsuura et al 2003, Emanuel 2007). During the first period, only the low level relative vorticity shows an increasing trend (slope = −0.44; p = 0.08), whereas relative humidity (slope = 0.14; p = 0.57) and VWS (slope = −0.01; p = 0.96) show no significant trends. However, during the latter period, none of the atmospheric variables, i.e. relative vorticity (slope = −0.1; p = 0.45), relative humidity (slope = 0.023; p = 0.88) or VWS (slope = 0.07; p = 0.76), show any significant trend. To further substantiate this, we also examine variations in atmospheric variables along the cyclone tracks during the two periods (figures S2 and S3). It is apparent that no significant differences in atmospheric parameters along the cyclone tracks occur in either period. We can conclude from these that the atmospheric processes likely did not directly contribute to the increase in cyclone duration and intensity. This also underscores our assertion that the cyclone PDI has increased in the recent decades because of the increase in SST and heat content.

Figure 6. Time series of (a) vorticity at 850 hPa (10−5 s−1), (b) relative humidity at 600 hPa (%), and (c) vertical wind shear (VWS; m s−1) averaged over the 1000 km from the center of the cyclone tracks. Black dotted lines indicate the trends during the 1980–1998 period, and red dashed lines indicate the trends during the 1999–2016 period. Slopes correspond to the regression value, and 'p' values are the significance of the trends.
Download figure:
Standard image High-resolution image
4. Conclusion
PDI over the SIO during 1999–2016 has doubled when compared to the decades of 1980–1998 period. The motivation for splitting across 1998–1999 was based on the proposed climate regime shift which also tends to coincide with the debate about a slowdown in global warming and changes in the frequency of the so-called Central Pacific El Niño compared to the canonical El Niño (Yeh et al 2009). Focusing just on the changes in the cyclone properties across the two periods, we note an increase in PDI during the latter period, which we attribute to increased cyclone intensity and duration. Analysis of the relevant atmospheric variables clearly indicates that the processes in the atmosphere did not seem to play a major role towards the cyclone intensification in the SIO. In contrast, increasing trends in SST, UOHC and a decreasing trend in cyclone translation speed during the recent decades seem to be responsible for the increase in cyclone intensity and duration and subsequently the increase in the cyclone PDI. An increase in SST and UOHC provide a more sustained supply of energy, causing a reduction in translation speed which results in the increase in cyclone duration and intensity. We show that the warming of the SIO during the 1999–2016 period is associated with a deepened thermocline, which inhibits the deeper and colder waters from cooling the surface when a cyclone passes over the region. Our findings that the ocean warming and the increase in upper ocean heat content are clearly important since the projected continuation of SIO warming can be expected to sustain the increasing trend in PDI. This will affect the most climate-vulnerable Indian Ocean island nations as well as the countries along the eastern coast of Africa. This may cause more loss of life and socioeconomic damages to the vulnerable island countries such as Mozambique (over 30 million), Mauritius (1.3 million inhabitants), and Madagascar (22 million inhabitants), which are located near the western side of the SIO. Notwithstanding the ongoing debate about the relative role of the atmospheric bridge vs. the oceanic tunnel in the low-frequency variability of this region (Deepa et al 2019, Jayasankar et al 2019a), the impact of the ocean warming on the TC genesis and their life cycle and the PDI deserve careful attention.
Acknowledgments
Authors acknowledge the Ministry of Earth Sciences, Govt. of India and Director, National Centre for Polar and Ocean Research (NCPOR), Goa for their support in this study. We sincerely thank the three anonymous reviewers for their valuable comments and suggestions which improved the quality of the manuscript significantly. RM gratefully acknowledges the Visiting Faculty position at the Indian Institute of Technology, Bombay. All the data sets used in this study are freely available, and details are mentioned in the data and method section. ORAS4 data was taken from http://apdrc.soest.hawaii.edu/las/v6/dataset?catitem=16675. ERA-interim data was taken from https://apps.ecmwf.int/datasets/data/interim-full-daily/. The NCPOR Contribution No. is J-80/2020-21 and the NIO Contribution No. is 6642.
Data availability statement
All data that support the findings of this study are included within the article (and any supplementary information files).