

Abstract
Placing water quality in rivers at the centre of water infrastructure planning and management is an important objective. In response there has been a range of 'whole system' analyses. Few studies, however, consider both abstraction (water removed from rivers) and discharge (water returned) to inform the future planning of water systems. In this work we present a systems approach to analysing future water planning options where system development prioritises the water quality of the receiving river. We provide a theoretical demonstration by integrating water supply and wastewater infrastructure, and downstream river water quality, on an open-source, stylised, systems model for London, UK, at a citywide scale. We show that models which consider either supply or wastewater separately will underestimate impacts of effluent on the water quality, in some cases by amounts that would require £1 billion worth of infrastructure equivalent to mitigate. We highlight the utility of the systems approach in evaluating integrated water infrastructure planning using both socio-economic and environmental indicators. Through this approach we find unintended impacts from planning options on downstream river quality; including benefits from water demand management and rainwater harvesting, and costs from wastewater reuse. Finally, we present a novel management planning option between supply and wastewater, which we refer to as Abstraction-Effluent Dilution (AED), that is, to reduce river abstractions during high precipitation events to dilute untreated sewer spills. The AED option is found to provide up to £200 million worth of equivalent infrastructure in river quality improvements and has minimal impact on the reliability of water supply while requiring only a change in operational decision making. This proof-of-concept study highlights that seeing our water systems differently with this holistic approach could fundamentally change the way we think about future water infrastructure planning so that it works both for people and the environment.
Export citation and abstract BibTeX RIS

Original content from this work may be used under the terms of the Creative Commons Attribution 4.0 license. Any further distribution of this work must maintain attribution to the author(s) and the title of the work, journal citation and DOI.
1. Introduction
The impact of water infrastructure on river quality has long been a key element in the wider discussion around water planning and management (Gleick 2003, Vörösmarty et al 2010). Without due consideration to environmental impacts, water infrastructure cannot be described as sustainable (Loucks 2000). This desire to put the environment central to planning can be facilitated by a systems modelling approach (Coombes and Kuczera 2002, Kasprzyk et al 2018). When the planning focus changes, specifically to the river quality in this work, the system boundaries may need to be expanded (Vogel et al 2015). There is a growing literature showing how the expanding of system boundaries changes the behaviour of modelled processes in water systems (Coombes et al 2016) and even to the extent that would require a system to be managed differently (Dobson et al 2019b).
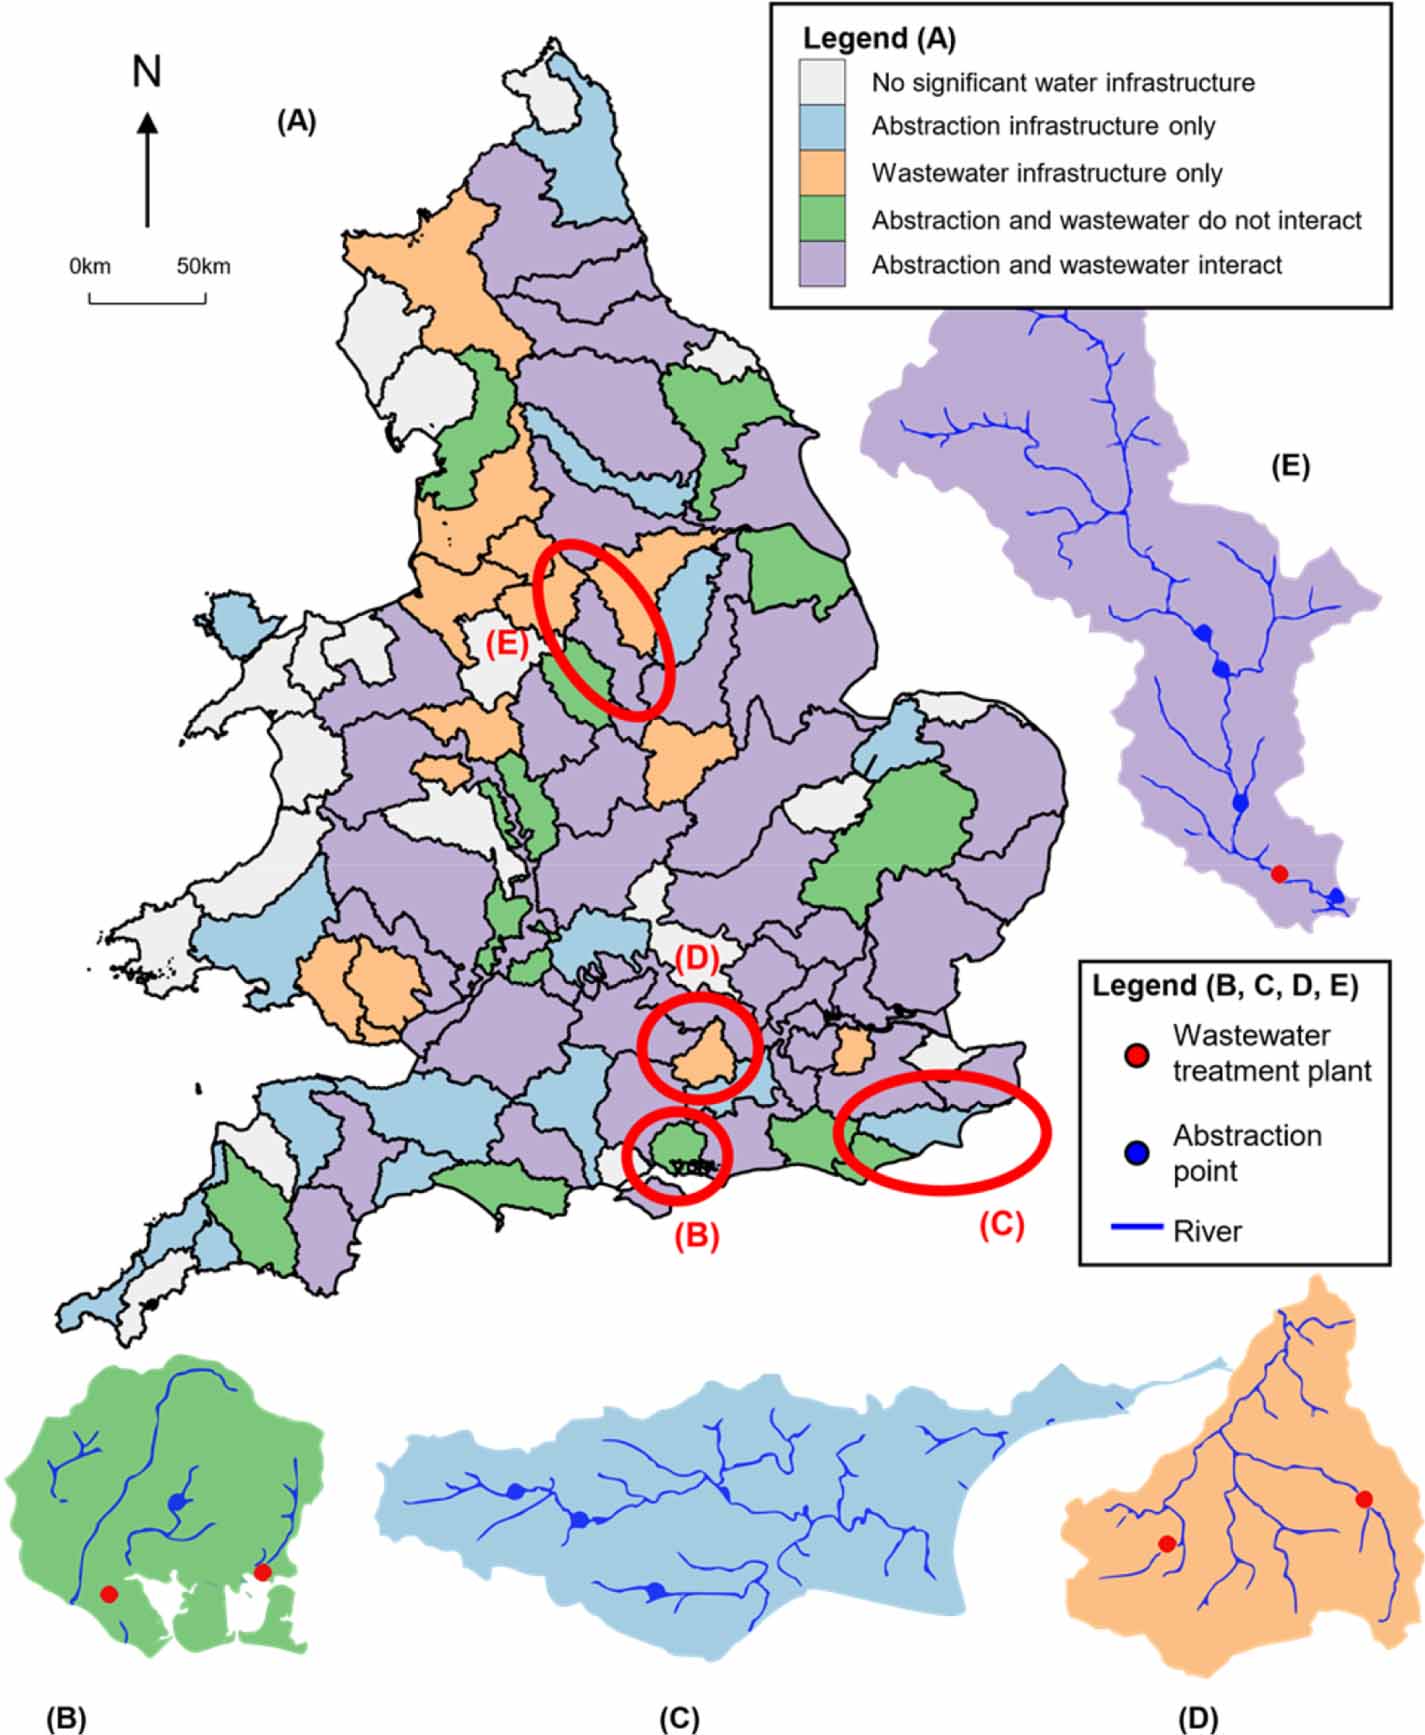
We look to the urban water system to illustrate this point. It covers rivers, groundwater, wastewater and water supply systems. Each of these systems are typically managed separately yet most of them are operationally connected; for example, water supply abstractions reduce river flows and thus increase the concentration of wastewater effluent discharge in a river. To illustrate this, we show how wastewater and water supply infrastructure interact in catchment management regions across England and Wales in figure 1. We find that almost half of the catchments have large wastewater plants (serving > 100 000 people) and water supply abstractions (>2 Ml d−1) interacting by discharging/abstracting from the same rivers (purple, figure 1(E)). We see that the remaining catchments have minimal interaction along rivers, 13% have wastewater plants and abstractions on different rivers (green, D), 13% have wastewater plants but no significant abstractions on rivers (orange, C), 16% have significant abstractions on rivers with no large treatment plants (blue, B) and 19% have no significant water infrastructure on rivers (grey).

Figure 1. (A) A map depicting how different catchments (Environment Agency 2019a) have different levels of interaction between water supply and wastewater along rivers, indicated by colour. (B)–(E) Catchments that illustrate different levels of interaction; rivers are shown as blue lines (Ordnance Survey 2019), wastewater treatment plants serving > 100 000 people as red points (European Commission 2016) and water supply abstractions > 2 Ml d−1 as blue points (Environment Agency 2015).
Download figure:
Standard image High-resolution imageDespite the interdependency apparent in figure 1, the UK's supply and wastewater planning processes remain distinctly segregated. In water supply, infrastructure projects are currently evaluated by their impact on continuity of supply, relying on licensed abstraction limits to account for river quality (Cook et al 2017). In wastewater, there is a focus on the occurrence and severity of both volume and pollutant content of effluent discharges—rather than considering the waters that receive them (Water UK 2019). Biases in river quality estimation are to be expected for any water infrastructure project if planning remains separate, but the real system is connected. Some infrastructure projects, such as wastewater reuse, to be accurately assessed will inherently require conceptualisation over the entire urban water cycle (Behzadian and Kapelan 2015).
Models that capture interactions between different water system processes fall broadly under 'integrated water management' models (Rahaman and Varis 2005, Mitchell 2006). These types of models are most commonly found as joint sewerage network and urban runoff models (Bach et al 2014, Salvadore et al 2015). However, other examples of integrated water management models exist, for example: supply-drinking water quality (Mortazavi‐Naeini et al 2019), household waste-sewerage-runoff (Bailey et al 2019), supply-sewerage-runoff-treatment (Rozos and Makropoulos 2013, Behzadian and Kapelan 2015, Coombes et al 2016), and supply-river quality (Paredes-Arquiola et al 2014). Most integrated modelling applications for planning, thus far, have been focused on the design of new physical components (e.g. installation of wastewater reuse). However, analysis of operational management has been shown to hold great potential in many individual fields of water research, e.g. reservoir optimisation (Dobson et al 2019a), distribution (Zhao et al 2016) and wastewater control (Olsson et al 2014). Therefore, we suggest that considering operational coordination at an urban water system scale would be beneficial and constitute a 'joint management' approach. Although we explore one such joint management option in this paper, we envisage that a wide range of alternatives could be revealed with the support of an integrated modelling tool.
In this paper, we illustrate a case for a wider systems view of the urban water cycle in water planning and management. We argue that unintended consequences can be incurred by choice of modelled processes resulting in bias for estimating river quality, and that unexpected benefits may be revealed when the system is considered in an integrated fashion. This case is based on three hypotheses. First, we assume that if a city's supply and wastewater systems abstract water and discharge into connected rivers but are modelled separately, then their estimations of river quality will be significantly different than if they had been modelled together. Next, we propose a novel joint management option of reducing water supply abstractions during high precipitation events to dilute sewer spills and reduce the concentration of untreated effluent during spill events to the extent that it could complement infrastructure-based options. Although detailed modelling of the interaction between this joint management option and flood risk is outside the scope of this study, we provide a simple comparison to check the impact. Finally, we argue that water infrastructure planning options will impact state variables across the wider water system revealing co-benefits and trade-offs in integrated water planning. These hypotheses can only be tested in an integrated model that spans the urban water system. Thus, we also present an open-source lumped water management model of a stylised, London-based system.
2. Methods
When models aim to represent multiple components of the urban water cycle over large geographical areas, the complexity of the system representations tends to be reduced. This has led to a lumped 'directed-graph' approach, pioneered by the Aquacycle software (Mitchell et al 2001) and with recent implementations such as CityDrain3 (Burger et al 2016). However, these approaches have been constrained to the wastewater system only. In this work, we build on the lumped directed graph approach to facilitate holistic modelling of the urban water cycle. Movement of water is simulated using mass balance equations with simplified representations such as: basic operation rules, proportional mixing of pollutants, seasonal water demand, surface runoff coefficients, and steady-state water treatment. While this approach introduces numerous limitations from a perspective of detailed physically-based modelling (e.g. ignoring biological and chemical influences on water quality, or complex activities that take place to mitigate drought impacts), we believe that the trade-off in process representation is justified in the interest of holistic modelling. We also provide a simplistic validation to ensure the model is sufficient to study the proposed hypotheses in the Experimental Setup section.
2.1. CityWat: an open-source water management model of London
A daily timestep, open-source lumped water management model of a stylised, London-based system (CityWat hereafter) has been developed for this work—see acknowledgements for its Python model code, with equations described in supporting material S1 (available online at https://stacks.iop.org/ERL/15/114026/mmedia). We note that, although targeted to London, CityWat is modular and can easily be rearranged and generalised to a range of cities. The processes represented in CityWat for this study are depicted in figure 2(A).
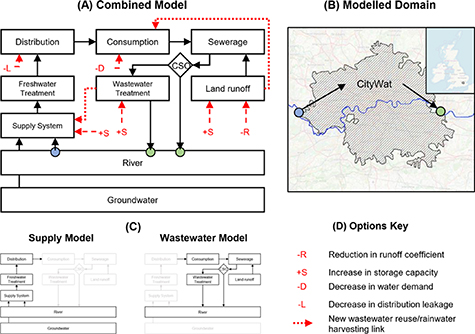
Figure 2. (A, top left) In black is a schematic depicting the processes and data flow represented in CityWat, planning options are highlighted in red. Abstraction and discharges points are indicated in blue and green respectively. CSO stands for 'combined sewer overflow' (B, top right) The region represented by our model, with abstraction and discharge locations indicated by circles. (C, bottom left) Two framings of the water system, a supply-only model and wastewater-only model. (D, bottom right) The key for the different generic planning options included in our study, which are linked into CityWat illustrated in red in Figure 2(A).
Download figure:
Standard image High-resolution imageEach process in CityWat is represented by a lumped model at city scale, shown in figure 2(B). For example, supply reservoirs are aggregated into one London-wide reservoir. This lumping ensures an efficient and easy to understand water management model, and it also enables sharing of parameter information openly without privacy or national security concerns. River flows and groundwater availability are represented by data (detailed in supplementary material S2). We note that this is a significant simplification of the real system. There are multiple abstractions and discharge points within the modelled region that CityWat aggregates together as well as upstream processes that model does not represent in detail. Thus, simulation results should be interpreted as a proof-of-concept rather than assessment or critique of current system operation.
Water system parameters (e.g. capacities of reservoirs or treatment plants) can generally be found openly at city-scale and are described in supporting material S2. Where this was not possible reasonable estimates have been made. S2 indicates the reasoning behind, and supporting sources for these estimates. Input data, i.e. flow and precipitation, have been sourced from the national river flow archive (Centre for Ecology and Hydrology 2020) and HadUK (Hollis et al 2019) respectively. London is fortunate in its environmental data records and so the simulation period spans the period between 1903 and 2018. In the Experimental Setup, we verify how effectively the model simulates historic data.
2.2. Impact of water system boundaries on modelled river quality
The first hypothesis in our case for expanding the model boundaries was that: if a city's supply and wastewater systems abstract and discharge water into connected rivers but are modelled separately, then their estimates of river quality at the downstream boundary will be significantly different than if they had been modelled together. To test this, we treated different models of the system in question each as a plausible representation of the system. Treating a model in this way can be referred to as a 'framing' of the system (Quinn et al 2017). Thus, we formulated three framings of London's water system. The first is the integrated water system, unchanged from figure 2(A). This combined framing represents the systems view of the urban water cycle. The second is the supply-only portion of the system including processes between the river and point of water consumption by customers, depicted in figure 2(C), left. This is a water supply framing of the water cycle. The third is the wastewater-only portion of the system including processes between the waste production of customers to wastewater treatment work effluent, depicted in figure 2(C), right. This is a wastewater framing of the water cycle.
We hypothesised that downstream river water quality could be a key indicator to assess the performance of the system as a whole. We propose concentration-based metrics formulated from the proportion of downstream river flow. The raw river water, treated effluent and untreated effluent proportions are used to illustrate differences in simulated river quality between framings. Given CityWat's lumped scale, any metric that quantifies the impact of the urban water system on downstream river quality will ultimately be some derivative of these three proportions. As an example of this derivation, we also included phosphorus concentration, which is conceptualised as the phosphorus concentration of raw river water, treated and untreated effluent blended in proportion to their volumetric presence in the river. We chose phosphorus because it is a significant pollutant in the River Thames and has high concentrations in sewage that are reduced significantly by treatment (Jarvie et al 2006, Gooddy et al 2017).
To ensure that we consider socio-economic factors as well as environmental, we have also included two metrics for reliability of water supply. These are total supply reservoir volume over time and the level of water use restrictions (e.g. a level 3 restriction allows enforcement of hosepipe bans while a level 4 restriction allows standpipe use). Water use restrictions are based on reservoir levels, described in Mortazavi‐Naeini et al (2019). These metrics do not perfectly capture the complexity of the water resources planning process in the UK (Cook et al 2017), but we believe serve as an adequate proxy in this proof-of-concept study.
2.3. Evaluation of planning options from an environmental perspective
It became clear when viewing the urban water cycle from a systems perspective, which the combined CityWat framing provides, that there were potential opportunities to improve river quality through a joint management approach. As anticipated in our second hypothesis, we have proposed using water supply abstractions to manage untreated effluent spill events, which we term 'Abstraction Effluent-Dilution' (AED). The working principle behind this option is illustrated in figure 3. In the Experimental Setup section, we perform a pilot experiment to design the implementation of this option.
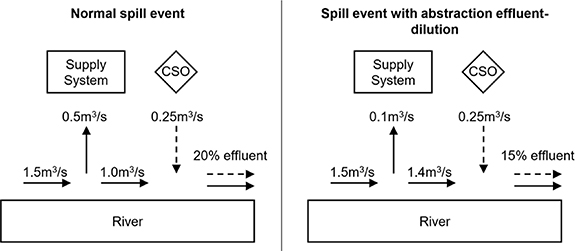
Figure 3. A simplified system schematic that illustrates the working principle of abstraction effluent-dilution, with the raw water flows (normal arrows) and untreated spill flows (dashed arrows) represented for a normal spill event (left) and spill event with abstraction effluent-dilution (right). The values shown are for illustrative purpose only and not representative of the case study. CSO stands for 'combined sewer overflow'.
Download figure:
Standard image High-resolution imageBesides AED, we also examined conventional water infrastructure options. In the UK, the water supply planning process (termed water resources management planning (Cook et al 2017)) has been in place since the privatisation of the water industry in 1985, with the feasibility of several project options (e.g. new reservoirs, leakage reduction targets) already assessed. In contrast, the wastewater planning process (termed drainage and wastewater management planning (Water UK 2019)) is still being developed. Thus, we selected a range of feasible options for supply and commonly proposed options for wastewater planning to test in CityWat alongside AED, which we summarise in table 1.
Table 1. A summary of the different options we test in CityWat using a historical demand scenario (described in supplemental material S1), how they are implemented and at what scale. 'Option impact' describes how much of the option could be installed using the costs described in 'Capital cost' with a budget of £300 million.
| Sector | Option | Description in model | Capital cost | Option impact |
|---|---|---|---|---|
| Integrated | Abstraction Effluent-Dilution | Minimise abstractions when precipitation is high and supply reservoirs are nearly full | Negligible | Dilutes untreated effluent from spill events |
| Supply | Wastewater Reuse | Allows treated effluent to be made potable and re-directed to the supply system | £2 m/(Ml d−1) (Environment Agency 2019b) | Adds 150 Ml d−1 in wastewater reuse capacity |
| Supply | New reservoir | Increase supply reservoir capacity | £12 500/Ml (Borgomeo et al 2018) | 24 000 Ml increase in reservoir capacity |
| Supply | Demand reductions | Reduce per-household water demand | Negligible (in comparison to other options) | 10% reduction in household consumption (achievable by 2035, (Environment Agency 2019b)) |
| Supply | Leakage reduction | Reduce level of leakage in the distribution network | £1.6 m/(Ml d−1) (NERA 2019) | 190 Ml d−1 reduction in leakage (about 35%, achievable by 2035 (Environment Agency 2019b)) |
| Wastewater | Green roofs | Reduces equivalent impermeable area by green roof area multiplied by 50% (the assumed runoff reduction) | £100/m2 (AECOM 2017a) | 3 km2 of green roofs installed, covering 2% of London's roof area |
| Wastewater | Rainwater harvesting | Creates volume that can store rainwater on roofs and be redirected to household demand | £280/(400 l unit) (AECOM 2017a) | Units installed on all of London's roofs, 700 000 units providing 280 Ml of storage |
| Wastewater | Stormwater storage tanks | Increases storage for water that reaches treatment works but cannot be treated that day | £2 m Ml−1 (AECOM 2017b) | Increase temporary stormwater storage by 150 Ml. |
In order to compare options from both sectors, we have gathered estimates of unit costs and implement each option with a 'budget' of £300 million. Some options are constrained by factors other than cost (e.g. demand reductions, whose cost to implement is negligible in comparison with infrastructure projects), thus we provided realistic estimates for these instead. The options we included are illustrated in figures 2(A) and (D).
Our third hypothesis was that infrastructure options impact state variables in the systems they exist in, but also those that they interact with, which could have implications for assessing systems level benefits of proposed schemes. Thus, we compared all metrics for all options.
3. Experimental setup
3.1. Verification of the CityWat model
CityWat is a stylised model and primarily illustrative, with parameter values estimated based on openly available data to capture the behaviour of key system processes. We have performed a model verification based on the supply reservoir volume data shared in Mortazavi‐Naeini et al (2019), figure 4. We see that CityWat simulates reservoir volumes broadly in line with other, more complex models of the London's supply system (Nash-Sutcliffe Efficiency = 0.85). The worst model performance is during the 1976 drought. We expect this is due to the lack of emergency supply sources represented in CityWat in contrast to the models it is being compared against. We do not include these emergency supply sources since information about them cannot be made open-source for security reasons and the complexity of decision-making during droughts is increased involving many factors that cannot be modelled in CityWat. Although this will overestimate the absolute occurrence of water use restrictions, all comparisons in this study are relative and thus we expect the impact to be minimal.
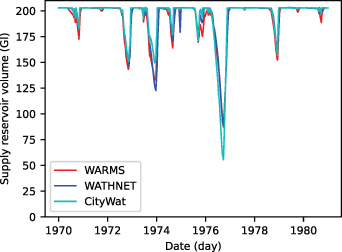
Figure 4. A comparison of active supply reservoir volume for three different daily simulation models of London's water supply. WARMS (red) is the water company model of the system. WATHNET (blue) represents a research water supply model that has been based on WARMS, implemented in the WATHNET supply simulation software (Kuczera 1992). CityWat (cyan) is the model presented in this study. Gl stands for Gigalitres.
Download figure:
Standard image High-resolution imageIn figure 5 we compare simulated downstream phosphorus from CityWat with 123 water quality samples at two sampling sites downstream of the modelled region, using data from the WIMS archive (Environment Agency 2020). The agreement between modelled and sampled phosphorus indicates that CityWat's estimates of treated effluent discharge are reasonable and therefore it is accurately representing wastewater system processes. The two outliers (circled in green), when CityWat simulates much higher levels of phosphorus than the samples, occur during untreated spill events, which the samples do not capture. When these spill events are removed the correlation coefficient with sample site 1 is 0.75 and 0.51 with sample site 2.
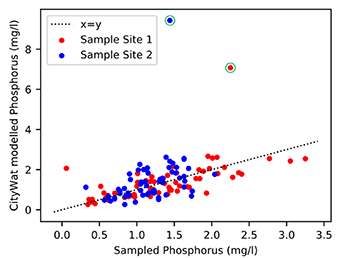
Figure 5. A comparison of phosphorus simulated by CityWat (y-axis) and 123 water quality samples (x-axis) at two different locations (indicated by colour) taken between 2000–2018. Days with modelled combined sewer overflow occurring are circled in green.
Download figure:
Standard image High-resolution imageThe only openly available data on spill events that the authors could identify was that the average annual spill of untreated effluent is between 32 and 40Mm3/y (Hamilton 2013). CityWat spills 36Mm3/y on average over the entire simulation period, within the estimated value.
3.2. Creating an AED rule
We now provide a pilot experiment that examines when storm spill events occur to see if they follow any clear patterns to design an AED rule. In figure 6 we plot the severity of simulated spills (indicated by proportion of river that is untreated effluent) against precipitation data and simulated supply reservoir volume. In supplementary material S3, we provide a simple replication of figure 6 but with river flow to show that AED is unlikely to significantly interact with flood risk. We note that, were AED tested in operational conditions, a more complex design would be required than the heuristic we present here to safeguard supply security and test detailed interactions with risks such as flooding.

Figure 6. A scatter plot with daily climate data (A) and modelled storage (B), over the period 1903–2018, on the x-axis with modelled untreated effluent, as simulated by CityWat, on the y-axis. Red points are those that occur on days when both precipitation is greater than 10 mm d−1 and supply reservoirs are greater than 99% full, black points are all remaining days.
Download figure:
Standard image High-resolution imageInspecting precipitation, we see that severe spill events typically occur on days when precipitation is >10 mm (upper panel, figure 6, 80% of points that are greater than 0 on the y-axis occur with x–values greater than 10). We also see that most spill events are occurring when supply reservoirs are nearly full (lower panel, figure 6, 70% of points that are greater than 0 on the y-axis occur with x–values greater than 200).
Thus, when the model is run using the AED option, water supply abstractions on the River Thames are minimized when both reservoirs are >99% full and precipitation is >10 mm. We would not expect this to have a significant impact on reliability of water supply since only 2% of days (those highlighted in red in figure 6) meet these criteria and if reservoirs are nearly full then under-abstracting is likely to be low risk. Yet abstraction can significantly reduce the flow (up to 5Gl/d), so we expect that 'leaving it in' could significantly dilute untreated effluent.
To test how effective AED is, we examine simulated phosphorus levels. We also test the water supply reliability metrics to check whether the option would put water supply at risk.
4. Results
4.1. Estimates of the impact of model boundaries on water quality
In figures 7(A)–(D) we plot river quality state variables at the point of downstream discharge estimated by the different framings, showing distinct differences between them. We present a subsection of figures 7(A)–(D) over a shorter period in figures 7(E)–(H) to better observe patterns in the timeseries.
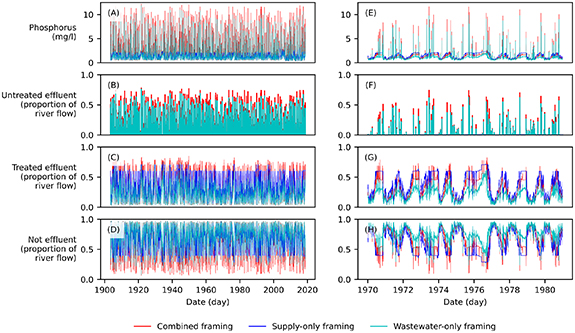
Figure 7. (A)–(D) Downstream river quality represented by daily effluent and phosphorus concentration timeseries under the three different model framings (represented by different colours) for the simulation period (1903–2018). (E)–(H) the same as (A)–(D) but for a subsection of the simulation period (1970–1980).
Download figure:
Standard image High-resolution imageA significant discrepancy occurs in the supply-only framing. Since it does not represent storm spill events it will not simulate any concentration of untreated effluent (figure B, no blue) and so underestimates phosphorus concentrations (figure A, blue never rises above 1.5 mg/l).
The wastewater-only framing overestimates downstream river quality in all metrics. By ignoring river abstractions it underestimates treated and untreated effluent concentrations (cyan is lower than red in figures B, C) and overestimates raw river water concentration (figure D). This results in underestimating the impact of spill events, although not necessarily their occurrence (red and cyan peaks line up in figures B, C). If this framing were used to inform future planning, the equivalent stormwater storage required to reduce untreated effluent spills to these underestimated levels would be 600 Ml. Following table 1, this could exceed £1 billion of infrastructure investment.
4.2. AED effectiveness
In figure 8 we plot phosphorus concentration and reservoir volume simulation results both without and with AED.
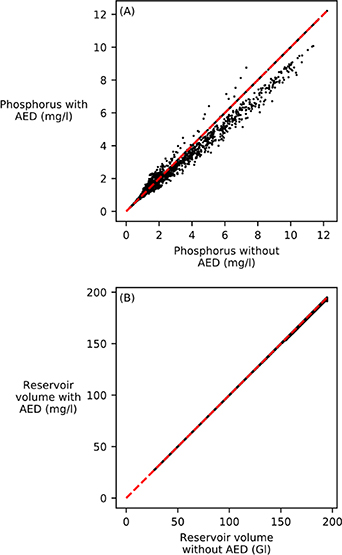
Figure 8. Downstream river quality represented by phosphorus concentration (upper) and water supply reliability represented by reservoir volume (lower) both with (y-axis) and without (x-axis) the abstraction effluent-dilution option (AED) for the simulation period (1903–2018). The red dashed line is x = y.
Download figure:
Standard image High-resolution imageWe see in the phosphorus levels (upper panel) that AED reduces the severity of spill events (most points are either on or below x = y). Although AED does not alleviate spills completely, particularly when the reservoirs are at low levels, the volume of stormwater storage that would be required to achieve the same improvement is 200 Ml, costing £100 millions. When inspecting reservoir volumes (lower panel) we also see a small negative impact (points are slightly below x = y). These lower volumes increase the level of restrictions by an additional six days of level one restrictions over the entire simulation period. Since these do not cause actual disruptions, only representing awareness campaigns (Mortazavi‐Naeini et al 2019), we can consider this impact negligible.
4.3. Systems assessment of water management options
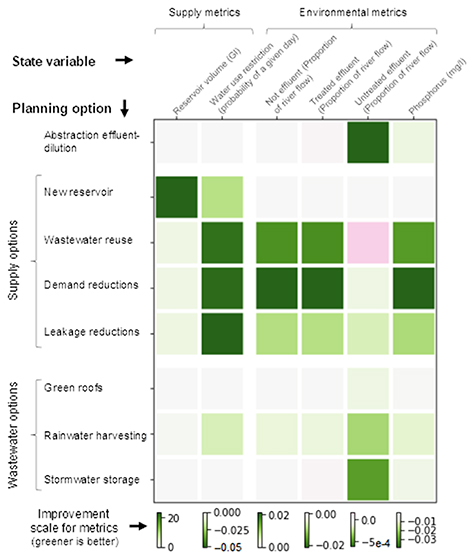
In figure 9, we plot how the different options change state variables that indicate system performance averaged over the entire timeseries. A greener colour indicates an improvement (e.g. reduction in water-use restrictions or increase in proportion of downstream river flow that is not effluent), grey indicates no change and pink indicates a worsening (e.g. increase in untreated effluent).
Figure 9. Colour grid showing how different options compare to each other with respect to absolute change in various state variables averaged over the entire timeseries, 1903–2018, (greener indicates a greater improvement while more pink indicates a decrease in performance). The change is the difference in a metric relative to the simulation without the option implemented (units given at top of column where option state variables are described).
Download figure:
Standard image High-resolution image
In context, we see that the AED option (first row) of minimizing abstraction during high precipitation is an effective method to reduce untreated effluent concentration (i.e. first row, fifth column is the deepest green).
Among the water supply options, we see improvement in all water supply metrics (first and second columns), but also that they interact with water quality metrics. This interaction occurs through two mechanisms: changing the amount of water abstracted and changing the amount of treated effluent discharged. Each of wastewater reuse, demand reductions and leakage reductions interact with river quality via these mechanisms, but they do so differently.
Wastewater reuse (third row) improves quality metrics (except during spill events) by reducing treated effluent discharge and reducing the need for river abstraction. It does, however, also increase the concentration of untreated effluent during storm spill events (i.e. third row, fifth column is pink). This occurs because a portion of treated stormwater is being directed to the supply system rather than diluting the untreated storm spill effluent. We note that non-potable reuse (i.e. discharging into the river to enable greater abstractions) would have entirely negative impacts on water quality—since it is enabling greater abstractions without changing the amount of effluent.
Demand reductions (fourth row) improve downstream river quality outside of spill events in the same way—reducing household effluent and reducing river abstractions. Demand reductions do not change untreated effluent concentration since the amount of treated stormwater discharged during spill events is unchanged.
Leakage reductions (fifth row) reduce river abstractions but do not change treated effluent output. Therefore, their impact on raw water, treated effluent and phosphorus is not as strong as demand reduction or wastewater reuse (i.e. third, fourth and sixth columns in the fifth row are less green than in the third and fourth rows). However, leakage reductions do interact with spill events due to reduced abstractions and unchanged treated effluent output, diluting untreated effluent during spills (i.e. fifth column is light green).
A new reservoir simulated with historical water demand (second row) does not change abstractions or effluent discharge so does not interact with water quality downstream of the CityWat model domain.
Wastewater planning options have less impact on the wider urban water cycle—targeting primarily untreated effluent concentration.
The exception is rainwater harvesting, which impacts both supply and wastewater metrics (seventh row, green in all columns). If implemented at a city scale, it may reduce water use restrictions by supplying 90% of outdoor water demand not met by rainfall. However, this supply occurs disproportionately outside of drought conditions since harvesting tanks dry up during severe droughts, so the impact is not as significant as it might be. This repurposing of rainfall reduces river abstractions and treated effluent discharge so improves river quality outside of spill events. The impact on untreated effluent is smaller than we might expect, given the large storage capacity provided, since the storage is often full when storms that trigger spill events occur.
Green roofs (sixth row) reduce untreated effluent by reducing runoff from roofs that would go to sewers; however, this impact is relatively small compared to other options because the proposed area is small (2% of London's rooftop area, compared to 100% for rainwater harvesting, table 1).
Stormwater storage (eighth row) behaves as expected, reducing untreated effluent but without wider impacts beyond that.
5. Discussion
Our case for a wider systems view of the urban water cycle in planning and management was based on three hypotheses. The first was that abstracting and discharging into the same river while planning wastewater and supply separately will induce model errors in estimating downstream river quality. In our proof-of-concept analysis (figure 7) we find this error to be significant. We believe this provides evidence that by explicitly accounting for the river state, we can identify unforeseen environmental risks. Abstraction licences for water suppliers are intended to safeguard UK rivers, however, as figure 1 highlights, water quality on most rivers is not solely dependent on supply-side actions. Meanwhile, proposed metrics for wastewater system performance in Water UK (2019), typically only consider the time of year when discharges are made, not accounting for flows in their receiving waters nor the operation of the supply system. The results presented here provide evidence that the use of in-river water quality metrics are required to account for the environment in water planning.
The second hypothesis was that our proposed joint management option (AED), could significantly reduce the concentration of spilled untreated effluent. Our results in figures 8 and 9 show that it achieves a performance comparable to infrastructure-based options, despite only being a new channel for information in operations. In figure 8 we see that it attains these gains without reducing supply reliability, even though it occasionally limits abstraction. We also highlight that a water company has complete control of this option, unlike some of the other analysed options (e.g. demand reductions or rainwater harvesting). Thus, we argue that AED could be added to the water companies' portfolio of future interventions, albeit with more nuanced design than the simple heuristic presented here to account for factors such as flood risk management.
The final hypothesis was that planning options will impact state variables across the wider urban water cycle. Figure 9 shows evidence of this. We see how supply-side options may improve river quality by reducing abstractions. We also see that wastewater reuse may worsen the impact of untreated effluent spills by redirecting stormwater that would be released as treated effluent (diluting the spill) back into the supply system. Accounting for these systems level interactions in cost-benefit analysis could have a significant impact on long-term planning decisions for water infrastructure.
6. Future direction and concluding remarks
This work demonstrates the case for integration and provides a proof-of-concept for achieving it. However, we recognise that the presented top-down approach is not a panacea for water planning and management, nor that the planning options assessment we perform should be taken as literal recommendations for future investment. Although CityWat's model simulations have been compared against historic reservoir volume and river samples of phosphorus (figures 4, 5) showing good agreement considering the model's simplicity, the field of integrated modelling research has yet to converge on a suitable technique to reliably validate these types of models (Voinov and Shugart 2013, Belete et al 2017, Tscheikner-Gratl et al 2019). Additionally, we use simplistic representations of any individual modelled process in comparison to the state-of-the-art.
CityWat's lumped approach also assumes homogeneity in a heterogeneous system. This prevents assessment of small-scale interventions, impacts of upstream water quality on abstractions and the role of options that improve system connectivity, such as the Thames Tideway Tunnel project (Loftus and March 2019). This project will link up London's storm spill overflows to its largest wastewater treatment works, and so cannot be represented by a city-scale lumped model.
In addition, our assessment is based on water management criteria only, and the approach should be extended to include wider benefits of multifunctional infrastructure such as green roofs (Ossa-Moreno et al 2017, Hattab et al 2020). Finally, the modelling approach is yet to be tested on how it could be used for flood risk management (Rezazadeh Helmi et al 2019), planning under deep uncertainty (Erfani et al 2018, Babovic and Mijic 2019) and examination of how different combinations of options might interact in a portfolio approach (Kasprzyk et al 2012).
In a survey of water managers, Höllermann and Evers (2017) found that model boundaries were the most commonly cited source of uncertainty. We hope that the scientific and wider communities interested in the sustainability of water systems will continue to build evidence for the importance of system boundaries on model simulations, and study how best to carry out integrated modelling to support the water industry in a future with fewer boundaries and one in which the environment is placed central to planning and management.
Acknowledgments
The research reported in this paper was taken as part of the CAMELLIA project (Community Water Management for a Liveable London), funded by the Natural Environment Research Council (NERC) under grant NE/S003495/1. The models and data in this work https://doi.org/10.5281/zenodo.3764678 will continue to be updated at https://github.com/barneydobson/citywat. The views expressed in this paper are those of the authors alone, and not the organisations for which they work. The authors are grateful to Professor Adrian Butler, Professor David Balmforth and two anonymous reviewers for comments on an earlier version of the manuscript that have improved the paper.
Data availability statement
The data that support the findings of this study are openly available at the following URL/DOI: 10.5281/zenodo.3764678.