

Abstract
The Global Climate Observing System and Global Terrestrial Observing Network have identified permafrost as an 'Essential Climate Variable,' for which ground temperature and active layer dynamics are key variables. This work presents long-term climate, and permafrost monitoring data at seven sites representative of diverse climatic and environmental conditions in the western Russian Arctic. The region of interest is experiencing some of the highest rates of permafrost degradation globally. Since 1970, mean annual air temperatures and precipitation have increased at rates from 0.05 to 0.07 °C yr−1 and 1 to 3 mm yr−1 respectively. In response to changing climate, all seven sites examined show evidence of rapid permafrost degradation. Mean annual ground temperatures increases from 0.03 to 0.06 °C yr−1 at 10–12 m depth were observed in continuous permafrost zone. The permafrost table at all sites has lowered, up to 8 m in the discontinuous permafrost zone. Three stages of permafrost degradation are characterized for the western Russian Arctic based on the observations reported.
Export citation and abstract BibTeX RIS

Original content from this work may be used under the terms of the Creative Commons Attribution 4.0 licence. Any further distribution of this work must maintain attribution to the author(s) and the title of the work, journal citation and DOI.
Introduction
Permafrost plays an important role in global climate change and the functioning of natural and human systems in Northern Eurasia (Anisimov et al 2010, Stocker et al 2013, Romanovsky et al 2017, Groisman et al 2017, Shiklomanov et al 2017). Both near-surface active layer dynamics and thermal properties of the permafrost system are key components of permafrost, an 'essential climate variable' as defined by the Global Climate Observing System and the Global Terrestrial Observing Network. Long-term data are presented here from the Thermal State of Permafrost (TSP) and Circumpolar Active Layer Monitoring (CALM) network sites representative of the western Russian Arctic.
The Russian European Arctic and Northwestern Siberia (collectively referred to as the western Russian Arctic) are experiencing some of the highest rates of permafrost degradation (Romanovsky et al 2018, Biskaborn et al 2019). Regional climate warming in this region is projected to be almost twice the global average, which will result in increased permafrost degradation in Northern Eurasia through the end of the century (Arzhanov et al 2013, Anisimov et al 2013, Romanovsky et al 2017). Previous studies of permafrost in the Russian Arctic have already documented permafrost degradation manifested by warming temperatures, increasing annual active layer thickness, and northward retreat of permafrost extent (Oberman 2008, Vasiliev et al 2008, Streletskiy et al 2015, Drozdov et al 2015, Kaverin et al 2017, Biskaborn et al 2019, Boike et al 2019, Abramov et al 2019).
While climatic factors play major roles in explaining permafrost and active layer trends across large regions, local vegetation and soil variability can also significantly offset these trends (Streletskiy et al 2014). For example, permafrost temperatures in peatlands, mires, and bogs were found to have less response to atmospheric variability compared to well-drained landscapes with little organic material, such as sandy tundra and blowouts (Melnikov et al 2004, Vasiliev et al 2008, Streletskiy et al 2012). The variable response of different landscapes underlain by permafrost to changing climatic conditions therefore warrants further investigation to better inform large scale models and economic development in permafrost regions. Based on observations from the western Russian Arctic presented here, generalized pathways of permafrost degradation under climate change and disturbance are characterized.
Study area
Seven sites distributed between the Kanin and Gydan Peninsulas were identified as dominant landscape conditions characteristic of the western Russian Arctic, and therefore established as locations for long-term permafrost monitoring in the mid-1970s. Kumja (site 1), Bolvansky (2), and Vorkuta (3) are located in the European part of Russia (west of the Polar Urals) and Marre-Sale (4), Nadym (5), Northern Urengoy (6) and Southern Urengoy (7) are located in West Siberia (east of the Polar Urals) (figure 1). All sites discussed in this work are presently part of the TSP and CALM networks.

Figure 1. Sites included in this study: Kumja (1), Cape Bolvansky (2), Vorkuta (3), Marre-Sale (4), Nadym (5), Northern Urengoy (6), and Southern Urengoy (7). Sites are representative of bioclimatic subzones D (site 4) and E (sites 1, 2, 3, and 6) defined by Walker et al (2005), mixed forest and tundra (site 7), and northern taiga (site 5).
Download figure:
Standard image High-resolution imageThe geographic distribution of these sites allows for spatial and thermal permafrost change to be assessed along latitudinal and longitudinal gradients in the region. These sites are also representative of three bioclimatic subzones (C, D, and E) within the western Russian Arctic. Arctic bioclimatic subzones defined by vegetation and summer temperatures, where subzone A is the coldest and least vegetated and E is the warmest and most vegetated (Walker et al 2005). Brief descriptions of each site are provided with climatic data based on daily averages of air temperature, precipitation, and snow from the closest available weather stations for the period from 1970 to 2017.
Site 1: Kumja
Kumja, or site 1 (68° 14' N, 53° 51' E) is located on a river terrace 5–10 m.a.s.l. on an island in the Pechora River Inlet within bioclimatic subzone E, or typical southern tundra. The closest weather station is 100 km away at Cape Bolvansky which reported −4.4 °C mean annual air temperature (MAAT), 404 mm total annual precipitation, and 60 cm average annual snow depth over the observed period.
Site 2: Cape Bolvansky
Cape Bolvansky, or site 2 (68° 18' N, 54° 30' E) is located on a marine terrace 24 to 30 m.a.s.l. on the Barents Sea coast near the Pechora River inlet. Site 2 (close to site 1) is also located within bioclimatic subzone E and shares the Cape Bolvansky climate data reported in the previous section. Snow depths averaged at this site are 20 cm on the upland and 120 cm in the drained lake basin here.
Site 3: Vorkuta
Named for its proximity to the city of Vorkuta, site 3 (67° 35' N, 64° 11' E) is also within bioclimatic subzone E. The closest weather station is 13 km away in Vorkuta which reported −5.6 °C MAAT and 550 mm mean annual precipitation for the observed period (Kaverin et al 2017).
Site 4: Marre-Sale
Named for the nearby Marre-Sale Polar Station, site 4 (69° 43' N, 66° 45' E) is located on a fluvio-marine terrace 20–30 m.a.s.l. on the Kara Sea and is the only site within bioclimatic subzone D, or typical tundra. The weather station located at this site reported −7.9 °C MAAT, 320 mean total annual precipitation, and 30–40 cm mean annual snow depth for the observed period.
Site 5: Nadym
Site 5 (65° 20' N, 72° 55' E) is named for the city of Nadym 20 km away and is representative of northern taiga. Climatic characteristics for this site were obtained from the closest station located in Nadym which reported −5.7 °C MAAT, 470 mm mean total annual precipitation, and 80 cm for average annual snow depth.
Site 6: North of Novy Urengoy
Located 150 km north of Novy Urengoy city is site 6 (67° 28' N, 76° 41' E) 30–35 m.a.s.l. on a marine terrace (Drozdov et al 2015). This site is representative of bioclimatic subzone E. The closest weather station is in Novy Urengoy that reported −7.1 °C for MAAT, 420 mm mean total annual precipitation, and 115 cm for average snow depth over the observed period.
Site 7: South of Novy Urengoy
Site 7 (66° 19' N, 76° 54' E) is 30 km south of Novy Urengoy in birch and larch dominated mixed forest-tundra. Due to the proximity to Novy Urengoy, site 7 shares the climate data reported for site 6 in the previous site description.
Methods
The seven sites are all part of the Global Terrestrial Network on Permafrost with instillations to monitor both the thermal state of permafrost and active layer thickness (ALT). Boreholes in landscape sub-units at each site are part of the TSP network and spatially oriented thaw measurements and near-surface soil temperature monitoring are part of the CALM network. Long-term monitoring data from sites associated with both networks within the study area are presented below in the context of regional climate trends as documented by nearby weather stations.
Thermal State of Permafrost (TSP) sites
Temperature monitoring is being performed at all sites (table 1). All but one borehole (R2 at site 3) are 10–12 m deep and were installed more than 35 years ago (1972–1983). The depth of these boreholes corresponds with the general depth of zero annual amplitude in this region upon instillation. Sites 1 through 5 represent undisturbed environmental conditions while sites 6 and 7 are in areas previously used for clear-cut logging that have since revegetated. Clear cutting occurred before these boreholes were installed at sites 6 and 7, and measurements here are illustrative of an initial pulse of permafrost degradation despite subsequent revegetation over the last 40 years. All sites provide valuable long-term thermal records through, for both undisturbed and disturbed landscapes.
Table 1. Borehole site descriptions. Borehole numbers correspond with the TSP† and CALM‡ databases.
| Borehole No.† | ALT Grid No.‡ | Landscape | ||||
|---|---|---|---|---|---|---|
| Site | Permafrost zone | (observation period) | (installation, size) | position | Vegetation cover | Soil texture |
| 1 | Sporadic | 3 (2016-) | R24a (2010, 1 ha) | Drained shrub tundra | Moss, lichens | Sand with gravel |
| 2 | Continuous | 54 (1983–1993; 1999-) | R24 (1999, 1 ha) | Wet tundra | Mosses, lichens | Interbedded sand, loam |
| 55 (1983–1993; 1999-) | Polygonal peat bog | Mosses, lichens | Peat (upper 0.4 m), loam | |||
| 56 (1983–1993; 1999-) | Peatland | Mosses, lichens | Peat (upper 2 m), loam | |||
| 59 (1983–1993; 1999–2016) | Drained tundra | Mosses, lichens, frost boils | Loam with gravel | |||
| 65 (1983–1993; 1999-) | Wet tundra | Mosses, sedge | Interbedded sand, loam | |||
| 83 (1983–1993; 1999–2016) | Drained tundra | Mosses, lichens | Interbedded loam, sandy loam | |||
| 3 | Discontinuous | 0.5 m (1999-) ‡ | R2 (1996, 1 ha) | Moist tundra | Mosses, shrubs | Loam |
| 4 | Continuous | 1 (1978-) | R3 (1995, 1 km2) | Moist tundra | Mosses, lichens, shrubs | Sandy loam |
| 3 (1978-) | Saturated tundra | Mosses, lichens, shrubs | Sandy loam, loam | |||
| 6 (1978-) | Well-drained Tundra | Mosses, lichens, shrubs | Sandy loam, sand | |||
| 17 (1979-) | Peatland | Mosses, lichens, shrubs | Peat (upper 1.6 m), sandy loam | |||
| 36 (1978–2001) | Peat bog | Mosses, sedges | Peat (upper 0.3 m), sand | |||
| 43а (1978-) | Sandy blowout | No vegetation | Sand | |||
| 5 | Sporadic | 11–75 (1975-) | R1 (1997, 1 ha) | Peat bog | Grasses, shrubs, mosses, lichens | Peat (upper 1 m), sand |
| 14–72 (1972-) | Peat bog | Grasses, shrubs, mosses, lichens | Peat (upper 0.5 m), sand | |||
| 23–75 (1975-) | Peat bog | Shrubs, grasses, mosses | Peat (upper 0.5 m), sand, loam | |||
| 1–71 (1971-) | Frost mound | Grasses, shrubs, mosses, lichens | Peat (upper 0.3 m), sand | |||
| 6 | Continuous | 15–03 (1975-) | R50b (2008, 1 ha) | Flood plain | Shrubs, mosses on peat | Loam |
| 15–06 (1975-) | Well-drained slope | Grasses, willow, alder | Loamy sand, loam | |||
| (max. 2.5 m) | ||||||
| 15–08 (197-) | Well-drained hill | Shrubs, mosses | Loam | |||
| 15–20 (1975-) | Well-drained hill | Shrubs, mosses | Loam | |||
| 7 | Discontinuous | 5–01 (1975-) | R50a (2008, 1 ha) | Well-drained slope | Logged larch, regrowth (1.5 m) | Loamy sand, loam |
| 5–03 (1975-) | Pingo | Birch, larch undergrowth | Loamy sand, loam | |||
| 5–07 (1975-) | Water track | Tussock tundra, grasses | Peat (upper 1 m), loam | |||
| 5–08 (1977–2010) | Well-drained slope | Larch forest | Sand, sandy loam | |||
| 5–09 (1975-) | Disturbed surface | Burnt birch forest, birch, shrub undergrowth | Sand | |||
| 5–10 (1975-) | Water track | Grasses and mosses | Peat (upper 0.4 m), sand |
Temperature measurements in these boreholes were originally conducted using mercury thermometers inserted in metal casings filled with brass. The accuracy of these early thermometers was ± 0.1 °C. Measurements were recorded manually at 0.5, 1.0 m, and subsequent 1 m intervals to the bottom of a particular borehole, every 10 days until 1990, after which they were taken manually at least annually at the end of the warm season. In 2003 all boreholes were equipped with 4-channel Hobo U12 loggers with ±0.1 °C measurement accuracy in accordance with monitoring guidelines laid out by GTN-P (Biskaborn et al 2015). Automated measurements using these Hobo loggers were then collected at 2.0, 3.0, 5.0, 10.0 and, if total borehole depth allowed, 12.0 m every 6 hours.
Circumpolar Active Layer Monitoring (CALM) sites
After 1995, gridded active layer measurements were conducted annually at all seven sites according to CALM protocols (Brown et al 2000). Either a 100 × 100 m (1 ha) or 1 km2 grid with grid nodes every 10 or 100 m, respectively, was established to cover the variety of land covers characteristic of a given site. Thaw depth is measured by manually inserting a metal probe 2 m long until the point of resistance, interpreted as the permafrost table. Thaw depth was measured annually at the end of the thaw period which differs between sites. On the measurement date the average of at least three probe measurements is recorded for each grid node yielding 121 spatially distributed thaw depth values for a given landscape. In locations where thaw depth is deeper than 2 m (total length of a probe), every two or three years, a hand drill is used to determine the permafrost table depth. If the hand drill could not reach the permafrost table, Ground Penetrating Radar (GPR) was employed, though the accuracy is ±0.2 m in sand, a common substrate at the study areas (Melnikov et al 2010, Sadurtdinov et al 2018).
In 1997 CALM instillations at sites 1 through 5 were also equipped with 2-channel Hobo Pro, and later, Hobo Pro V2 temperature data loggers to monitor near-surface soil temperatures at depths less than 2 m. Similar to the data loggers installed in the nearby boreholes, these loggers were programmed to record temperatures every 6 hours and have a measurement accuracy of ±0.1 °C.
Results
Climate change in the western Russian Arctic
Site MAAT decreases toward the northeast of the study area from −3.9 at Cape Bolvansky to −7.6 °C at Marre-Sale. All six weather stations showed increasing MAAT trends over the 1970–2016 observation period. The highest rates of temperature warming (0.07 °C yr−1) were reported at the northernmost Cape Bolvansky and Marre-Sale weather stations on sea coast. Inland weather stations also exhibited increasing trends in MAAT, but at significantly lower rates. For instance, the lowest rate documented was 0.05 °C yr−1 in Nadym (figure 2(A)).

Figure 2. (A) Mean annual air temperature (MAAT), (B) maximum snow cover depth, and (C) total annual precipitation based on observation records from weather stations identified as closest to each permafrost monitoring site.
Download figure:
Standard image High-resolution imageTotal annual precipitation reported at these five weather stations varies from 320 to 470 mm yr−1. All stations displayed increasing precipitation trends from 1 to 3 mm yr−1 since 1970. Inland sites, such as Nadym and Novy Urengoy, experienced slightly higher rates of precipitation increases compared to stations on the coast.
Snow depths exhibit deepening gradients north to south and from east to west. Snow depths are considerably deeper in mixed forest-tundra and taiga to the south compared to tundra landscapes to the north. For example, in the mixed forest near Novy Urengoy average annual snow depth was 114 cm as opposed to the tundra near Nadym where it was 85 cm. Also, sites in the east part of the study area, such as Vorkuta and Marre-Sale had shallower mean annual snow depths, 44 and 33 cm, respectively, while Cape Bolvansky to the west had 58 cm on average. Total annual snow accumulation is increasing at all sites too. Over the 1998–2018 period snow accumulation increased by 1.8 cm yr−1 on average in tundra landscapes and 0.6 cm yr−1 in northern taiga and mixed tundra-taiga (figure 2(B)).
Near-surface permafrost temperature trends
Active layer soil temperatures from 1997 to 2018 show progressive warming at sites 1 through 5. Initially during the observation period, active layer temperatures from tundra landscapes were from –8.0 °C to –6.0°C, and from –3.8 °C to –1.9 °C at southern sites. By 2007 active layer temperatures increased to –4.8 °C in the typical tundra subzone, and are approaching 0 °C at southern sites (figure 3).
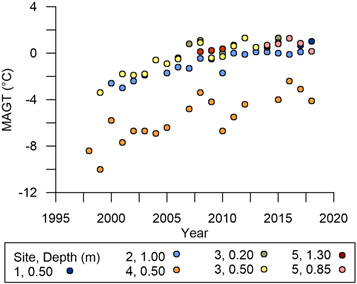
Figure 3. Mean annual ground temperature (MAGT) within the active layer. See table 1 for site descriptions.
Download figure:
Standard image High-resolution imageThe average rate of warming during the 1997–2007 period was 0.25 °C yr−1. After passing the melting point of water, the rate of temperature change decreased to 0.06 °C yr−1. All but site 4 experienced near-surface permafrost thaw, highlighting the fact that permafrost degradation may occur quickly even in locations with relatively cold permafrost.
Trends in permafrost table position
Increasing thaw and therefore ALT also entails permafrost table lowering. Sites located in typical tundra (bioclimatic subzone D) on continuous permafrost show increasing ALT from 104 to 117 cm during the period from 1997 to 2018. Sites located in southern tundra (bioclimatic subzone E) also show evidence of permafrost table lowering (figure 4). At site 2, the permafrost table has lowered from 1.2 m below the ground surface in 2000 to 1.8 m in 2016, a depth below the average site ALT. At site 1 the permafrost table lowered 0.4 m in the year from 2015 to 2016. However, seemingly in contradiction, throughout the observation period the permafrost table does not appear to have lowered, but previous work by Kaverin et al (2017) suggests that this could be attributed to regional subsidence of the ground surface. Corrected for subsidence, the permafrost table at site 3 has lowered from 0.6 m below the ground surface in 1999 to 1.2 m in 2015.
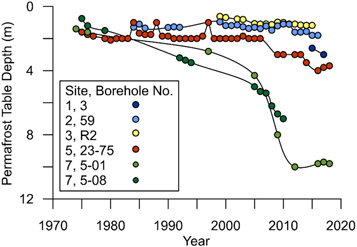
Figure 4. Depth of maximum annual thaw (permafrost table) from select boreholes representative of regional trends. See table 1 for borehole site descriptions.
Download figure:
Standard image High-resolution imageDespite similar climatic conditions at sites 5 and 7, the greatest changes in permafrost table position were in well-drained mixed forest-tundra at site 7. The near-surface peat at site 5 affords better thermoinsulation than the well-drained sands at site 7. Permafrost table lowering was noticeable at site 7 over the first 20 years of observation, but degradation accelerated markedly in the 2000s until it was 10 m below the ground surface by 2014. Similarly, the permafrost table at borehole 5–08 at the same site lowered 3 m in the 2000s until it was 7 m below the ground surface by 2010, after which monitoring at this borehole was discontinued. The permafrost table also lowered by 2 m in northern taiga, characterized by bogs and polygonal peatlands (site 5). Meanwhile, peatland (site 2) appeared relatively stable.
Permafrost temperature trends with depth
Figure 5 highlights sites in a latitudinal gradient (from 66° to 69° N) also representative of major bioclimatic subzones, all of which show permafrost warming since the beginning of observation (figure 5(A)). Since the 1970s, the highest rate of permafrost temperature increase in the study area and globally was at site 4 (Marre-Sale) with temperatures at the depth of zero annual amplitude increasing 0.06 °C year−1 (this and subsequent rates reported are significant at p < 0.01). Although, permafrost temperatures here are relatively cold, ranging from −3.5 °C in a sand blowout (borehole No. 43a) and −5 °C in wet tundra (borehole No. 3). Mean annual permafrost temperature on the flood plain at site 4 is now −2 °C. In the 1970s site 4, representative of bioclimatic subzone D, or typical tundra, had five out of six boreholes with average annual temperatures from −7.4 °C (borehole 6 in well-drained tundra) to −5.5 °C (borehole 1 in moist tundra). The outlier at this site was borehole 36, located on the river flood plain with an average temperature of −4.5 °C. This spatial variability in permafrost temperature is attributed to differences in snow accumulation. The flood plain where borehole 36 is located accumulates twice the snow height relative to nearby zonal tundra landscapes. While spatial variability in warming are attributable to different soil and vegetation conditions at the site, various landscapes here had little influence on the response of permafrost temperature to warming climate as they all displayed similar warming rates (figure 5(B)).
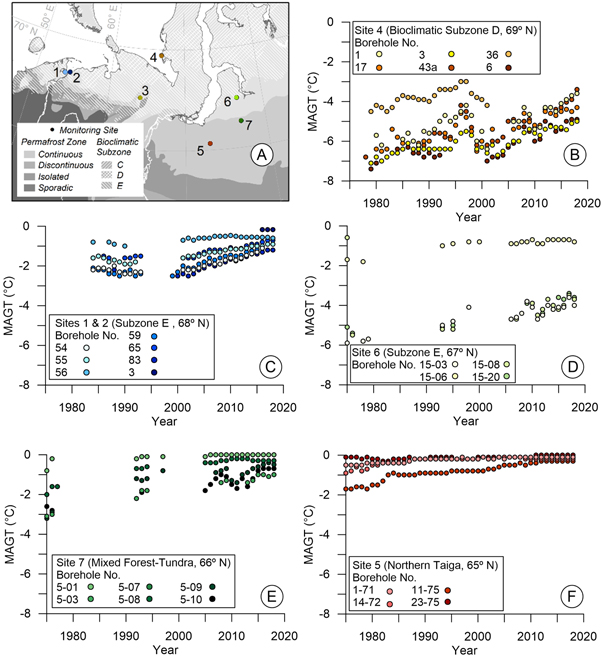
Figure 5. Mean annual ground (permafrost) temperature at maximum depth (10 or 12 m depending). (A) Site locations highlighting latitudinal gradient, (B) site 4, (C) sites 1 and 2, (D) site 6, (E) site 7, (F) site 5. See table 1 for borehole site descriptions.
Download figure:
Standard image High-resolution imagePermafrost temperatures in southern tundra, or bioclimatic subzone E, are represented by sites 1, 2 (figures 5(C)) and 6 (figure 5(D)). At site 2, permafrost temperatures in the 1980s range from −2.4 °C to −1.5 °C with the exception of the borehole in a polygonal peat bog with a temperature of −0.8 °C (borehole No. 56). The latest mean annual temperatures show that moist tundra (borehole 65) is now −0.7 °C and well-drained tundra (borehole 83) is −1.2 °C, while the polygonal peatland warmed only slightly to −0.6 °C. Permafrost temperatures at site 1 (only borehole 3) are greatly affected by snow accumulation. Tall shrubs accumulate snow redistributed by wind resulting in 1.5 times the snow accumulation at nearby shrub-free areas. The proximity of the Pechora River and the talik beneath also influence local thermal conditions. Considering borehole 3 has a short record (2016–2018), mean annual permafrost temperature has not changed significantly (−0.2 °C to −0.15 °C) (figure 5(C)), but the results of GPR profiling indicate the permafrost table is lowering (Sadurtdinov et al 2018).
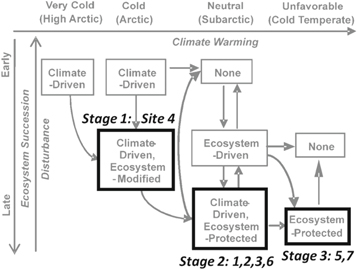
Figure 6. Modification of Shur and Jorgenson (2007), p 11 'classification of climate-ecosystem-permafrost interactions' with superimposed degradation stages characteristic of the rapidly warming western Russian Arctic and sites that exemplify each.
Download figure:
Standard image High-resolution image
Boreholes at both sites 2 and 6 (figures 5(C) and (D)) have warmed at average rates of 0.04 °C and 0.05 °C yr−1 respectively. Both sites are within bioclimatic subzone E in relatively cold permafrost (e.g. site 6 boreholes 15–03, 15–08, and 15–20) where mean annual permafrost temperatures have warmed from cooler than −5 °C in 1975 to −3.5 °C in 2018. Meanwhile, in well-drained shrub landscapes (borehole 15–06) permafrost temperature was higher and experienced less pronounced warming (from −1.8 °C in 1978 to −0.8 °C in 2018) (figure 5(D)).
Mean annual permafrost temperatures in mixed forest-tundra at site 7 ranged from −3.7 °C to −2.6 °C in the 1970s (boreholes 5–03, 5–07, 5–09, and 5–10) and currently range from −1.0 °C to −0.2 °C, increasing at an average rate of 0.045 °C year−1. Boreholes 5–01 and 5–08 were installed in disturbed landscapes previously logged and burned respectively. Both borehole temperature records warm 2 °C–0.6 °C over the same period. This warming brought borehole 5–01 to the 0 °C thawing threshold and both disturbed landscapes have experienced substantial permafrost table lowering (figure 5(E)).
In northern taiga at site 5 mean annual permafrost temperatures are all warming, but following different trends depending on landscape. The three boreholes in bogs at site 5 are now above −0.2 °C, while the one borehole in polygonal peat remains at −0.3 °C (figure 5(F)). In the bog the permafrost table has lowered to 4 m below the ground surface and the average rate of permafrost warming in northern taiga was 0.035 °C yr−1. This underscores the moderating role of peat under warming climatic conditions.
Discussion
Stages of permafrost degradation observed in western Russian Arctic
The results of long-term permafrost and active layer monitoring show three distinguishable stages of permafrost degradation along the latitudinal gradient of bioclimatic subzones present in the western Russian Arctic. This classification of degradation stages serves as an application and elaboration of the 'climate-ecosystem-permafrost' patterns of formation and degradation described by Shur and Jorgenson (2007) based on Alaskan observations (figure 6). Permafrost in the western Russian Arctic was formed through climate-driven processes, however the Pleistocene-Holocene transition and now rapid anthropogenic-driven warming are altering permafrost distribution here as the landscape returns to a state of equilibrium, where disturbance and recovery are balanced (Melnikov 1984).
The initial stage of degradation is a progressive increasing in ALT while permafrost temperatures remain relatively cold. Similarly, the transient layer, affected by climate over decades to centuries, can play a protective or buffering role for underlying permafrost, though extreme hot summers may partially thaw the transient layer (Shur 1988, Shur et al 2005). This initial stage is characteristic of observed trends from site 4 in bioclimatic subzone D Shur and Jorgenson (2007) refer to this as 'climate-driven, ecosystem-modified permafrost' that is thermally stable, but more susceptible to thaw.
The second stage, referred to as 'climate-driven, ecosystem-protected permafrost,' is where enhanced permafrost degradation is initiated after the complete thaw of ground ice in the transient layer. During this stage surface covers, and particularly peat, can moderate warming climatic signals. Accelerated thaw results in increased near-surface temperatures followed by the permafrost table lowering. Cold winters with little snow accumulation may provide conditions for short-term permafrost recovery, or aggregation, but the absence of developed segregation ice typically found in the transient layer may only temporarily slow rather than reverse long-term degradation. Sites 1, 2, 3 and 6 are examples of this metastable stage of permafrost degradation in tall shrub ecosystems of southern tundra, or bioclimatic subzone E.
The third and final stage is when progressive lowering of the permafrost table reduces the active layer to a seasonally frozen layer followed by temperatures at the depth of zero annual amplitude warming and exceeding 0 °C. This third stage occurs with progressive warming, like the situation in the forest-tundra at site 5, or disturbance, like the logged and burned taiga at site 7, of 'ecosystem-protected permafrost' (Shur and Jorgenson 2007).
While regional climate warming is the major driver of changes observed causing vertical permafrost degradation, ecosystem variability, particularly related to vegetation and soil properties, determine where permafrost is more resilient or susceptible to warming climate signals. For instance sites in degradation stages 1 and 2 may recover as ecosystem-driven permafrost dependent on biophysical (e.g. vegetation and organic matter accumulation) and micro-climatologic factors. Progressive climate warming however, means degrading permafrost is unlikely to re-aggrade.
Conclusions
Long-term permafrost monitoring records presented here from the western Russian Arctic show drastic permafrost system degradation from the mid-1970s to 2018 in response to rapid climate change. Regionally, MAATs have been increasing from 0.05 to 0.07 °C yr−1 and precipitation increased 1 to 3 mm yr−1 and since the late-1990s this has particularly manifested as snow. Warming air temperatures and added winter insulation are driving observed permafrost degradation, including active layer thickening, permafrost table lowering, and increasing mean annual ground temperatures. Mean annual near-surface soil temperatures throughout the region, except at the northernmost site 4, have increased above 0 °C, suggesting that vertical permafrost thaw is an ongoing process in all landscapes represented in this regional monitoring network. Similar to the findings of Romanovsky et al (2019) the site with the coldest permafrost is warming fastest (site 4), while the warmest permafrost (site 5) is continues to warm at reduced rates. Over the same period, 2000–2018, used in the regional comparison by Romanovsky et al (2019) site 4 MAGT has warmed from 0.80 °C to 1.3 °C decade−1 (p < 0.001) placing it amongst the fastest warming permafrost in the Arctic (e.g. Biskaborn et al 2019).
Permafrost table lowering was particularly pronounced at sites in low-ice content southern tundra (bioclimatic subzone E) lowering on average 7 m during the observation period. Meanwhile, in other bioclimatic subzones the permafrost table has lowered less than 2 m, but still exceeding the average ALT. In mixed forest-tundra the permafrost table is currently 7 to 10 m below the ground surface in well-drained landscapes, and 4 to 6 m below ground in northern taiga with warming and degradation beginning in the mid-1990s.
The highest rates of permafrost warming were found in tundra (bioclimatic subzone D) where permafrost temperature increased up to 0.056 °C yr−1 despite variability in vegetation or soil characteristics. Conversely, the lowest warming rates were in northern taiga (0.035 °C yr−1). Southern tundra (bioclimatic subzone E) and mixed forest-tundra experienced relatively moderate permafrost warming at rates ranging from 0.04 °C to 0.05 °C yr−1.
The proposed conceptual stages for permafrost degradation based on observations along a longitudinal and bioclimatic gradient through the study region can be applied to other parts of the Arctic with similar gradients present. Comparing these to the previously published degradation pathways classified by Shur and Jorgenson (2007) provide qualitative projections for regional landscape change and new type areas for advancing permafrost degradation.
Acknowledgments
We thank numerous researchers and students who participated in data collection at CALM and TSP sites in the western Russian Arctic and the larger global datasets comprising GTN-P. This study was funded by the Russian Foundation for Basic Research project No. 18–05–60004.
Data availability
The data that support the findings of this study are openly available at DOI https://doi.org/10.1594/PANGEA.884711 (GTN-P global permafrost mean annual ground temperature near the depth of zero annual amplitude) for the 2007 to 2016 period. Active layer thickness and near-surface temperature data are available through the CALM program web page at https://2.gwu.edu/~calm/data/north.htm.