

Abstract
Indonesia is the world's second largest producer and third largest consumer of seafood. Fish is therefore essential to the nation, both financially and nutritionally. Overfishing and the effects of climate change will, however, limit future landings of capture fisheries, so any increases in future seafood production will need to come from aquaculture. The ecological effects of aquaculture are dependent upon the choice of species, management, and where it is sited. In the present study we use life cycle assessment (LCA) to evaluate how possible interventions and innovations can mitigate environmental impacts related to the aquaculture sector's growth. The mitigation potential of six interventions were also quantified, namely (1) FCR reductions for whiteleg shrimp, carp, and tilapia; (2) sustainable intensification of milkfish and Asian tiger shrimp polyculture; (3) shifting groupers from whole fish diets to pellets; (4) favoring freshwater finfish over shrimp; (5) renewable electricity; and (6) reduced food waste and improved byproduct utilization. If all six interventions are implemented, we demonstrate that global warming, acidification, eutrophication, land occupation, freshwater use, and fossil energy use could be reduced by between 28% and 49% per unit of fish. The addition of many innovations that could not be quantified in the present study, including innovative feed ingredients, suggest that production could double within the current environmental footprint. This does not, however, satisfy the expected 3.25-fold increase under a business-as-usual scenario, neither does it satisfy the government's growth targets. We therefore also explore possible geographical areas across Indonesia where aquaculture expansions and ecological hotspots may conflict. Conclusively, we advocate more conservative production targets and investment in more sustainable farming practices. To accelerate the implementation of these improvements, it will be central to identify the most cost-effective aquaculture interventions.
Export citation and abstract BibTeX RIS

Original content from this work may be used under the terms of the Creative Commons Attribution 3.0 licence. Any further distribution of this work must maintain attribution to the author(s) and the title of the work, journal citation and DOI.
1. Introduction
The Indonesian Ministry of Marine Affairs and Fisheries (KKP/MMAF) has set ambitious growth targets for most aquaculture species of around 8.5% growth per annum up to 2030 (IDH 2018), to satisfy national demand and increase exports (Directorate General of Aquaculture 2017). This is while Indonesia is already the third largest seafood consuming nation, after China and Japan (Guillen et al 2019), and fourth largest exporter of shrimp, after India, Ecuador, and Argentina (comtrade.un.org accessed 12-Sep-2019). At present, over 80% of capture fisheries and 95% of aquaculture production in Indonesia is consumed domestically (Belton et al 2017). Despite this, both macro- and micronutrient deficiencies remain common in Indonesia (Usfar and Fahmida 2011). The consequent 'nationally recommended diet' advises increased consumption of both meat and fish (Behrens et al 2017).
Most seafood consumed in Indonesia still originates from capture fisheries (FAO 2018), but many fish stocks are fully or overexploited, with no potential for further increase. Future fish catches may even decline by over 30% due to predicted climate change and other anthropogenic stressors (Cheung et al 2016). This shifts emphasis toward aquaculture production, which is already well established across the country. However, competition for suitable land and resources is intensifying, posing conservation challenges in a country with numerous biodiversity hotspots (Gaither and Rocha 2013, Murray et al 2015), many of which have already been degraded (Maynard et al 2010, Abood et al 2015). In planning for sustainable growth of aquaculture, consideration will therefore need to be given to how different species and variations of production systems relate to resources and ecosystems, both at the national and local levels.
Indonesia's aquaculture industry is today dominated by freshwater finfish species, including tilapia, clarias catfish, carp, and pangasius catfish (3 277 k MT in total in 2017) (BPS 2018). This is followed by brackish water farming of shrimp and milkfish (1 621 k MT). The contribution from mariculture remains marginal (around 78 k MT), when excluding seaweed farming (10 547 k MT) and bivalves (50 k MT). Of these, shrimps are the most frequently exported farmed seafood commodity, both by volume and value, followed by tilapia (FAO 2019). Whiteleg shrimp production (Litopenaeus vannamei) was also the aquaculture species for which production has increased the fastest over the last five years, more than doubling in output (FAO 2019).
Previous work explored possible growth scenarios for the Indonesian aquaculture industry by using growth projections from the AsiaFish model (Dey et al 2016, Tran et al 2017) and environmental consequences from life cycle assessment (LCA) modeling (Henriksson et al 2017b). Both these studies explored six scenarios, including business as usual (BAU), stagnant capture fisheries, export-oriented aquaculture, domestic-oriented aquaculture, slow aquaculture growth, and a disease outbreak scenario in shrimp and carp (Henriksson et al 2017b). The major conclusions from these studies showed that none of the six alternative scenarios explored could satisfy the MMAF growth targets, and most would result in serious environmental consequences both locally and globally. All these projections built upon current aquaculture farming practices. In this article, we evaluate possible innovations and interventions that would allow the aquaculture sector to increase production with less additional stress on the environment. Reflections will also be made in terms of provincial differences, with regards to ecosystems, infrastructure, and additional sectors (Guilmoto and Jones 2016).
The main research question is whether better farming practices and innovations will allow Indonesia to meet production targets up to 2030 without jeopardizing functions of existing ecological systems. In order to address this question, we have updated the dataset by Henriksson et al (2017a, 2017b) and shortlisted possible interventions and innovations for more sustainable farming practices. The 2030 production target was assumed to be in line with the business-as-usual scenario (BAU) from Tran et al (2017), projecting a 3.3-fold increase in production volumes by 2030 based upon the AsiaFish model. We discuss our results, giving consideration to spatial planning and important ecosystems.
2. Material and methods
2.1. Primary data
Building upon the lifecycle inventory dataset from Henriksson et al (2017a, 2017b), supplementary data (available online at stacks.iop.org/ERL/14/124062/mmedia) were collected for shrimp, milkfish polyculture, and carp farming in ponds during the spring of 2018. Nineteen farms were visited on Java during this fieldwork, nine of which were common carp (Cyprinus carpio) pond farms, five were whiteleg shrimp farms, and five were Asian tiger shrimp farms (Penaeus monodon). Consequently, farming in Java, Sumatra, Lombok and Sulawesi were represented, representing grow-out cycles between 2014 and 2017. Individual farmers were identified through local partner networks, with an overrepresentation of farmers proximal to urban centers. These data were averaged with the previous dataset to create the unit process dataset for eight species and ten systems. Bivalves farming systems were not evaluated as their contribution remains marginal.
This dataset detail eleven farming system: tilapia in cages (n = 5) and in ponds (n = 4); carp in cages (n = 6) and in ponds (n = 8); pangasius in cages (n = 6) and in ponds (n = 3); clarias in ponds (n = 5); milkfish in ponds (n = 3); milkfish and Asian tiger shrimp in ponds (n = 8); whiteleg shrimp (n = 11); and grouper (n = 5). Groupers were included as a representative for marine finfish, even though they currently make up only 1.4% of overall production volume (BPS 2018), as mariculture is expected to expand proportionately faster than other aquaculture sectors (Tran et al 2017). The unit process dataset was averaged using the protocol for horizontal averaging by Henriksson et al (2014), including dispersion estimates around inventory flows. Asian tiger shrimp and milkfish polyculture exhibited the largest overall dispersions, suggesting more variable farming practices. The updated unit process data are presented in the supporting material (SM).
2.2. Secondary data
Geographical data were sourced from Giri et al (2011), Global Forest Watch (2014), United Nations Environment Programme and World Conservation Monitoring Centre (UNEP-WCMC) (2010), and UNEP-WCMC (2017) comprising land use, mangrove forests, coral reefs, and seagrass beds. Land use was classified as forested, including protected areas and regions of logging moratorium (up to 2017) or land concessions, including logging and palm oil concessions, and plantations. The condition of mangrove forests, coral, and seagrass beds were classified based on an assessment by BPS-Statistics Indonesia and Subdirectorate of Enviroment Statistics (2018), and maps were assembled using ArcGIS v10.5.
The unit process dataset for the LCA was supplemented with methane emissions from freshwater ponds, assuming 533 kg ha−1 yr−1 (coefficient of variation (CV) = 0.4; lognormal distribution) (Astudillo et al 2015). Emissions resulting from land use and land-use change of mangroves were derived from Järviö et al (2018), assuming 129 tonnes CO2 eq. ha−1 yr−1 (CV = 0.441, lognormal distribution), but not included in the global warming estimates due to the difficulty of assigning land use and land-use change to specific species.
2.3. Life cycle assessment
LCA is an ISO-certified (ISO 2006) environmental assessment framework that allows whole production chains to be evaluated. In this study, however, impacts were only evaluated up to farm gate, including impacts related to producing feed and feed raw materials, electricity generation, extraction and refining of diesel, and transportation. Impacts related to processing, cold storage, packaging, and consumption were not considered, but could be assumed to be similar among products and generally have a marginal influence on overall performance (Henriksson et al 2015). Edible yields and nutritional content were not considered either, but would have a stronger influence on conclusions. The LCA matrix was structured and calculated using the CMLCA v5.2 software, relying upon ecoinvent v2.2 for background processes. Overall dispersions were calculated over 1 000 Monte Carlo simulations. Coproduct allocation was solved based upon mass, with results using economic allocation available in the SM. For a complete goal and scope, please see Henriksson et al (2017a, 2017b).
2.4. Aquaculture interventions (AqIs)
Building upon a nonstructured review of peer-reviewed and grey literature, alongside discussions with industry partners and academics, a list of possible aquaculture interventions and innovations (AqIs) was identified. A stakeholder workshop with industry, NGOs, and KKP/MMAF was also organized on 24 January 2019 in Jakarta to discuss which of the interventions were of relevance for Indonesian aquaculture (see SM for a complete list of interventions identified during the workshop). Many interventions were identified, but our requirements were that each intervention should: (1) be quantifiable using empirical data; (2) make a serious contribution to either of the six LCA impact categories under study; and (3) should be viable to operationalize before 2030. Subsequently, six interventions were explored: (1) FCR reductions for whiteleg shrimp, carp, and tilapia (Oreochromis spp.); (2) sustainable intensification of milkfish (Chanos chanos) and Asian tiger shrimp polyculture; (3) shifting groupers (Epinephelus spp.) from whole fish diets to pellets; (4) favoring freshwater finfish over shrimp; (5) renewable electricity; and (6) improved byproduct utilization and reduced food waste. Novel feed ingredients were only evaluated in theory, but not quantified as an intervention, as they remain highly diverse and rapidly evolving, subsequently LCA data remain unsatisfactory. Given variable costs for implementation and economy of scale, we choose not to estimate monetary value or number of jobs as socioeconomic indicators in this study, as was done in Henriksson et al (2017a, 2017b).
2.4.1. AqI1: improved feed efficiency in whiteleg shrimp, carp, and tilapia by 20%
Feed conversion ratio (FCR) can be a good indicator of how efficient animals in different systems are at converting feed into weight gain, although changed composition of feed ingredients also need to be accounted for (Fry et al 2018). The reported FCRs for whiteleg shrimp, carp, and tilapia farms visited for this study and by Henriksson et al (2017a, 2017b) were 1.45, 1.5–1.8, and 1.6–1.7, respectively. These are markedly higher than those reported in China (Cao et al 2015). Thus, through a combination of improved genetic strains, better environments, water monitoring, feeding practices, and best farm management practices (Henriksson et al 2017a, Ullman et al 2019), we assumed that FCRs for these species could be lowered by 20% by 2030 using existing feeds. This equates to FCRs of 1.16 for whiteleg shrimp, 1.33 for tilapia, and 1.5 for common carp; these values are on average still higher than actual FCRs measured by Cao et al and thus considered conservative estimates.
2.4.2. AqI2: sustainable intensification of milkfish and Asian tiger shrimp
Integrated milkfish and Asian tiger shrimp farming relies upon extensive farming practices, yielding less than two tonnes per hectare at two crops a year. Farming of these species has expanded in mangroves and resulted in biodiversity loss, and land use and land-use change emissions. Moreover, extensive brackish water farming consumes large volumes of fresh water for diluting marine water. Thus, by increasing the use of high quality extruded feed pellets to an FCR of 1.4 alongside better feeding practices, improved genetic strains, and overall better management practices, the stocking density could be increased to only require half the area for the same amount of shrimp and fish (Rimmer et al 2013, White et al 2018).
2.4.3. AqI3: shifting from low-cost fish to feed pellets as feed for groupers
The majority of grouper farms visited used low-cost fish as the main feed source, with 18 kg of whole fish used per kg grouper on average. Low-cost fish generally results in poor FCRs as it breaks up and is partially lost from cages (Sim et al 2005). Using whole fish is also problematic because of its short shelf-life and variable availability (Sim et al 2005) and diverts a source of nutritionally-rich food away from direct human consumption domestically (Buchary 2010, Thilsted et al 2016). In response, we propose a shift towards pelleted feeds for groupers and other carnivorous marine fish as an intervention to lower direct use of fish and reduced eutrophication. The reported FCRs for groupers being fed formulated feeds range between 1.5 and 3.1 (Sim et al 2005, Hasan 2012, Bunlipatanon et al 2014). From this range, we assumed that groupers by 2030 could be entirely fed by pelleted feeds at an FCR of 2. Even though these pelleted feeds contain 60% fishmeal and fish oil (Henriksson et al 2017b), and roughly 5 kg fish are needed per kg fishmeal (Parker and Tyedmers 2012), it is still a reduction of 16 kg wild fish per kg grouper.
2.4.4. AqI4: favoring omnivorous finfish species over shrimp
Henriksson et al (2017a, 2017b) concluded that omnivorous finfish species were associated with lower environmental impacts than shrimp and groupers. This as they required less fishmeal in feeds, had higher productivity per ha, and were less susceptible to disease. In AqI4 we consequently assumed that half of both the shrimp and grouper volumes (963 tonnes) would be replaced by tilapia, carp, clarias, pangasius, and milkfish from monoculture systems.
2.4.5. AqI5: renewable electricity
On-farm energy use varied greatly among farms and farming systems, from 68 208 MJ of petrol per tonne of grouper, to 31 MJ of electricity per tonne of panagsius. Nine of the eleven production systems were directly reliant on electricity from the Indonesian grid, and all indirectly through supporting processes ranging from nitrogen fixation to feed material processing (see SM for details). At present, most of this electricity is generated by burning coal, but Indonesia is also the third-largest producer of electricity from geothermal power plants and holds an estimated 40% of the world's geothermal potential, the equivalent of 28 000 megawatts (Hasan et al 2012, Semedi et al 2017). Electricity from large-scale (>100 MW) geothermal plants is cheaper than from coal power plants, but the initial costs and risk of return on investment are higher (Clauser and Ewert 2018). Indonesia also has great potential to expand both hydro and wind power. In 2016, however, only 4% of all electricity generated in Indonesia came from geothermal sources and 13% from renewable sources (iea.org; accessed 8 March 2019). In AqI5 we consequently aspire to all electricity in Indonesia originating from renewable sources by 2030. This means that all farms, feed mills, fishmeal factories, and crop mills in Indonesia would run on renewable electricity.
2.4.6. AqI6: improved byproduct utilization and waste reduction
The most efficient and sustainable way to increase food availability is to reduce waste. Seafood is perishable, so it has been estimated that 35% of fish and seafood is wasted globally, compared to 20% of meats or 30% of cereals (fao.org/save-food/en/; accessed 8 March 2019). Byproduct utilization, through reduction into fishmeal or other useful commodities, could also be improved in Indonesia as seafood is primarily sold whole, as in most parts of Asia (Newton et al 2014). AqI6 consequently expected that food waste could be halved in Indonesia by 2030; down from 35% to 17.5% thanks to better access to cold storage, more efficient supply chains, consumer awareness, and better byproduct utilization. The additional energy needed for refrigeration was not considered in this scenario, but would most likely be negligible (Henriksson et al 2015).
3. Results
3.1. LCA results of current production systems
The environmental impacts per tonne of product at farm gate are presented in table 1, with ranges of Monte Carlo simulations detailed in the SM. Groupers had the largest global warming impact, followed by common carp, shrimps, and milkfish from polyculture systems. Groupers were also associated with the largest eutrophication and fossil energy use impacts. Common carp, in the meantime, emitted the most acidifying agents. Milkfish and Asian tiger shrimp polyculture occupied the largest land areas and consumed most freshwater. If these systems had been established on converted mangroves, they would also be the largest greenhouse gas emitters, causing an additional 184 000–297 000 kg CO2-eq. t−1 shrimp or milkfish.
Table 1. Lifecycle environmental impacts from the production systems under study using mass allocation, scaled to one tonne of live animal at farm gate.
| Global warming | Acidification | Eutrophication | Land occupation | Fresh-water use | Fossil energy use | ||
|---|---|---|---|---|---|---|---|
| Species | System | kg CO2-eq. | kg SO2-eq. | kg PO4-eq. | m2a | m3 | MJ |
| A. tiger shrimp | Poly | 10 500 | 75.1 | 96.7 | 21 300 | 47 900 | 104 000 |
| Whiteleg shrimp | Ponds | 9430 | 80.8 | 120 | 7130 | 9700 | 108 000 |
| Milkfish | Ponds | 6600 | 69.8 | 103 | 14 300 | 3620 | 58 200 |
| Poly | 10 500 | 75.1 | 96.7 | 21 300 | 47 900 | 104 000 | |
| Clarias | Ponds | 5260 | 58.1 | 51.0 | 4680 | 241 | 52 800 |
| Pangasius | Ponds | 5060 | 52.7 | 50.9 | 4930 | 427 | 50 400 |
| Cages | 5370 | 57.1 | 58.6 | 5070 | 132 | 55 200 | |
| Common carp | Ponds | 9260 | 102 | 91.1 | 8210 | 265 | 97 400 |
| Cages | 9530 | 104 | 106 | 8260 | 242 | 101 000 | |
| Tilapia | Ponds | 8450 | 91.8 | 82.5 | 7430 | 369 | 88 300 |
| Cages | 7950 | 87.3 | 89.4 | 7100 | 207 | 83 000 | |
| Groupers | Cages | 14 300 | 66.6 | 341 | 437 | 33.6 | 160 000 |
| Others | 8518 | 76.7 | 107 | 9170 | 9255 | 88 525 |
3.2. Environmental impacts by 2030 after aquaculture interventions
The environmental impacts from the BAU scenario up to 2030, with the updated LCA impacts, resulted in between three- and four-fold increases in environmental impacts, proportionally higher than the 3.25-fold increase in fish volume (table 2). Improved feed efficiency for whiteleg shrimp, common carp and tilapia (AqI1) witnessed major reductions for most impact categories, apart from freshwater consumption. Freshwater consumption could, however, be reduced by intensifying milkfish and Asian tiger shrimp farming systems (AqI2). This shift towards pelleted feeds unfortunately also resulted in an increased demand for wild fish as a feed ingredient. Greater use of pelleted feed rather than low-cost fish (commonly small pelagic fish or bycatch) in grouper production (AqI3) would, however, more than counteract the demand for wild fish. Further reductions would be achieved by shifting shrimp production towards omnivorous species (AqI4), alongside reductions in freshwater consumption. However, a transition toward renewable electricity (AqI5) had only a modest effect on most impact categories, apart from fossil energy use. This is because the bulk of the global warming and acidifying emissions originated from agricultural fields for feed ingredients, and nitrous oxide and methane from ponds and manure management. Not surprisingly, the most efficient and probably cheapest way to reduce all environmental impacts from the seafood industry would be to reduce food waste and better utilize byproducts (AqI6).
Table 2. Mitigation potential of six aquaculture interventions (AqIs) by 2030, and their cumulative effect in total and per tonne of fish.
| Impact category | Business-as-usual | AqI1: 20% lower FCR for whiteleg shrimp, carp, and tilapia | AqI2: BMP milkfish & Asian tiger shrimp polyculture | AqI3: Grouper pellets, FCR 2 | AqI4: Shift to omnivorous species | AqI5: Renewable energy | AqI6: Reduce food waste | Aq1–6 Cumulative effect | AqI1–6: Per tonne fish |
|---|---|---|---|---|---|---|---|---|---|
| Fish quantity | 325% | 325% | 325% | 325% | 325% | 325% | 325% | 325% | 100% |
| Global warming | 339% | 317% | 350% | 341% | 327% | 339% | 267% | 222% | 68% |
| Acidification | 330% | 305% | 345% | 333% | 329% | 304% | 260% | 230% | 71% |
| Eutrophication | 345% | 317% | 347% | 335% | 329% | 341% | 272% | 227% | 70% |
| Land occupation | 359% | 342% | 316% | 360% | 348% | 360% | 283% | 234% | 72% |
| Freshwater use | 419% | 419% | 265% | 419% | 343% | 419% | 330% | 166% | 51% |
| Fossil energy use | 339% | 318% | 368% | 343% | 325% | 305% | 267% | 220% | 68% |
| Wild fish use | 355% | 327% | 334% | 304% | 312% | 355% | 279% | 184% | 57% |
4. Spatial planning for aquaculture growth
Shrimp farming, mainly practiced on Java, Sumatra and Sulawesi, has resulted in extensive ecological degradation due to the large areas needed and their competition with mangrove forests in coastal areas (figure 1). Extensive logging on Sumatra and Kalimantan has also had repercussions on air quality from fires, precipitation patterns, and freshwater quality (Marlier et al 2015, Wang-Erlandsson et al 2018). Consequently, land concessions lead to a negative feedback loop for the aquaculture industry itself, due to deteriorated ecosystems. Thus, apart from the large carbon emissions, the arguments for zero-tolerance toward further land concessions are overwhelming, and central to the success of the aquaculture industry. In the meantime, most of the systems evaluated have potential for intensification, but this needs to be carried out with minimal negative trade-offs, such as deforestation of the Amazon for soybean production (Henriksson et al 2018).
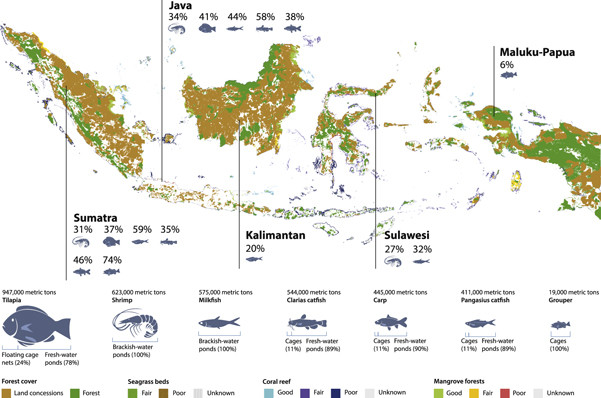
Figure 1. Ecological status of key habitat types and aquaculture production of individual species across Indonesia. Percentages of species by location refer to the percentage of national production for that species in the major aquaculture producing provinces. For example, 41% of the total national tilapia production comes from Java. The total national production is shown in the bottom portion of the graphic. For example, total national production of tilapia was 947 000 tonnes in 2016, 78% from freshwater ponds and 24% from floating cages. The condition of mangrove forests, coral, and seagrass beds were classified based on an assessment by BPS-Statistics Indonesia and Subdirectorate of Enviroment Statistics (2018). Land concessions are from all activities, not only aquaculture. Data from: UNEP-WCMC (2010), Giri et al (2011), Global Forest Watch (2014), and BPS-Statistics Indonesia and Subdirectorate of Enviroment Statistics (2018), UNEP-WCMC (2017).
Download figure:
Standard image High-resolution image
5. Discussion
Indonesia harbors some of the most important terrestrial and marine ecosystems worldwide. It is also a nation whose population is strongly reliant on seafood. The present research indicates that six interventions could reduce environmental impacts with between 28% and 49% per volume of fish. BAU growth would result in a 3.25-fold increase by 2030, while the Indonesian government aim for a 2.5-fold increase for most species using an additional 12 million hectares (IDH 2018). Both of these scenarios would consequently imply additional encroachments and degradation of ecosystems, even with the implementation of the AqIs. In addition, the present footprint might already be exceeding the carrying capacity in many parts of the country. Thus, the KKP/MMAF should reevaluate their production targets and take environmental assessments, like the present one, into consideration. They also need to shift their focus away from high value species such as shrimp and grouper, and instead acknowledge the importance of omnivorous finfish species that are consumed domestically. Environmental stewardship would also generate monetary returns through better fish yields and tourism, and hopefully soon through international compensation schemes for ecosystem services, such as carbon credits (Malik et al 2015, Rao et al 2015, Alongi et al 2016).
Feed was the major contributor to most impact categories. Domestic fishmeal and fish oil are especially controversial ingredients as they often compete with human food and most domestic fish stocks destined for reduction are already overexploited (Buchary et al 2011). Many promising substitutes have, in the meantime, entered the market over the last decade, including derivatives from agricultural products, macroalgae, microalgae, single cell proteins, and insects. Apart from their scalability, it will also be important to evaluate their respective footprints in order to avoid environmental trade-offs (Pelletier et al 2018). Feed used and species compositions also influence the nutritional profile of seafood. All these aspects need to be evaluated in more depth when setting national production goals and promoting specific farming systems.
Milkfish displayed the most variable production performance, which suggests that it has the largest yield gap and therefore the best prospects for improving. It is one of few omnivorous finfish species that can be farmed in brackish and marine environments. Thus, if production could be sustainably intensified, this species holds potential to utilize a wider set of feed resources than its carnivorous counterparts. Meanwhile, the traditional tambak system, where milkfish are extensively farmed alongside Asian tiger shrimp and often seaweed in brackish-water ponds, constituted the major competitor for valuable coastal areas due to large area requirements and low production volumes. Two of the largest milkfish producing provinces, Java and South Sulawesi, were also the provinces with the most degraded coastal and marine ecosystems. Thus, given that aquaculture is still a major driver for deforestation in Indonesia (Richards and Friess 2016), these farmers need to transition to more intensive farming systems. Intensification, however, goes hand in hand with an increased risk of disease and consequently needs to be supported by better spatial planning, rapid alert systems, veterinary support, and disease resistant strains.
Getting farmers, processors, and consumers to adopt better production and consumption practices and invest in favorable innovations remain the largest challenges. Ideally, savings gained by reducing feed inputs, improving edible yields, and/or reducing food waste would offset the costs of implementation, but initiating these types of changes has proved difficult in practice due to limited financial and farmer buy-in (Yi et al 2018). A cost/benefit analysis would therefore be useful to identify the largest gains per unit of investment. Resources would also be needed for disseminating information, establishing pilot projects, providing extension services, imposing and enforcing tighter regulations, and evaluating progress. These resources could be sourced nationally, by government institutions, or internationally, through foreign aid or nongovernmental organizations. Influencing consumer choices would be equally hard, especially since the Indonesian archipelago exhibits a large cultural heterogeneity. This calls for an adaptive strategy when evaluating and disseminating information. In summary, if the AqIs explored were implemented in combination with more novel technologies that have not yet been benchmarked or are only at small-scale production, including novel feed ingredients (e.g. Simon et al 2019, Couture et al 2019), we believe that aquaculture production could be doubled within its current environmental footprint in Indonesia. However, the challenges for successful implementation of individual interventions are many-including economic viability, political support, market demand, and ethical considerations.
Ecological heterogeneity also needs to be accounted for and enforced in zoning maps. While figure 1 provides a rough national outline, PT Hatfield has developed a more detailed map for the suitability of shrimp farms that also accounts for urban sprawl (https://aquaculture.ipb.ourecosystem.com/interface/). Complementing assessments should be carried out for freshwater lakes, as many of these already have exceeded carrying capacity (Fukushima et al 2017). Competition for resources with other sectors also needs to be further developed, as everyone has their own ambitious targets. The Indonesian Ministry of Agriculture, for example, intends to increase the production of charcoal by 15%, sugar cane by 20%, and palm oil by 12% by 2019 (Directorate General of Estate Crops 2014, Directorate of Energy and Mineral Resources 2014).
Beyond environmental considerations, species selection and production practices also influence food and nutrition security, economic growth, job opportunities, and equity (Béné et al 2016), variables that were not considered in the present study. This is because prices and labor are challenging to predict following the interventions identified. Undoubtedly, however, the proposed interventions and novel feed ingredients will influence the cost of production and ultimately consumer prices, either negatively or positively. This, in turn, will decide who can afford to consume the seafood produced, and who will gain financially.
Consequences of climate change were not considered in the modeling, but small-scale farms and low-latitude countries such as Indonesia are expected to be especially vulnerable (Barange et al 2018). For Indonesia, these consequences would include more frequent extreme weather events, rising sea levels, shifts in optimal temperature ranges, shifting precipitation patterns, and less availability of wild fish (Cheung et al 2016, Klinger et al 2017, Supari et al 2017, Barange et al 2018). Subsequently, the Indonesian aquaculture industry does not only need to reduce its emissions, it also needs to adopt to the effects of climate change.
Acknowledgments
In memoriam of Dr Nur Bambang Priyo Utomo who made this research possible.
We are grateful to the Walton Family Foundation for funding this research. This work was undertaken as part of the CGIAR Research Programs on Fish Agri-Food Systems (FISH) led by WorldFish and on Climate Change, Agriculture and Food Security (CCAFS). These programs are supported by contributors to the CGIAR Trust Fund. PJGH and MT are partially funded by FORMAS SeaWin project (2016-00227). We thank Martha Mamora for her assistance in the field and our colleagues at PT Hatfield.
Data availability statement
Any data that support the findings of this study are included within the article.