


Abstract
Attribution and disentanglement of the effects of global greenhouse gas and land-use changes on temperature extremes in urban areas is a complex and critical issue in the context of regional-to-local climate change mitigation and adaptation. Here, an innovative modelling framework based on a large ensemble of urban climate simulations, using SURFEX (a land-surface model) coupled to TEB (an urban canopy model), forced by E20C (a GCM-based reanalysis), is proposed, and applied to the capital of Portugal—Lisbon. This approach allowed to disentangle the main drivers of change of extreme temperatures in Lisbon, while also improving the simulated summer temperature variability compared to E20C, using station observations as reference. The improvements were physically linked to the strong sensitivity of summer mean and extreme temperatures to local land-use properties. The sensitivity was systematically investigated and robustly demonstrated here, with built-fraction (buildings + roads), albedo and emissivity emerging as key surface parameters. The results revealed a very strong summer temperature increase between 1951–1980 and 1981–2010 periods: 0.90 °C for daily maximum temperature (Tmax), and 0.76 °C for daily minimum temperature (Tmax). These changes were sensitive to considering different (but constant throughout the simulation) land-uses, varying by about 10% for Tmax, and around 17% for Tmin. Regarding the temperature extremes (quantified by extreme hot days, EHD, and extreme hot nights, EHN, respectively defined as exceeding the 95th-percentile of Tmax and Tmin) the changes and their dependencies with the land-use are much more drastic. The isolated effect of changing land-use (keeping the climate forcing unchanged) from rural/natural (low built-fraction) towards dense urbanization (high built-fraction) caused a significant increase in EHN (up to ∼+130 d per 30 years, larger than the effect due to climate forcing alone), and in EHD (∼+60 d per 30 years, which is similar to the effect due to climate forcing alone).
Export citation and abstract BibTeX RIS

Original content from this work may be used under the terms of the Creative Commons Attribution 3.0 licence. Any further distribution of this work must maintain attribution to the author(s) and the title of the work, journal citation and DOI.
1. Introduction
Extreme temperatures pose a serious threat to society (see [1] for a recent review). They are associated with significantly increased mortality rates, especially amongst the most vulnerable groups such as the elderly, the young children, the low-income populations, and those with pre-existing medical conditions. Extreme temperatures also raise the risk of wildfires, crop failures, infrastructures disruption and damage, and threaten natural ecosystems. It is now a well-established fact that greenhouse gases induced global warming and are responsible for increasing the frequency, intensity and duration of extreme temperature events over many regions of the world, as clearly evidenced in the International Panel for Climate Change Fifth Assessment Report (IPCC-AR5, [2]). Mora et al [3] estimated that around 30% of the world's population is currently exposed to extreme temperature events, with potentially lethal consequences for at least 20 d per year. Their projections suggest that by 2100 this percentage will increase up to 48% under a scenario where the rate of anthropogenic greenhouse gas emissions are decreased, and up to 74% under a scenario of growing emissions.
The impact of extreme temperatures on urban populations is particularly severe [4]. First and foremost, more than half of the global population resides in urban areas, a number that is expected to increase up to 60% by 2030 and 70% by 2050 [5]. Additionally, heat stress in cities is often enhanced as compared to nearby non-urbanized (rural) areas. Typically, urban areas are characterized by low vegetation coverage and extensive use of man-made materials such as concrete and asphalt. This leads to a decrease in the surface evaporative cooling and also in the surface albedo, resulting in increased sensible heating of near-surface air [6]. Simultaneously, urban human activities cause degraded air quality and increase energy consumption, the latter leading to additional heat release into the atmosphere. Furthermore, city geometry and increased surface drag tend to increase the near-surface air cooling time-scale. Consequently, urban environments are often characterized by increased surface heating compared to nearby non-urban areas, corresponding to the well-known urban heat island effect [6–8]. Additional, management stress is brought to urban environments because extreme temperature events lead to a large raise in electricity demand for cooling [1].
Given the severe impact of temperature extremes in urban environments, attribution is a critical task for designing and implementing effective mitigation and adaptation measures. In simple words, it is crucial to answer the question 'to what extent are human activities, from greenhouse gas emissions to land-use changes, causing the observed changes in the frequency, intensity and duration of extreme heat events?'. However, disentangling climate natural variability from global warming, induced by anthropogenic greenhouse emissions and from urban heat island effects, remains a challenging task [1]. The main cause for such difficulty comes from the complex variability of the climate system over a wide range of scales in both space (from the viscous dissipation scales of a few millimeters or shorter to planetary scale) and time (from fractions of a second to millions of years) [9, 10]. Furthermore, the different scales interact nonlinearly amongst each other, and different mechanisms govern the different scales [11–14].
Urban canopy numerical models are a useful tool for studying and predicting temperature extremes over urban regions. This has been demonstrated by several previous studies focusing on different cities across the world, under different global warming scenarios, urban density growth scenarios, urban vegetation fractions, and human energy consumption scenarios [15–19]. However, accurate simulation of local urban effects requires very high-resolution (on order of a few kilometers or less) [20, 21]. Such high-resolution is currently unattainable by Global Climate Models (GCMs), which are the cornerstone for most climate studies and projections, including the IPCC-AR5. Additionally, large ensembles of climate simulations obtained by Regional Climate Models (RCMs) are just starting to be used at such high-resolutions (∼3 km) for long climate projections [22, 23], but these simulations are still extremely demanding computationally, and the use of appropriate coupled urban canopy models is still non-standard (e.g. [24]).
As an alternative, we proposed the use of the Méteo-France SURFEX (Surface Externalisée) land-surface model coupled to the TEB (Town Energy Balance) urban canopy model [25] to simulate and disentangle the causes of urban extreme temperatures. The present investigation focused on summer extreme temperatures over Lisbon, that is the largest city in Portugal and home to about 600 000 people (nearly 3 million if the full metropolitan area). Lisbon is a particularly relevant case study for two main reasons. Firstly, previous studies have shown that it is very prone to summer extreme heat events, with large impacts in human health, mortality and energy consumption [26–28]. Secondly, Lisbon represents an urban environment in a Mediterranean climate, which is considered a climate change hotspot due to its vulnerability to the global warming impacts, namely the occurrence of heat related extreme events—droughts, heat waves and fires [29, 30]. The SURFEX-TEB framework allowed to generate a large set of 125 simulations covering the 1951–2010 period. Each simulation was characterized by a different land-use. We leveraged on this large simulation ensemble to disentangle the effects of (large-scale) greenhouse climate change from land-use changes on summer temperature extremes. The effect of high-frequency natural (internal) variability on the climate system (at time-scales below around 10 years [31]) was removed by taking differences between the 1981–2010 and 1951–1980 periods.
2. Data and methods
Daily maximum and minimum temperatures (respectively Tmax and Tmin) in Lisbon urban area were obtained from a weather station located at 38.781°N, 9.136°W, 114 m above sea level. This data was retrieved from the Global Summary of the Day, produced by the National Climatic Data Center, which includes quality control checks and random error removal.
We employed the SURFEX land-surface model, which is composed by various physical models for natural land-surface, lakes and oceans (see [25] for further details). Over urban surfaces, SURFEX includes the TEB urban canopy model [32]. The SURFEX-TEB framework has been used in several previous studies of urban heat island and urban temperature extremes (e.g. [16, 33–37]). Furthermore, the SURFEX-TEB framework is convenient because it has been coupled to widely used RCM and GCM models, and thus it may be employed for operational and research applications in weather and climate [24].
We generated 125 simulations using the SURFEX-TEB framework covering the full 1950–2010 period on a single pixel domain (with 0.02° × 0.02° spatial resolution) centered at the location of the Lisbon station. The analysis considered only summer months (June, July and August) between 1951 and 2010, allowing for ∼1.5 year of model spin-up. We used a 30 min model time-step with 3 hourly outputs. All simulations were forced by the same climate data, at 3 h resolution, taken from the European Centre for Medium Range Weather Forecast twentieth-century reanalysis (E20C) [38] in an offline setup. The rationale behind these offline simulations is to neglect the impact of the simulated high-resolution urban fluxes in the atmosphere above the urban canopy, while the local surface and near-surface response is simulated by the coupled SURFEX-TEB framework. The forcing data was obtained from the nearest grid-point in E20C to the Lisbon station, corresponding to a 1° × 1° area. The forcing surface pressure and radiative and precipitation fluxes were obtained from the E20C surface level. The temperature, specific humidity and wind forcing data were obtained from E20C model level at ∼68 m of height, which is above the urban canopy layer as required by TEB. Urban (Urb) simulation land-use was obtained directly from the ECOCLIMAP-II database [39], considering the nearest grid-point to the Lisbon station location (see table 1 for a simulation summary). Rural (Rur) simulation considered the most frequent non-urban land-use in ECOCLIMAP-II inside the 1° × 1° area of E20C pixel. The other 123 simulations correspond to random combinations of one or two land-use classes, based on 22 different urban classes included in ECOCLIMAP-II and the most frequent non-urban class around Lisbon.
Table 1. Summary of SURFEX-TEB simulations. Line 'All' refers to range of parameters over the full set of 125 simulations, which includes Urb, Rur and CTL. Built-fraction corresponds to the fraction of the pixel covered by buildings and roads. Garden-fraction corresponds to the fraction of pixel covered by urban vegetated areas.
| Name | Nature-fraction | Built-fraction | Garden-fraction | Surface Albedo | Surface emissivity |
|---|---|---|---|---|---|
| Urb | 0.00 | 0.90 | 0.10 | 0.10 | 0.90 |
| Rur | 1.00 | 0.00 | 0.00 | 0.16 | 0.96 |
| CTL | 0.00 | 0.78 | 0.22 | 0.10 | 0.93 |
| All | [0.00–1.00] | [0.00–0.90] | [0.00–0.52] | [0.10–0.17] | [0.90–0.97] |
The SURFEX-TEB simulation results were evaluated against the observations using two metrics: the mean bias and the Perkins skill-score (Sscore) [40]. The evaluation was carried over the 1981–2010 period in order to maximize observation data availability (with only 1 missing daily observation, which was filled by linear interpolation). Sscore measures the similarity between modeled and observed probability distribution functions (PDFs), with Sscore = 100% representing the case where the model reproduces the observed PDF perfectly:

where  and
and  are, respectively, the frequency of the modeled and observed Tmax (or Tmin) in bin
 is the number of bins used to compute the PDF (here
  corresponding to 1 °C bins between 0 °C and 46 °C). The best performing SURFEX-TEB simulation, denoted CTL, was defined by ranking the 125 SURFEX-TEB simulations by Bias and Sscore for both Tmax and Tmin and finding the one with the lowest average ranking (considering the same weight for all error measures). Point-by-point error metrics (such as root mean-squared error or Pearson correlation) were not considered because the forcing E20C reanalysis is only weakly constrained by observations, assimilating only surface pressure over land and marine winds [38], and thus a good day-to-day synchronization with the observations is not expected (see supplementary figure 1 is available online at stacks.iop.org/ERL/14/114023/mmedia).
There are many ways to quantify extreme temperatures (see [41] for a comprehensive review). Here, we use the number of summer extreme hot days (EHD), which was previously shown to have a close relationship to increased human mortality in Lisbon [27]. Following this previous study, we considered EHD index as the number of summer days where Tmax values are higher than its 95th-percentile. Using an analogous definition, we also quantified the number of summer extreme hot nights (EHN; T min ≥ 95th-percentile). The analysis of EHN was motivated by previous observational and modeling studies revealing that the urban effects on near-surface temperature depend on the time of the day, and that the urban heat island effect is particularly intense during the nighttime [42–44]. Notice that humidity was not taken in account, grounded by a previous study that found no significant impact of humidity on increased summer mortality in Lisbon [27].
3. Results
First, we evaluated the simulated Tmax and Tmin against observations over the summer months of the 1981–2010 period. Compared to the forcing E20C dataset, the best performing SURFEX-TEB simulation (CTL) reduced the mean bias magnitude from −2.25 °C to 0.12 °C for Tmax, and from −0.80 °C to 0.66 °C for Tmin. CTL also improved the overall PDF agreement for both Tmax (figure 1(a)) and Tmin (figure 1(b)), as quantified by an increase in Sscore from 73% in E20C to 86% for Tmax, and from 74% in E20C to 81% for Tmin. However, notice that the land-use characterization obtained from the nearest pixel in ECOCLIMAP-II to the Lisbon station location (i.e. Urb simulation) does not correspond to the lowest error values, and its improvement compared to the forcing E20C dataset was not systematic. It should be kept in mind that, E20C is a reanalysis which assimilates the Lisbon station pressure data and offshore surface wind rendering its improvement harder. Additionally, our results highlight the local character of Tmax and Tmin statistics in urban environments, with high sensitivity to the local surface characteristics, as illustrated by the large differences in both Tmax (figure 1(a)) and Tmin (figure 1(b)) between CTL, Urb and Rur. The high sensitivity of temperature variability to the underlying surface properties also emerged when the summer extreme temperatures were analyzed. Both Urb and CTL simulations overestimated the 95th-percentile of Tmax (figure 1(a)) and Tmin (figure 1(b)) compared to observations. Simulation Rur overestimated the 95th-percentile for Tmax, but underestimated for Tmin, while E20C underestimated both extreme indices. The overestimation of the 95th-percentile is a systematic property of all 125 SURFEX-TEB simulations for Tmax (figure 2(a)), and for Tmin in the cases with built-fraction >0.4 (figure 2(b)). Notice that built-fraction corresponds to the fraction of the pixel which is covered by buildings or roads, thus excluding the natural fraction and urban vegetated areas.
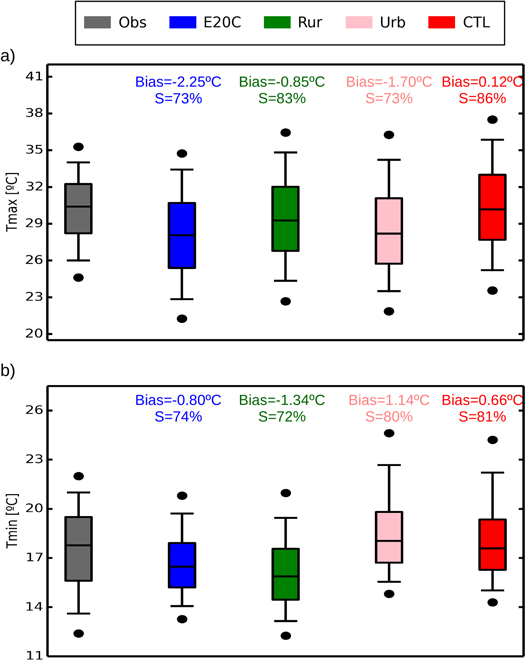
Figure 1. Boxplots of daily (a) Tmax, and (b) Tmin computed over the 1981–2010 period from station observations (gray), E20C (blue) and SURFEX-TEB simulations Rur (green), Urb (pink) and CTL (red). The boxplot whiskers represent the 10th- and 90th-percentile while the black dots represent the 5th- and 95th-percentiles. The mean bias and Sscore for each dataset are also presented.
Download figure:
Standard image High-resolution image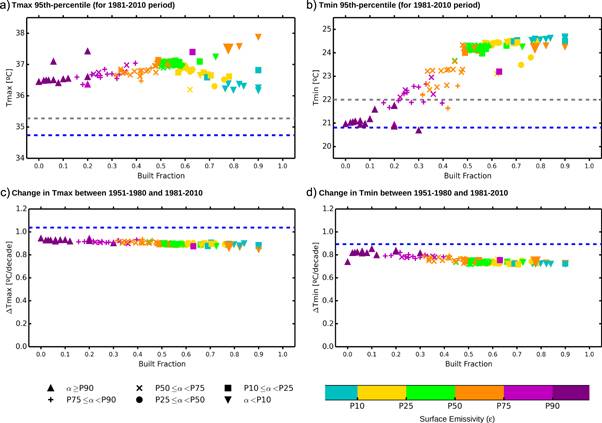
Figure 2. (a) Tmax 95th-percentile and (b) Tmin 95th-percentile, computed over the summer (JJA) months during 1981–2010 period. Change in average JJA (c) Tmax and (d) Tmin between 1951–1980 and 1981–2010 periods. The grey and blue dashed lines represent station observations and E20C, respectively. Each of the markers represents one of the 125 SURFEX-TEB simulations. The marker colors represent the respective surface emissivity percentile (within the set of SURFEX-TEB simulation), while the marker type represents the surface albedo percentile. The larger inverted orange triangle represents simulation CTL.
Download figure:
Standard image High-resolution imageDespite the systematic overestimation of the high temperature percentiles, one may take advantage of the large SURFEX-TEB set of simulations to disentangle the land-use change effects. This was achieved by comparing the different simulations over a fixed (1981–2010) period, noticing that each simulation was characterized by a different (but constant throughout the simulation) land-use. On average, the 95th-percentile of Tmax increased about 0.5 °C as the simulation built-fraction increased from zero to around 0.5 (figure 2(a)). This behavior is explained by the decrease in surface albedo as the built-fraction increases (figure 2(a)), resulting in higher surface warming (for a given solar forcing). Interestingly, as the built-fraction increased further above 0.5 towards 1.0, Tmax 95th-percentile increased for higher surface emissivity but decreased for lower surface emissivity (color-scale in figure 2(a)). The considered set of 125 simulations also highlights the large sensitivity of urban temperature extremes on small changes in surface albedo and surface emissivity. Indeed, figures 2(a) and (b) show, respectively, a relatively large range of values across the considered 125 simulations for both Tmax 95th-percentile (between around 36 °C and up to nearly 38 °C) and Tmin 95th-percentile (between around 20.7 °C and up to nearly 25 °C). In contrast, table 1 shows relatively small changes in surface albedo (between 0.10 and 0.17) and surface emissivity (between 0.90 and 0.97) across the considered 125 simulations.
The Tmin 95th-percentile increased sharply (by nearly 3.5 °C) as the built-fraction increased from zero to around 0.5 (figure 2(b)). This is because both the surface albedo and the surface emissivity decrease significantly as the built-fraction increases. In turn, this leads to larger surface thermal inertia and surface energy accumulation during the daytime, which is then released during the nighttime. As the built-fraction increased further beyond 0.5, the change in the 95th-percentile of Tmin was small. Figure 2(b) also shows slight, but noticeable, differences between the warmer cases with lower surface emissivity and colder cases with higher surface emissivity. Contrary to the daytime behavior, the (nighttime) Tmin 95th-percentile decreased for simulations with higher surface emissivity (compare figures 2(a) and (b)). The physical interpretation for this behavior is that simulations with lower surface emissivity have higher surface thermal inertia, with slower time-scales for the heat transfer between the land-surface and the near-surface atmosphere. This results in lower daytime Tmax extremes (figure 2(a)) and slightly higher nighttime Tmin extremes (figure 2(b)). Consequently, our results show that decreasing the built-fraction (and increasing the green-fraction) in an urban environment may either have no relevant effect on summer daytime temperature extremes (in agreements previous findings, e.g. [45, 46]); or it may have a slight cooling effect in cases where the urban environment has high surface emissivity values.
Subsequently, we computed the summer EHD and EHN for 1981–2010 for each SURFEX-TEB simulation, considering the CTL results over the same period as reference (to compute the 95th-percentiles). In simple words, we evaluated the impact on summer extreme temperature of changing land-use given a fixed climate forcing. It should not be forgotten than CTL was chosen as reference because corresponded to the best fit to the observed Lisbon summer temperature variability over the mentioned period. This means that we analyzed the summer temperature extremes under several different land-use possibilities, compared to one that best represents the city. Notice that, by definition, EHD and EHN are equal to 138 (5% of 30 years × 92 d) for the CTL simulation (large inverted orange triangle marker in figures 3(a) and (b)).

Figure 3. Change in summer EHD and EHN in the SURFEX-TEB simulations between 1951–1980 (markers) and 1981–2010 (black line with constant value of 138, as explained in section 3). The isolated effect of land-use changes (under constant climate forcing from 1981–2010) is represented in (a) for EHD and (b) for EHN. The isolated effect of climate forcing change (with constant land-use throughout the simulation, although different amongst simulations) is represented in (c) for EHD and (d) for EHN. The combined effect of climate forcing change and land-use change are represented in (e) for EHD and (f) for EHN. Each of the markers represents one of the 125 SURFEX-TEB simulations. The marker colors represent the respective surface emissivity percentile (within the set of SURFEX-TEB simulation), while the marker type represents the surface albedo percentile. The larger inverted orange triangle represents simulation CTL.
Download figure:
Standard image High-resolution image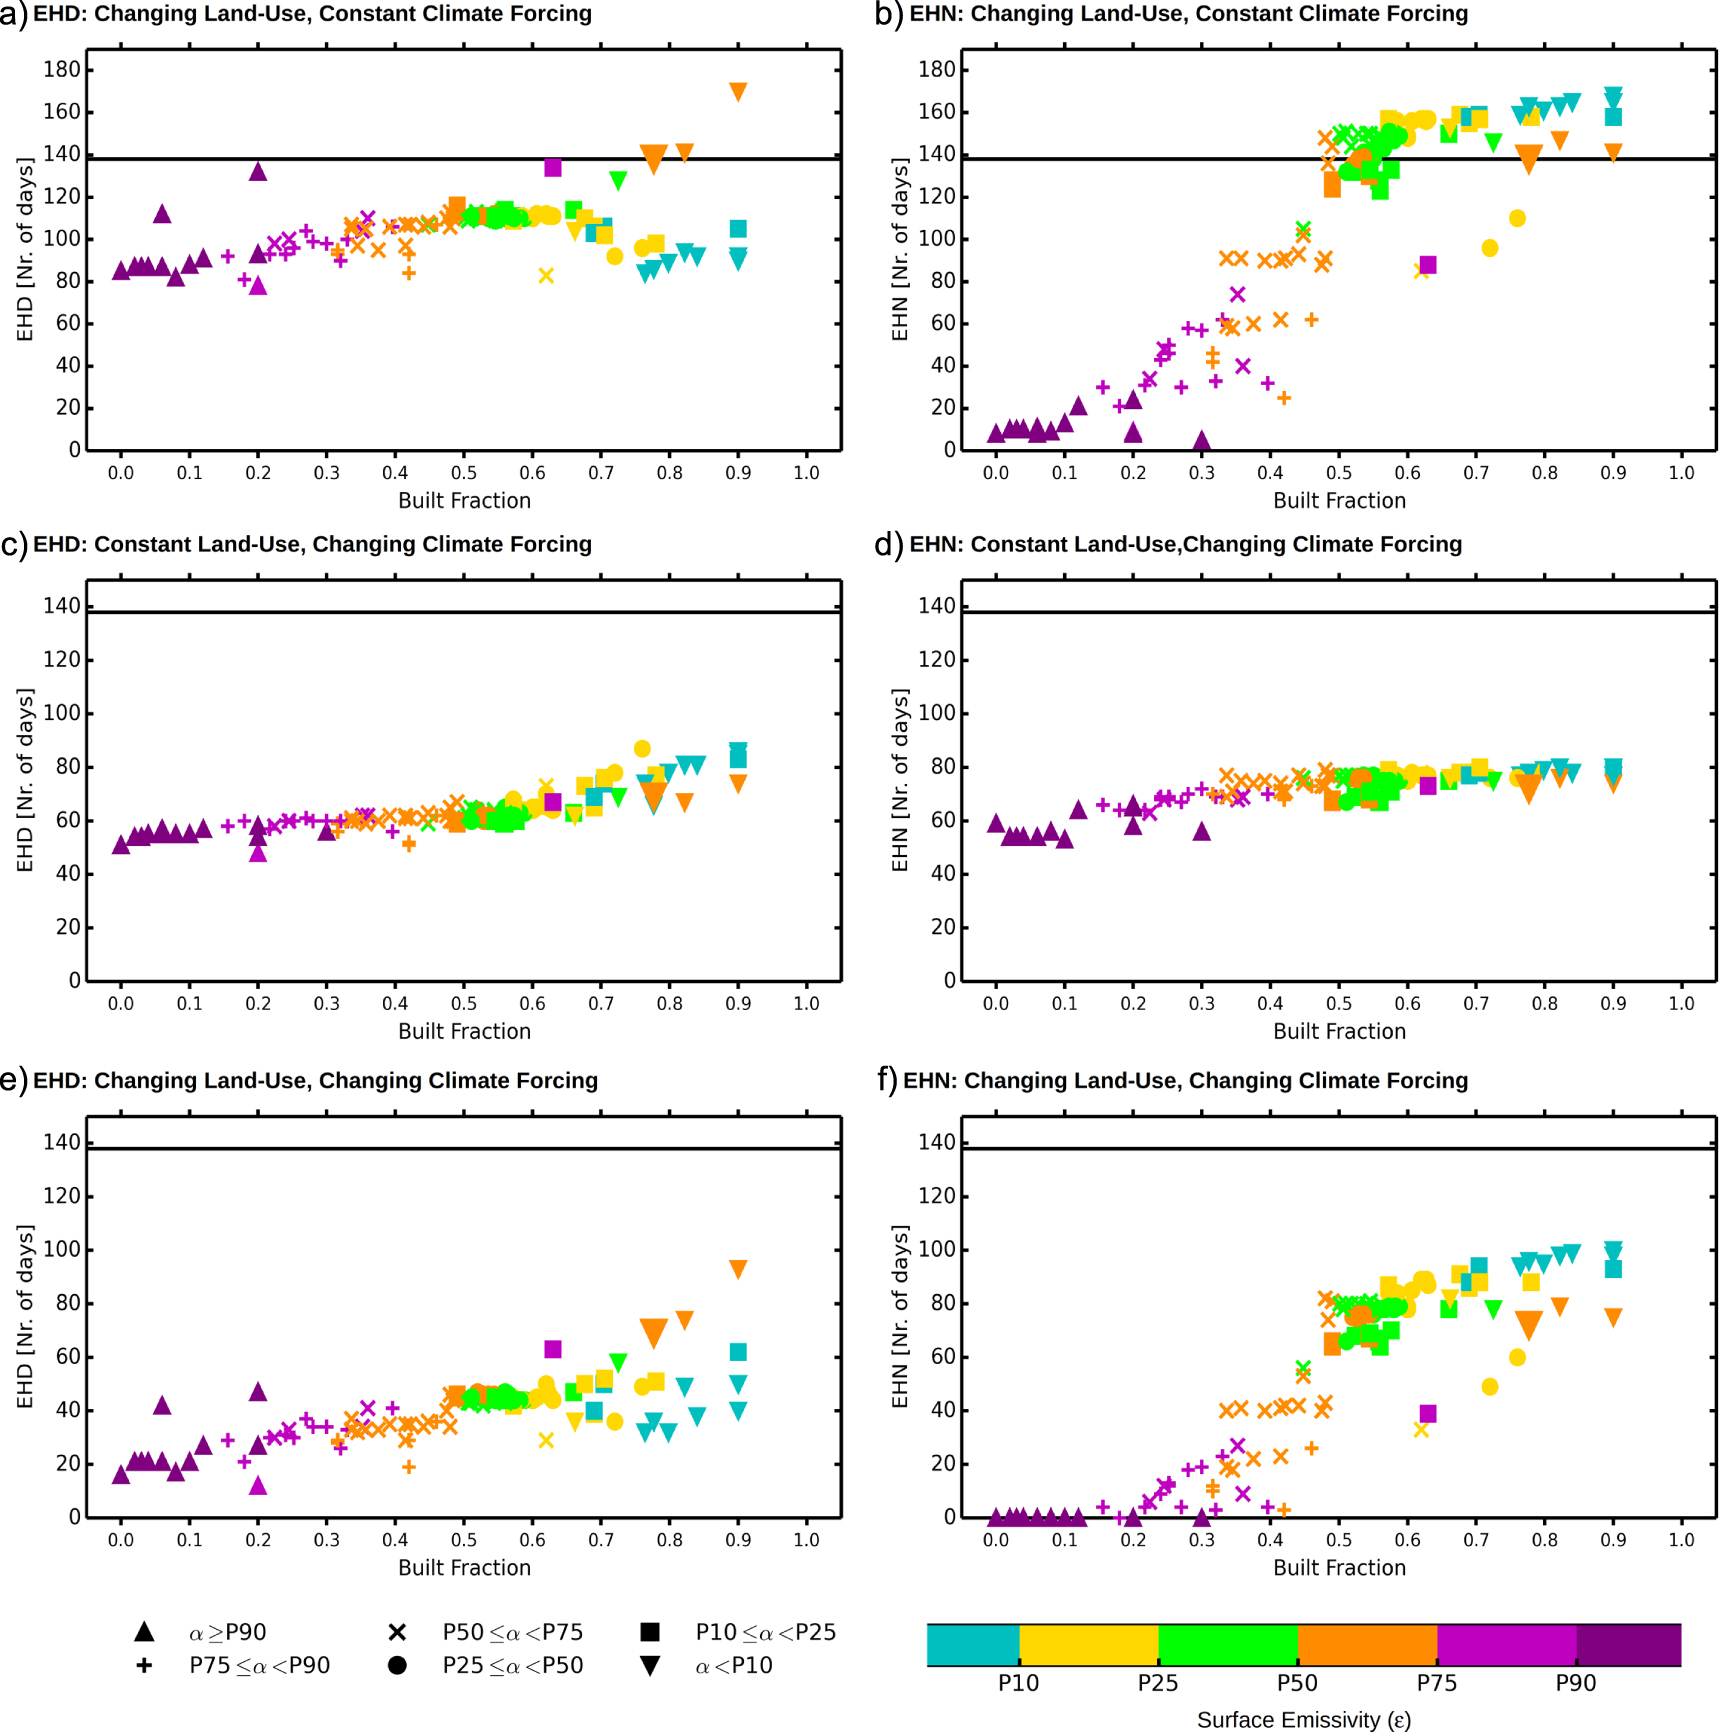
Overall, a land-use change from the reference CTL configuration resulted in EHD changes up to ∼60 d for a constant climate forcing. Interestingly, nearly all initial built-fraction values resulted in lower EHD values compared to CTL (figure 3(a)). The reason is that CTL was characterized by: low surface albedo, within the 10% lowest values of all simulations; relatively high surface emissivity, which was within the 50th to 75th percentiles of all simulations; and, more importantly, amongst the highest for simulations with built-fraction >0.5. In fact, most of the (few) exceptions which resulted in EHD close to or above 138 correspond to initially relatively high surface emissivity cases, combined mostly with built-fraction >0.6 (there is one case with very high emissivity and built-fraction around 0.2). For the same reason, CTL resulted in one of the highest values for the Tmax 95th-percentile amongst all simulations (figure 2(a)).
The impact of changing land-use while keeping the climate forcing constant in EHN is shown in figure 3(b). Increasing the built-fraction from zero to up to 0.5 increased EHN drastically, from around 10–140 d per 30 years. Further increases to the built-fraction beyond 0.5 resulted only in small changes to EHN, between 140 and 160 days per 30 years. Moreover, these latter changes depended mostly on reducing surface emissivity and not the built-fraction itself. In general, given a fixed climate forcing, a land-use change from the reference CTL caused EHN changes between +130 and −30 d per 30 years, with the magnitude largely dependent on the initial built-fraction.
In order to isolate the effect of greenhouse gas warming on the urban summer temperature, we analyzed the changes between 1951–1980 and 1981–2010 in each of the 125 SURFEX-TEB simulations. Each simulation corresponded to a different land-use which remains constant throughout the entire simulation period. Consequently, the warming of Tmax (figure 2(c)) and Tmin (figure 2(d)) in each simulation was driven by the (large-scale) climate forcing in E20C (which was the same for all simulations). The change in E20C was +1.04 °C for Tmax, and +0.89 °C for Tmin, both larger than the respective changes in all SURFEX-TEB simulations. Indeed, SURFEX-TEB modulated the magnitude of the changes depending also on local land-surface properties. The average change in Tmax between 1951–1980 and 1981–2010 in SURFEX-TEB simulations was 0.90 °C (with 0.02 °C standard deviation), being positive in all simulations (as expected under global warming) and displaying small, but noticeable, differences between different land-uses (∼10% difference between the 0.85 °C for 0.9 built-fraction and 0.94 °C for zero built-fraction). The average change in Tmin in SURFEX-TEB simulations, between 1951–1980 and 1981–2010, was 0.76 °C (with 0.03 °C standard deviation), also positive for all simulations, and with relatively small differences between different land-uses (around 17% difference between the 0.72 °C for 0.9 built-fraction and 0.85 °C for zero built-fraction).
The changes in extreme temperatures due to the greenhouse gas warming are illustrated in figures 3(c) and (d). The markers in figure 3(c) represent the EHD from each SURFEX-TEB simulation over the 1951–1980 period, using the Tmax 95th-percentile over the 1981–2010 period from the same simulation as reference (represented by the constant black line with value of 138). Thus, the change in EHD between the 1951–2010 period and the 1981–2010 is a measure of the change in daytime extreme temperature frequency due to large-scale climate forcing warming alone. As expected, EHD was significantly lower for the colder (1951–1980) climate compared to the warmer (1981–2010) climate. However, the total increase in EHD between the two periods depended significantly on the built-fraction. Indeed, for zero built-fraction (i.e. non-urban land-use) EHD increased by around 90 d per 30 years (from 50 to 138 d per 30 years), while for 0.9 built-fraction EHD increased by about 60 d per 30 years (from 80 to 138 d per 30 years). Similarly, EHN was significantly lower for the colder period (1951–1980) than for the warmer (1981–2010) climate (figure 3(d)). Again, the total increase in EHN between the two periods also depended on the built-fraction: for built-fraction 0.9, EHN increased by about 80 d per 30 years (from 60 to 138 d per 30 years), while for low built-fraction EHN increased by roughly 60 d per 30 years (from 80 to 138 d per 30 years).
Finally, we examined the combined effect of changing climate forcing and land-use on Lisbon summer extreme temperatures. This was pursued by computing EHD and EHN for the 1951–1980 period, while using 1981–2010 95th-percentile from CTL as reference for all simulations. The hypothesis was that all simulations evolved from their respective land-use in the 1951–1980 to the land-use of CTL in the 1981–2010 period. This implies that the value of EHD and EHN for 1981–2010 is 138 for all simulations. Figure 3(e) shows that the colder climate displayed significantly lower EHD values for all the land-uses. The EHD increased due to the combined effect of changes to climate forcing and land-use varies between around +120 d per 30 years (from 20 to 138 d per 30 years, for close-to-zero built-fraction), and around +80 d per 30 years (from 60 to 138 d per 30 years, for close-to-one built-fraction). Furthermore, under initial dense urbanization, the overall combined change is largely dependent on the surface emissivity, with increasing surface emissivity enhancing the EHD growth. The EHN increased due to the combined effect of changing climate forcing and land-use (figure 3(f)) is +138 d per 30 years (from 0 to 138 d per 30 years, for close-to-zero built-fraction), and around +40 d per 30 years (from around 100 to 138 d per 30 years, for close-to-one built-fraction), although there is a clear dependence on surface emissivity for low built-fractions.
4. Discussion and conclusions
The present investigation proposed that a large ensemble of simulations generated using the SURFEX-TEB model allowed to disentangle the main drivers of multi-decadal changes for summer extreme temperatures in urban environments. Additionally, this approach also improved the simulated summer temperature variability compared to E20C considering Lisbon station observations as reference. The improvement was physically grounded in the strong sensitivity of summer temperature variability to local urban effects and land-use properties, which were better represented in the high-resolution SURFEX-TEB simulations when compared with the coarse-resolution E20C. This sensitivity was systematically investigated, and urban built-fraction (fraction of surface covered by buildings or roads), surface albedo and surface emissivity emerged as key parameters, in agreement with previous findings [7, 15, 21].
The isolated effect of a warming climate forcing on daytime and nighttime summer temperatures over Lisbon was assessed holding the land-use constant throughout the simulations. Considering the average behavior over all 125 simulations, we found strong increases of Tmax (0.90 °C) and Tmin (0.76 °C) between the 1951–1980 and 1981–2010 periods. These represent alarmingly fast warming rates, well above the global average surface temperature change, which reveals nearly 100 years (since early 1900s to 2000s) to attain a similar magnitude of change [2]. The isolated effect of a warming climate forcing also caused increased EHD and EHN. The dense urban areas displayed lower magnitude average warming trends compared to rural/natural areas by around 10% for Tmax and 17% for Tmin. This is due to the higher thermal inertia (with lower surface emissivity) of the urbanized areas. Consequently, the increase in the number of EHD and EHN was larger for close-to-zero built-fractions (respectively, +90 d per 30 years and around +80 d per 30 years) than for high built-fractions (increases of around +60 d per 30 years for both EHD and EHN).
The isolated effect of changing land-use (keeping the climate forcing unchanged) from rural/natural towards the dense urbanized land-use that best characterized Lisbon (i.e. CTL simulation) caused a larger increase in EHN (up to +130 d per 30 years) when compared with the effect of climate forcing alone. This large increase in nighttime extremes for higher built-fraction is due to lower surface albedo and surface emissivity, linked to higher thermal inertia and accumulation of energy during daytime, which is then released during the nighttime. This increase in nighttime extremes was also found in previous studies, e.g. [45, 46] which focused in the city of Melbourne. However, these authors reported no significant impact of changing green-fraction on the daytime temperature extremes. In contrast, our results showed that, for the city of Lisbon, EHD increased by around +60 d per 30 years when the green-fraction was decreased. This is due to the relatively high surface emissivity associated to the simulation that best reproduced the Lisbon temperature observations. Indeed, keeping the built-fraction constant but changing the surface emissivity of the urban environment resulted in a similar EHD increase. Differently, the simulations with high built-fraction but low surface emissivity displayed EHD similar values to cases with low built-fraction.
The increase in EHN when changing the built-fraction between 0.5 and 1.0 was significantly lower than when the built-fraction varies between zero and 0.5. An analogous nonlinear response was previously described by [46], which is related to changes in surface roughness length and shading factor. We also found a weaker response of EHN to surface emissivity changes under dense urban land-cover (i.e. with fixed built-fraction between around 0.5 and 1.0) compared to EHD. The latter may be associated with similar causes, but further work on this topic is required to provide a robust answer. Additionally, the signal of the EHN response to surface emissivity changes is opposite to one of EHD, as expected. Higher surface emissivity causes decreased heat-transfer time-scale between surface and near-surface air, thus decreasing the surface energy storage, resulting in warmer near-surface air temperature during daytime and cooler during nighttime.
In summary, the present study robustly isolated and quantified the contributions of greenhouse climate warming and increased urbanization to the intensity and frequency of summer extreme temperature in Lisbon, both during daytime and nighttime. Moreover, we demonstrated that the contributions from climate forcing warming and land-use changes to EHD changes are similar in Lisbon. We further showed that increasing the green-fraction (decreasing the built-fraction) in an urban environment is not guaranteed to reduce the intensity of summer daytime extreme events, and surface emissivity must be taken into account. The increase in EHN is more sensitive to the rural-to-urban land-use changes, and less (but still) sensitive (with reversed sign) to changes in surface emissivity under dense urban environments.
In conclusion, we point out that the implications of the present investigation extend well beyond the Lisbon case. On the one hand, Lisbon represents an urban environment in a Mediterranean climate, which is considered a climate change hotspot due to its vulnerability to the global warming, namely the occurrence of heat related extremes. On the other hand, the presented approach based on a large simulation ensemble generated using the SURFEX-TEB framework forced by a (coarse-resolution) GCM product represents an effective methodology for improving the simulation, projection and attribution of temperature variability (and other variables) over urban environments at relatively low computational cost. This strategy may be employed to global and regional large simulation databases, e.g. CMIP (Coupled Model Intercomparison Project) and CORDEX (Coordinated Regional Climate Downscaling Experiment). Finally, high sensitivity of temperature extremes to local surface properties suggests for the need of very high-resolution simulations (∼1 km or less) capable of representing local urban processes. Such task will certainly require significant model development effort, but also high spatial resolution observational records, able to capture such high spatial and temporal variability, as recently argued in [47].
Acknowledgments
This study was funded by the Portuguese Science Foundation (FCT) under project LEADING (PTDC/CTA-MET/28914/2017), and also supported by project FCT UID/GEO/50019/2019‐Instituto Dom Luiz. Miguel Nogueira was also funded by FCT under project CONTROL (PTDC/CTA-MET/28946/2017). The data that support the findings of this study are available from the corresponding author upon reasonable request. The data are not publicly available for legal reasons.