

Abstract
Interdependent systems providing water and energy services are necessary for agriculture. Climate change and increased resource demands are expected to cause frequent and severe strains on these systems. Arizona is especially vulnerable to such strains due to its hot and arid climate. However, its climate enables year-round agricultural production, allowing Arizona to supply most of the country's winter lettuce and vegetables. In addition to Phoenix and Tucson, cities including El Paso, Las Vegas, Los Angeles, and San Diego rely on Arizona for several types of agricultural products such as animal feed and livestock, meaning that disruptions to Arizona's agriculture also disrupt food supply chains to at least six major cities. Arizona's predominately irrigated agriculture relies on water imported through an energy intensive process from water-stressed regions. Most irrigation in Arizona is electricity powered, so failures in energy or water systems can cascade to the food system, creating a food-energy-water (FEW) nexus of vulnerability. We construct a dynamic simulation model of the FEW nexus in Arizona to assess the potential impacts of increasing temperatures and disruptions to energy and water supplies on crop irrigation requirements, on-farm energy use, and yield. We use this model to identify critical points of intersection between energy, water, and agricultural systems and quantify expected increases in resource use and yield loss. Our model is based on threshold temperatures of crops, USDA and US Geological Survey data, Arizona crop budgets, and region-specific literature. We predict that temperature increase above the baseline could decrease yields by up to 12.2% per 1 °C for major Arizona crops and require increased irrigation of about 2.6% per 1 °C. Response to drought varies widely based on crop and phenophase, so we estimate irrigation interruption effects through scenario analysis. We provide an overview of potential adaptation measures farmers can take, and barriers to implementation.
Export citation and abstract BibTeX RIS
1. Introduction
Modern agricultural production is made possible by systems working together to deliver energy and water resources necessary to provide a reliable food supply. This interdependency creates the food-energy-water (FEW) nexus. The latter half of the 20th century saw a trend in land use dominated by exurban growth and the conversion and abandonment of agricultural lands (Brown et al 2005). Currently, some of the fastest growing regions are in the US desert Southwest, where agricultural, water, climate, and population growth come to a head (Gammage et al 2011). Arizona is a major agricultural producer, supplying considerable animal feed, livestock, milled grain products, meat, and other food products to cities throughout the US, as shown in figure 1.

Figure 1 Importance of agricultural exports from Arizona. This map displays the food related goods shipped from Arizona as a percentage of total food related goods shipped to each state in the freight category where that percentage is highest based on 2012 Freight Analysis Framework data (Center for Transportation Analysis 2016). Cities with 5% or more of a category imported from Arizona are labeled with an icon representing the freight category and labeled with the percent of that category they receive from Arizona out of their total imports of that category. For example, Los Angeles receives 22% of their 'Live Animals/Fish' imports from Arizona.
Download figure:
Standard image High-resolution imageIn particular the Phoenix region's large volume of food related exports means that reduced yields would have a significant impact on overall export capacity for Arizona. Figure 1 shows that the most significant food related exports are to cities surrounding Arizona including Los Angeles, San Diego, El Paso, and Las Vegas. Tucson receives 100% of its live animals and fish, 85% of its other agricultural products, 83% of its other foodstuffs, and 69% of its meat and seafood from within Arizona. Phoenix receives 87% of its other agricultural products, 73% of its animal feed, 57% of its cereal grains, 51% of its other foodstuffs, and 51% of its live animals and fish from within Arizona (Center for Transportation Analysis 2016). Therefore, disruptions to the agricultural system in the greater Phoenix area would have a substantial local impact, but would also be felt across the Southwest in California, Nevada, and Texas.
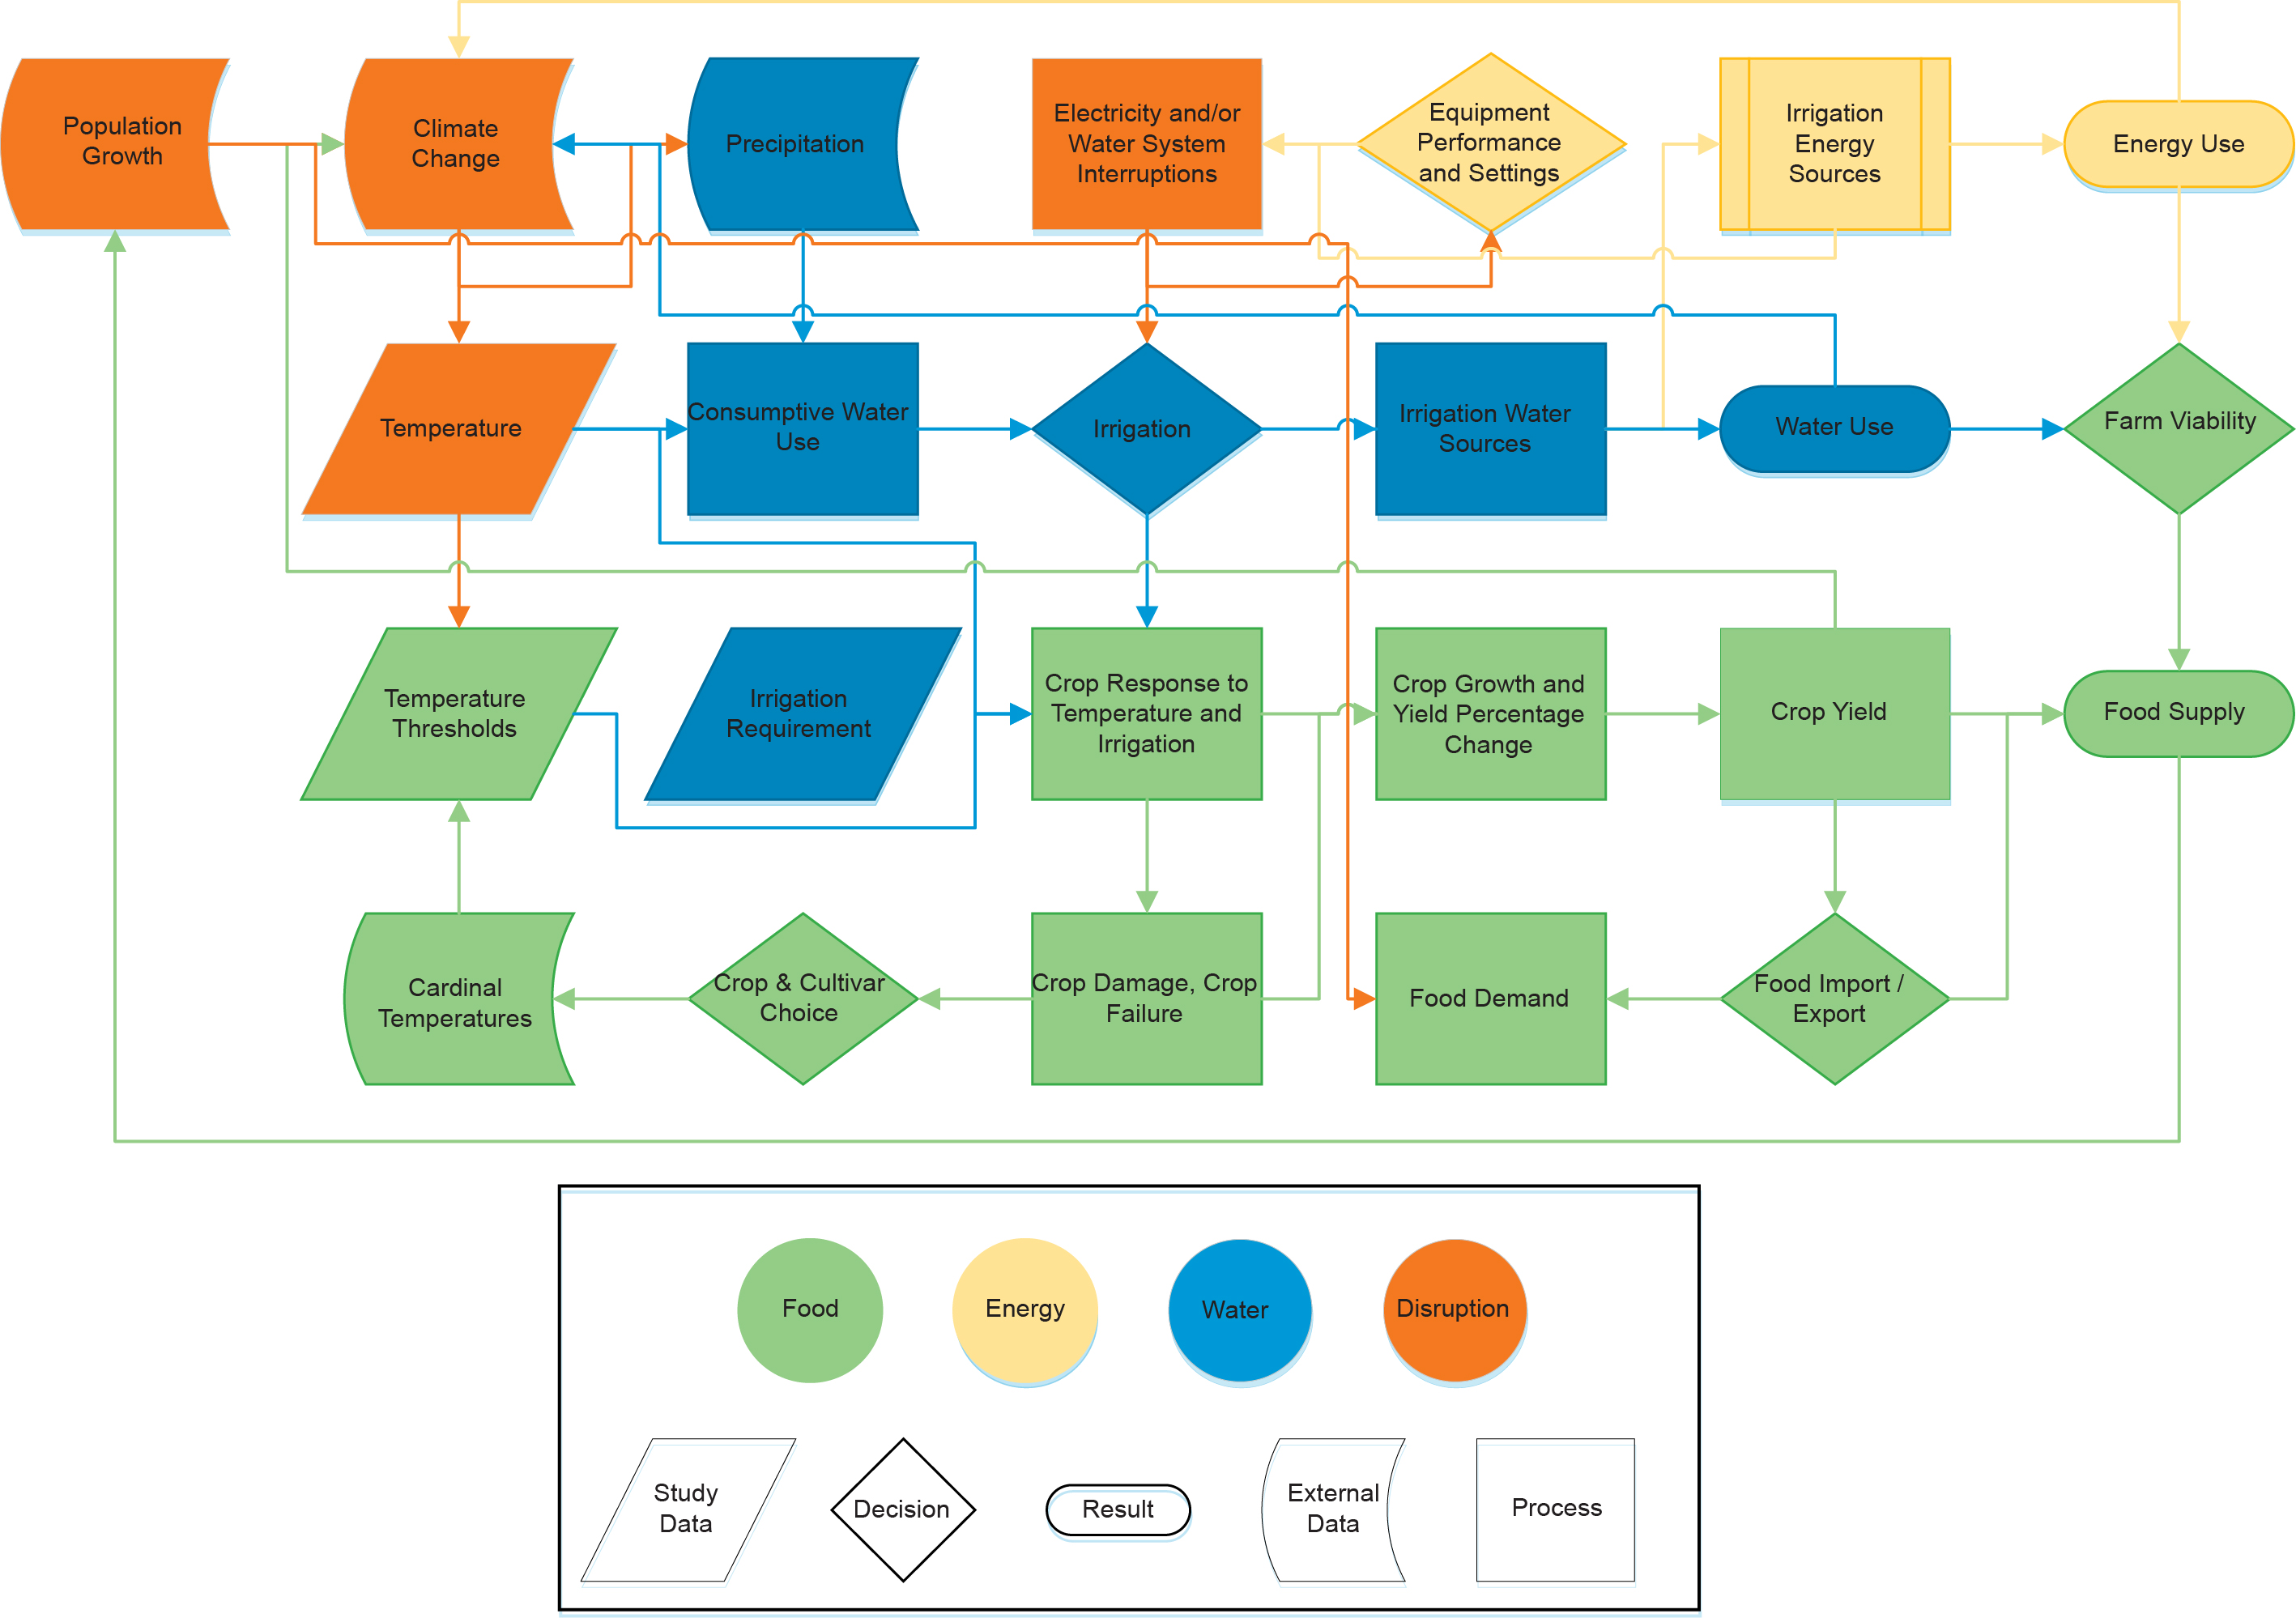
Disruptions to Arizona's agricultural production could be caused by failures in energy or water systems, or by the effects of temperature change on crop characteristics. Most crops in Arizona are grown using powered irrigation which requires reliable energy and water supply (Bartos and Chester 2014b). Irrigated agriculture is responsible for the majority of water withdrawals in Arizona, but the proportion used for residential purposes grew as farmland was transformed to subdivisions to accommodate a growing population (Gammage et al 2011). More frequent and intense climate-related events such as droughts and extreme heat may place additional strain on the FEW nexus. Shocks and strains on energy and water production and delivery systems may result in failures which cascade to food systems. In addition, feedback loops across the nexus could create compounding vulnerabilities, as failures in one system may propagate to another. The FEW nexus, including flows between systems and feedback loops, is shown in figure 2. Potential disruptions such as population growth, climate change, and interruptions to energy and water supply cause problems in food, energy, and water systems that combine and cascade to have downstream impacts on food supply and farm viability, which feed back into population growth in an iterative cycle.

Figure 2 FEW nexus diagram. Agriculture is connected to interdependent energy and water systems. Climate change creates a feedback loop by increasing temperature, necessitating more water and therefore energy use for crops, leading to further climate change. An abundant food supply also creates feedback by increasing population growth, which causes further climate change and higher food demand.
Download figure:
Standard image High-resolution imageRather than taking a holistic approach to analyzing the FEW nexus as represented in figure 2, existing literature tends to examine only one or two components. Papers address issues such as ensuring access to service, reducing environmental impacts, resolving tradeoffs between sectors (such as releasing water from a dam for irrigation or retaining it for hydropower generation and devoting agricultural land to producing biofuel or supplying food), and stabilizing prices (Bazilian et al 2011, Beck and Villarroel Walker 2013, Hellegers et al 2008, Hussey and Pittock 2012, Ringler et al 2013, Villarroel Walker et al 2014, Zhang 2013). It is more common to treat the nexus as an emerging and developing concept. Such papers identify one component (such as a river basin) as the most important and use it to provide a lens to view other systems (Beck and Villarroel Walker 2013, Giupponi and Gain 2016, Hellegers et al 2008, Yang et al 2016). When the nexus is considered as a whole, it is clear that trade-offs exist between sectors, and changes in one sector are likely to propagate through the entire system (Ringler et al 2013). Another common theme across literature regarding the FEW nexus is the need for assessment of the role climate change will play as a disruptive force and a threat to FEW security (Beck and Villarroel Walker 2013, Giupponi and Gain 2016, Godfray et al 2010, Ringler et al 2013, Yang et al 2016).
Climate change already has significant negative impacts on agriculture in the United States, causing substantial economic costs (Backlund et al 2008) and raising serious questions about the vulnerability of food supply chain. The Southwest is especially challenged due its rapidly increasing population, changing land use and land cover, limited water supplies, and long-term drought (Garfin et al 2013). Arizona is largely a semi-arid desert receiving only 20.4 cm of rain across only 36 d per year on average and with an average yearly temperature of 24 °C (US Climate Data 2016). Despite a resulting reliance on imported water and sprawling housing developments reducing available arable land, Arizona has a strong agricultural history and significant specialty crop production (Gammage et al 2011, Garfin et al 2013). The strain of irrigation required for agriculture is manifested in crop losses for Arizona farmers, as reflected in figure 3, showing key drivers of yield loss as water shortage, water costs, energy costs, and equipment failure. These problems affected about 15% of irrigated farmland in Arizona in 2013. Further strains on the FEW nexus could decrease Arizona's capacity to achieve agricultural production that satisfies domestic and export demands (Zumkehr and Campbell 2015).

Figure 3 Farms with diminished yields by cause. In 2013, Arizona farms reporting reduced yields attributed them primarily to water shortage and irrigation equipment failure, while the cost of water or energy shortage and price increases accounted for most of the remaining diminished yields (Vilsack and Reilly 2014). 2139 Arizona farms relied on irrigation for 100% of their total sales and 419 farms discontinued irrigation in 2013 (Vilsack and Reilly 2014).
Download figure:
Standard image High-resolution imageDespite the potential negative consequences, climate change vulnerability in the FEW nexus has not been rigorously characterized, as evidenced by a lack of robust metrics for measuring vulnerability and a lack of consensus on the exact meaning of vulnerability (Luers et al 2003). Vulnerability typically means the degree of susceptibility of a system to loss or harm due to exposure to stresses or perturbations caused by external changes combined with a lack of adaptive capacity to respond to or recover from such changes (Adger 2006, Luers et al 2003). In the context of the FEW nexus, this can be characterized as the potential for food, energy, or water systems to suffer damage preventing them from continuing their normal functions. These disruptions may have failures that cascade between systems and cause disruptions outside of geographical boundaries of the system being analyzed.
Due to the potential for disruption of the food system in the Southwestern United States, we seek to understand the potential impacts of climate change on agriculture within Arizona through four research objectives. The first objective is quantification of crop yield and irrigation requirements due to temperature increase and precipitation decrease. The second objective is assessment of crop vulnerability to drought, power failures, and irrigation interruptions. The third objective is evaluation of the potential for disturbances in connected infrastructure to cause a cascading failure through the FEW nexus that disrupts agriculture. The fourth research objective is to understand the potential consequences of these changes for food supply to the metropolitan areas Phoenix and Tucson, as well as to the rest of Arizona, and for food exported from Phoenix, Tucson, and the rest of Arizona to other urban centers.
2. Methodology
We evaluate the effects of increasing temperature on the FEW nexus in Arizona by assessing yield change and irrigation requirements, and analyze how connections to interdependent energy and water systems contribute to these impacts. Six crops account for over 92% of the acres planted in Arizona, including alfalfa (37%), barley (5%), corn (11%), cotton (24%), sorghum (4%), and wheat (12%), and altogether they account for about 5% of nationwide acreage for these crops (National Agricultural Statistics Service (NASS) 2015). These crops have data available for acres harvested, yield per acre, economic value, and consumptive use coefficients (Blaney and Criddle 1962, Erie et al 1982, National Agricultural Statistics Service (NASS) 2015). A range of potential yield responses to temperature is calculated based on estimates provided in the literature. These potential decreases in yield are used as a metric to quantify vulnerability to climate change in Arizona agriculture as percent yield change per degree Celsius, which is like the vulnerability metric used by Luers et al of tons per hectare lost per degree Celsius change (2003). Increased irrigation requirements are calculated based on the difference between consumptive water use predicted using the Blaney-Criddle equation and precipitation. We estimate irrigation energy use by water and fuel source using state level USDA data (Vilsack and Reilly 2014). We investigate the potential impacts of drought and irrigation interruption on crops. Finally, we assess the potential for disruptions in energy and water supply to propagate across the systems using a dynamic simulation model to analyze cascading failures that may exacerbate agriculture impacts from climate change.
Characterizing the FEW nexus for Arizona agriculture
Arizona has significant variations in rainfall, temperature, climate, soil, and geography across the state, which are reflected in the dominant type of agriculture for each county. Northern Arizona has fewer acres of cropland and a lower value of agricultural products when compared to central and southern Arizona (Vilsack and Clark 2014). We focus on the effects of climate change on the FEW nexus related to field and vegetable crops rather than livestock, so our analysis focuses on central and southern Arizona. These regions are also where most Arizona's population is located, in urban centers such as Phoenix and Tucson.
We characterize the FEW Nexus in Arizona agriculture as the relationships and interactions between agricultural production, energy supply, and water supply, all under strain from increasing temperatures and decreasing precipitation. This includes the potential for cascading effects such as increased temperature causing greater need for consumptive water use and therefore rising irrigation requirements, which in turn requires increased water pumping and irrigation application, and finally greater total energy use for irrigation.
As temperature rises, crop yields tend to slowly increase up to a certain threshold, then sharply decrease past that threshold (Schlenker and Roberts 2009). Cardinal temperature thresholds govern the relationship between temperature and crop viability or yield for specific crop types. Luo (2011) provides an overview of the ranges for optimum and lethal temperatures as well as failure points for many crops, differentiated across distinct phenophases. Cardinal temperatures are integrated into our model to predict if a crop will fail or suffer reduced yields as temperatures increase.
A key point of vulnerability for Arizona agriculture is irrigation. In 2012, about 75% of Arizona cropland was irrigated (Vilsack and Clark 2012). In contrast only 7.5% of cropland and pastureland in the United States was irrigated in 2007 (Beckman et al 2013). The Blaney-Criddle equation (Formula 1) is a well-known and extensively used method for estimating evapotranspiration based on ambient air temperature and percentage of daytime hours, which produces results similar to other temperature-based equations (Blaney and Criddle 1962, Xu and Singh 2001). We use Formula 1 to estimate baseline and predicted consumptive water use of crops in response to temperature.
In Formula 1, u is monthly consumptive water use per acre, k is an empirical consumptive water use crop coefficient different for each crop and each month, t is mean monthly temperature in degrees Fahrenheit, and p is the monthly percentage of daytime hours of the year. Baseline mean monthly temperatures are based on data for Phoenix, which is assumed to be representative for central and southern Arizona (US Climate Data 2016). The range of predicted temperatures is based on climate data from the National Center for Atmospheric Research downscaled for Phoenix, which provides four representative concentration pathways (RCPs) 2.6, 4.5, 6.0, and 8.5. There are projected changes in monthly average maximum temperature in the year 2060 of −2.3 °C to 6.8 °C for RCP 2.6, −3.7 °C to 6.6 °C for RCP 4.5, −1.7 °C to 6 °C for RCP 6.0 and −1 °C to 7.4 °C for RCP 8.5 compared to historical data for 2010, and a maximum temperature increase of 9.4 °C by 2090 (Brekke et al 2013, Maurer et al 2007). Therefore, we examine temperatures from 1 °C to 10 °C to account for the range of climate predictions. Seasonality is also important to consider, as there are typically temperature spikes in the summer, which could bring the temperature above the projected monthly average long enough to have a significant negative impact on crops despite a tolerable average temperature. Model validation for irrigation requirements is performed by checking against historical irrigation data for specific crops in Arizona. Details regarding the validation process are included in the supporting information, S1.6 (available at stacks.iop.org/ERL/12/035004/mmedia).
Irrigation and therefore associated energy use can be offset partially or completely by heavy monsoon season rains in the summer and precipitation in the winter when irrigation requirements are low. If monthly precipitation exceeds evapotranspiration requirements, the excess is assumed to be lost as runoff and is not applied towards the water requirements in the next month. Energy required for irrigation in Arizona is calculated from a survey of Arizona farmers which describes the water source and energy source for irrigation, including electricity, gasoline-ethanol blends, diesel/biodiesel, and natural gas (Vilsack and Reilly 2014). Energy use at the farm level aside from irrigation is assumed to remain the same because other farming activities based on area cultivated should remain the same for the foreseeable future. See Supporting Information S1.5 for more information.
Crop response to drought
There is significant variation in the severity of crop responses to drought that depends not only on duration without water but also temperature and timing of the drought during different crop phenophases. Water availability is more significant for crop growth than heat stress, and can partially compensate for increased heat (Bahar and Yildirim 2011, Lascano and Sojka 2007). Timing of droughts can result in far different impacts on yield of crops (Borrell et al 2000, Jamieson et al 1995). See Supporting Information S2 for specific crop reactions to water availability and drought timing. More frequent irrigation can help offset the yield reduction caused by insufficient water even if the total amount of irrigation is lower. An Arizona study showed that increased frequency can offset yield impacts of decreased total irrigation amounts. One trial received 45% of the water but 150% more irrigation periods than another, with identical impacts on yield (Lascano and Sojka 2007).
Alfalfa is a unique case as a perennial crop because impacts from one season can carry over to another. Its yield has a linear relationship with evapotranspiration over the season, but water shortage at one point during the season cannot be made up for by additional irrigation later in the season, which means that discontinuing irrigation during the summer permanently reduces alfalfa yield (Shewmaker et al 2011). A series of experiments in Tucson, Arizona showed that summer irrigation termination (SIT), a strategy to make alfalfa production more profitable by reducing costs, results in 2 to 3 fewer harvests and increases plant mortality by 25 to 35% when imposed for more than 2 months, although cultivar characteristics are more important in determining mortality than the length of the imposed SIT within a three month period (Wissuwa and Smith 1997).
Dynamic modeling to identify cascading failures
Having established the relationships between Arizona's agricultural, energy, and water systems, we develop a dynamic simulation using Vensim to assess how vulnerability in each system can propagate through the nexus. Vensim is a dynamic simulation platform developed by Argonne National Laboratory that allows for the definition of relationships between sub-processes in larger systems and recursive analysis to reveal emergent behaviors of complex systems. Governing relationships between sub-processes are defined through Arizona-specific data gathered from the USDA and the USGS, and by the Blaney-Criddle equation (Blaney and Criddle 1962, US Geological Survey 2005, Vilsack and Reilly 2014). We identify key points of interaction at which failures in components of energy and water systems can cascade to affect components of agricultural systems. Our model accounts for expected temperature change, irrigation pumping performance and pressure, potential impacts from drought or excessive heat, precipitation, crop choice, and the proportions of irrigation supplied by ground water or surface water. It also includes the interactions between these components and their effects on demand for water and energy, including electricity and fuels. Crop-specific cardinal temperatures are coupled with literature documenting observed effects of temperature change on crops, specific to Arizona when available, to predict the expected impacts of rising temperatures on crop yields and irrigation requirements. Expected energy use is roughly proportional to irrigation requirements despite consideration of other on-farm energy use. Impacts from irrigation interruptions are based on response to exceedance of certain thresholds for duration without water defined in the literature and vary based on crop type and timing.
3. Results
Yields of agricultural commodities in the study area are predicted to fall by between 1% and 12.2% per 1 °C increase, depending upon the crop examined. Alfalfa may experience an increase in yield of up to 16% or a decrease in yield up to 12% in response to temperature changes below 3 °C coupled with increases or decreases in irrigation, demonstrating its greater sensitivity to irrigation than temperature (Hatfield et al 2008). Barley has the greatest range of uncertainty based on timing of heat stress, with the greatest loss of yield during stem elongation and the lowest loss of yield between heading and anthesis (Ugarte et al 2007). A linear regression analysis of crop responses to various temperature changes shows potential for barley to have a slightly increased yield with a 1 °C increase. Details regarding this regression are included in the Supporting Information. Crops besides alfalfa and barley suffer yield losses immediately as temperature increases. Irrigation requirements are expected to increase by about 2.6% per 1 °C increase, averaged across crops, though barley will require the greatest increase and sorghum will require the lowest increase. Ground water supplies just over a quarter of current irrigation demand, with surface water supplying the rest. Arizona's scarce ground water supplies and strict regulations mean that surface water is likely to supply most if not all the available water to meet increased irrigation demands. Irrigation energy use should rise in proportion to irrigation requirements, with about 81% of additional energy use coming from electricity. In 2008, it was estimated that 330 GWh of energy was used for irrigation, not counting surface irrigation (Bartos and Chester 2014a). Therefore, we expect an additional 8.58 GWh of energy use for irrigation per 1 °C increase in temperature, 6.95 GWh of which is likely to be met with electricity based on current proportions. This amount of electricity generation would cause approximately 4884 metric tons of greenhouse gas emissions, which is the equivalent of just over 1000 passenger vehicles driven for a year (US Environmental Protection Agency 2015).
Yield response to temperature increase
The difference in crop yield because of predicted temperature increase can be positive or negative depending upon the baseline temperature, although the baseline temperature for Arizona is relatively high. Corn and cotton have slight yield increases as temperature rises up to 29 and 32 °C respectively, then much steeper rates of yield decrease afterwards (Schlenker and Roberts 2009). This nonlinear response to temperature is governed by control enzymes which enhance or restrict development of different characteristics such as kernel growth or leaf photosynthesis at different thresholds including the minimum, optimum, and maximum, or cardinal temperatures (Luo 2011, Sharpe and DeMichele 1977). Many studies of temperature effects on crop yield only consider one or two temperature changes, or use baseline temperatures lower than what is typical for Arizona so data are limited (Hatfield et al 2008, Kucharik and Serbin 2008, Lobell and Field 2007, Schlenker and Roberts 2009, Ugarte et al 2007, Wheeler et al 2000). In central Arizona, cotton blossoms reach their first peak in July, when the average high temperature is just over 41 °C and corn is ready to harvest in June, when the average high temperature is 40 °C (Erie et al 1982, US Climate Data 2016). Therefore, increased temperatures in the summer growing season are likely to cause steep linear decreases in yield. Figure 4 shows the potential changes in yield associated with a range of temperature increases from 1 °C to 10 °C above current Phoenix average highs.
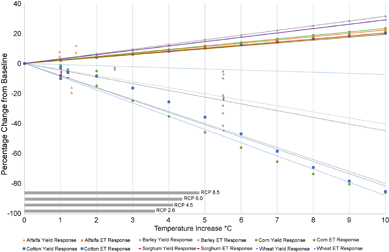
Figure 4 Yield change and consumptive water use estimates for major Arizona crops in response to temperature increase. Yield estimates are indicated by linear regressions based on available relevant data for yield response to temperature. Water use is calculated with the Blaney-Criddle equation and crop growing seasons (Blaney and Criddle 1962, Erie et al 1982). Uncertainty is represented by data points showing the range of observed responses to temperature in the sources utilized. The overall effect of temperature increase is a linear decrease in crop yield and increase in consumptive water use. RCP scenarios are overlaid as gray bars over the x-axis for the range of expected temperature increase by 2060 from zero to the 90th percentile. Not shown here are some negative projections which are due to the potential for temperature to decrease under certain scenarios.
Download figure:
Standard image High-resolution imageFigure 4 also shows the expected change in consumptive water use due to increased temperatures. Increased water availability partially mitigates yield decline past a threshold temperature, but interactions between temperature and water are not significantly correlated with yield and the effects of both on outcomes can be treated independently (Schlenker and Roberts 2009). Therefore, in the scenario that temperature increases are coupled with irrigation interruptions or shortages, the impacts will be even greater than when only one stressor is imposed.
Irrigation requirements and associated energy usage
Our model calculates required irrigation based on evapotranspiration, the theoretical minimum to ensure successful crops, and energy requirements are expected to rise in proportion to increased water demand. Table 1 provides information regarding irrigation types and their energy use in Arizona.
Table 1. Irrigation Types, Percent of Arizona Total, and Their Energy Use. Data from USGS 2005 and Bartos and Chester (2014b).
| Irrigation Type | Percent of Total Irrigation | Energy Use (kWh) per 1000 m3 Water | Application Efficiency | Water Required to Apply 1000 m3 to Field | Energy to Apply 1000 m3 to Field | Embedded Energy in Water Applied (kWh) | Total Energy to Apply 1000 m3 in kWh |
|---|---|---|---|---|---|---|---|
| Surface/Flood | 75% | 0 or 11 |
65% | 1538 m3 | 0 or 16.8 | 754 | 754 or 770.8 |
| Sprinklers | 22% | 230 | 75% | 1333 m3 | 307 | 653 | 960 |
| Drip/Microirrigation | 2% | 170 | 95% | 1052 m3 | 179 | 516 | 695 |
a Bartos and Chester (2014b) provide a zero value for surface/flood irrigation energy use, but cite California Agricultural Water Electrical Energy Requirements, which note that while gravity-fed systems use no energy, surface irrigation booster pumping averages 11 KWh per 1000 m3 where necessary.
Surface irrigation is the most common type, but has low application efficiency, which results in higher energy use due to embedded energy for water delivery (Bartos and Chester 2014b). Sprinklers, despite having higher application efficiency than surface irrigation, have the highest energy use of the three irrigation types due to the need to power jets of water. Drip irrigation is the least common, but has very high application efficiency and low energy use, making it an ideal technology for adaptation. As shown in figure 5, surface water accounts for most of Arizona's irrigation requirements, with some remaining need met by ground water from wells. In both cases, electricity is the dominant energy source. Surface water also makes substantial use of diesel and biodiesel.

Figure 5 Irrigation energy sources by water source. The inner ring represents 100% of the irrigation water used, split between ground water and surface water. The outer ring shows, for each water source, the proportion of each type of energy used to pump irrigation water. Most irrigation in Arizona uses surface water, and the majority of irrigation pumping uses electricity (Vilsack and Reilly 2014).
Download figure:
Standard image High-resolution image4. Systematic interdependencies
Dynamic modeling reveals the emergent properties of the FEW nexus that occur due to complex interdependencies between system components. The behavior of the Arizona FEW nexus components under study is graphically represented and updates instantaneously in our model to provide scenarios for further analysis. Our model, represented by figure 6, reveals the connections between processes that are several steps removed from one another and dependent upon other system components in a way that static models cannot.

Figure 6 Dynamic simulation model. Our model has parameter inputs such as crop choice, irrigation equipment settings, and temperature change (indicated by dashed line). Outputs including yield, consumptive water use, and total energy use (indicated by dotted line) are calculated based on intermediate variables such as total electricity use for pumping surface water or expected yield change from irrigation interruption. Where appropriate, our model includes graphs overlaid on variables that show the change in parameters over time, which is instantaneously updated in Vensim when any inputs are changed.
Download figure:
Standard image High-resolution imageOur model, represented by figure 6, allows for simultaneous experimentation with multiple variables and assumptions coupled with graphical representation not only of connections between variables, including feedback loops, but also quantities calculated for those variables. This captures the dynamic relationships that exist across components of the FEW nexus in Arizona. For instance, our model reveals which crops exceed the failure temperature threshold in which months based on the temperature change input by dragging a slider and observing changes in the results. The effect of temperature on irrigation and energy use as well as yield is presented in figure 7, which was created using results from our Vensim model.

Figure 7 Irrigation and energy use by crop. For each crop considered, three charts are shown representing irrigation requirements in inches per acre, energy use in GJ per acre, and percent yield change expected for temperature increases up to 10 °C. For the surface plots, time is shown on the z-axis.
Download figure:
Standard image High-resolution image
Figure 7 captures a snapshot of the capabilities of our Vensim model by examining irrigation, energy use, and yield change over the course of a year across ten temperature increase scenarios, holding all other parameters constant. These results would change in response to variation of other model parameters, such as irrigation pumping pressure and performance or reductions and interruptions to irrigation. One unexpected finding was that an increase in temperature can result in a decrease in irrigation. It is assumed that irrigation stops during months when temperature exceeds the failure threshold of the crop, resulting in a scenario where there is a decrease in irrigation due to a high temperature causing crop failure. Also, despite including sources of energy use besides irrigation, the overall pattern of energy use is heavily influenced by irrigation and is therefore subject to the same changes due to temperature increase across different months.
Cascading component relationships
Certain factors, such as temperature, have impacts across the system both directly on other components and also indirectly through the impacts caused by the components they affect. For example, temperature influences crop yield and evapotranspiration, but also energy use as a result of increased irrigation requirements or possibly changes in pumping pressure due to increased energy costs. In addition, energy use results in greenhouse gas emissions, which contribute to climate change that drives temperature increases. Relationships between components can be dynamic as well. For example, irrigation requirements should only increase with temperature up to the failure point of a crop, at which point irrigation falls to zero because the crop failed. Alternatively, the farmer could anticipate this failure and change the crop type or planting date, impacting the entire farming operation.
Decision making variables
We incorporated several decision making aspects into our Vensim model, including choice of pumping pressure, maintenance of irrigation equipment, crop choice, cropping system where relevant, the decision to stop irrigation, and the timing of irrigation interruptions. These organizational and institutional decisions are incorporated into the model to show the importance of decisions on upstream and downstream factors and they reveal the tradeoffs between choices that benefit the farmer in the short term and long term. For example, a farmer considering SIT for an alfalfa crop to save money by reducing irrigation energy expenses might instead reduce their pumping pressure. The farmer would reduce energy used, but increase irrigation water utilized. Overall, this would have a positive effect on yield without increasing energy use as much as maintaining typical irrigation practices. The farmer might also anticipate this problem for the next season and invest in a more efficient irrigation technology or repairs to improve their pump performance, both of which would save energy and water.
5. Discussion
Change in irrigation requirements, crop yields, and energy use as well as response to drought mean that the FEW nexus in Arizona agriculture is sensitive to temperature change. Unfortunately, temperature increase results in negative effects across the agricultural system, so strain and failures compound problems and make farming less viable. Impacts from climate change may be especially difficult for farmers with low profit margins and crops that use the most water, like alfalfa and cotton. Interruptions to energy and water systems resulting in irrigation termination have direct impacts on the yield of some crops over a short term period, but must be of an extended duration on the scale of months to threaten crop viability. Arizona crops are already grown outside their ideal growing temperatures, and increased heat would bring them closer to a lethal failure point, reducing yield along the way. Electricity and water delivery infrastructure, already stressed by high loads and heat, face additional demands to supply irrigation for agriculture, which increases the likelihood of interruption and in turn raise subsequent demand.
Failures in the Arizona FEW nexus could cause disruptions throughout the Southwest as food supply chains for urban centers like El Paso, Los Angeles, and San Diego shift. There is also the potential for cascading impacts because these cities have their own exports which might be disrupted. As cities throughout the Southwest look to meet their own local demands, there may be a significant change in food supply across the region. Regardless of potential systematic failures and reductions in crop yields, it is very likely that consumptive water use will increase as average temperature increases. Sustainable food supplies in Phoenix and Tucson, as well as other agriculturally productive regions of the Southwest, will require a greater amount of water drawn from sources that are already strained. It is unlikely that Arizona will be the only state with agriculture that suffers from the predicted impacts of climate change, especially given the threat of long-term and severe drought in the Southwest considered likely under the RCP 4.5 and RCP 8.5 scenarios (Cook et al 2015). Challenges facing other regions reliant on the Colorado River Basin, including southern California, would compound any disruptions to Arizona's agriculture, especially if prolonged drought required a large-scale shift from agriculture to urban water usage (MacDonald 2007). In addition to causing increased prices, this would significantly reduce the availability of domestically produced food, both of which negatively impact regional food security. Several cities in the Southwest rely on Arizona for a substantial proportion of their animal feed or livestock, so reduced capacity to meet export demands would also have negative impacts on ranching operations.
The effects of temperature increase could be negative across the entire agricultural system, except for a minor increase in yield for alfalfa and barley followed by decreasing yield at higher temperatures. The primary way in which failures can cascade to agriculture within the FEW nexus is through either water shortage or blackouts preventing irrigation equipment from operating. Understanding the limitations of Arizona agriculture and planning crop choice, planting dates, and irrigation timing are ways that farmers can cope with climate change without significant additional investment. However, if water scarcity becomes an even more significant issue, the damage from temperature increases may be more severe and a large portion of Arizona agriculture may no longer be viable. Agricultural water use can be curtailed to preserve water for metropolitan residents and may be interrupted for this purpose (Gammage et al 2011). We identified scenarios where failures may cascade across the FEW nexus, including the following:
- With increasing temperatures, the rate of evaporation along Arizona's canals and other conveyance infrastructure for water might increase. This decreases the water available for use in the state, potentially interrupting the water supply to agriculture to provide for residential use. About 77% of Arizona cropland relies on irrigation, so complete diversion to urban or residential areas or to serve other needs would cripple Arizona agriculture (Vilsack and Reilly 2014).
- Components of energy and water infrastructure are more prone to failure due to higher temperatures (Bartos and Chester 2015; Burillo et al 2016), increasing the potential for service interruptions that may have adverse effects on crops. Farmers may respond by accepting increased risk, shifting to crops that don't require irrigation, or discontinuing their farming activities.
Identification of potential hazards enables planning to increase adaptive capacity of a system. Adaptive capacity is the ability of a system to reduce vulnerability through accommodating perturbations or strengthening its ability to cope with shocks (Adger 2006, Luers et al 2003). There are numerous potential adaptation measures available to reduce both energy and water use in Arizona agriculture. Only about 5% of Arizona farmers use a soil or plant moisture sensing device to determine when to irrigate, and about 15% use a scheduling service or daily evapotranspiration reports, leaving a large number of farmers that rely on reacting to the condition of the crop or the feel of the soil (Vilsack and Reilly 2014). Irrigation scheduling based on monitoring soil water and estimating crop water use rates can save 1.5 to 2.0 inches of water (Martin et al 2011). Increasing reclaimed water use from its current 1% could reduce overall consumptive water use. 471 Arizona farms use drip, trickle, or low-flow micro sprinklers, while 1640 farms use traditional sprinkler systems and 3005 use gravity systems (Vilsack and Reilly 2014). There is significant room for improvement in water efficiency through increased use of drip irrigation instead of sprinkler or flood. Drip irrigation may improve yield as well, considering that in 2013 corn farming using flood systems for irrigation resulted in 4.8 acre-feet applied per acre and a yield of 158 bushels per acre while a pressure system only used 2.9 acre-feet per acre and yielded 216 bushels per acre (Vilsack and Reilly 2014). Only about half of Arizona farms with flood irrigation systems engaged in any water conservation technique (Vilsack and Reilly 2014). Prioritizing early season irrigation when water requirements are typically lower can help mitigate potential impacts of subsequent water shortages (Erie et al 1982). Timing of irrigation applications across a season can also help stretch scarce water for greater effect. Certain cultivars that are better adapted to low water and high heat may help offset the expected effects of rising temperatures, but this would require farmers to invest in a new crop they might not be familiar with and which could have characteristics less desirable from a consumer standpoint.
Farmers cite many barriers to making efficiency improvements, including conservation investments not being a priority, believing there is a risk of reduced yield or poor crop quality, physical field/crop conditions that limit improvements, lack of savings to cover installation costs, inability to finance improvements, and uncertainty about future availability of water (Vilsack and Reilly 2014). Some adaptations provide significant benefits in one or more areas, but cause disadvantages in others and the consequences, both positive and negative, must be weighed to determine the best course of action. For example, lowering the operating pressure of an irrigation system reduces energy use, but increases the water application rate, increasing the potential for runoff and water waste (Martin et al 2011). In this case, the ideal would be to minimize pressure up to a threshold past which runoff would occur. Price increases for agricultural water use could provide an incentive for farmers to invest in more efficient watering systems, but this could have the unintended effect of reducing the financial viability of small Arizona farmers lacking the capital for technology improvements. In 2012, about 60% of farms were between 1 and 9 acres in size and 63% of farms had sales of less than $2500 (Vilsack and Clark 2014). Small scale farms tend to operate with lower profit margins, so an increase in water prices could have a disproportionate impact on small farms. Irrigated farming operations in Arizona are seen as wasteful and foolish by some, who suggest there could be far better uses for the water such as housing development (Gammage et al 2011). Reducing the magnitude of farming in Arizona would require importing more food from out of state. Arizona might look to California and Mexico to supply the difference, but as drought concerns continue in California, agriculture may suffer enough to prevent export of sufficient food to supply Arizona.
Although this paper focused on Arizona, several aspects are relevant in other contexts as long as certain limitations are considered. The FEW nexus concept is applicable anywhere that agriculture requires energy and water, but the energy source and extent of energy use is likely to vary significantly based on geographic characteristics and local farming practices. Arizona's high energy intensity of water and high water intensity of energy mean that irrigation practices that reduce resource use here may not be as effective in other states where these relationships are different. Water scarcity is also not as significant an issue for many states, meaning that the payback period for installing more efficient irrigation systems may be longer. The effects of temperature increase on yield response and irrigation requirements may also be different in other contexts due to a different baseline temperature. In fact, the degree of temperature change will vary based on location as well. However, the methodology for determining reactions to temperature increase described in this paper should be applicable in other geographic regions.
6. Conclusion
Agriculture in Arizona relies heavily on irrigation, which consumes energy and water both directly and indirectly due to the coupled nature of these supply systems. Rising temperatures and disruptions to energy and water systems caused by climate change as well as increasing demand can cause failures that propagate across the FEW nexus and result in decreased yields, crop damage, and increased required resource use. We demonstrate that the complexity of interdependent systems supporting Arizona agriculture and reliance on irrigation creates a key point of vulnerability where the systems intersect. Irrigation is primarily fed by surface water and powered by electricity, which creates susceptibility to failures in energy and water systems cascading to agriculture. The severity of impacts from irrigation interruption depend on timing and duration, but can range from benign to complete crop failure. Longer duration and early season failures have the highest potential to damage crops and reduce viability. Temperature increase results in direct and indirect negative consequences including reduced crop yields and increased energy and water use for irrigation. Disruptions to Arizona agricultural production would have negative impacts for the food security of urban centers Phoenix and Tucson, as well as cities that have significant imported food from Arizona, including Los Angeles, San Diego, Las Vegas, and El Paso. The likelihood of simultaneous failures across the Southwest compounds this problem by reducing the adaptive capacity of cities to deal with import shortages or keep up with their export demands. Numerous technological and behavioral adaptation measures exist which could improve energy and water use efficiency, but many farmers lack the resources or motivation to invest in such measures. Arizona agriculture faces many challenges as the vulnerabilities of the FEW nexus combined with anticipated effects of climate change lead to higher operating expenses, uncertainty regarding crop viability, and reduced availability of necessary resources. Many farmers may lack the financial resources or tolerance for increased costs to implement adaptations, but such measures may be necessary for agriculture to continue to thrive in Arizona.
Acknowledgments
This work is supported by several National Science Foundation awards: WSC 1360509 (specifically an INFEWS supplement), RIPS 1441352, IMEE 1335556, IMEE 1335640, and SRN 1444755.