
Abstract
Northern peatlands are important carbon (C) sinks and while the patterns of C accumulation have been frequently investigated, nitrogen (N) and phosphorus (P) accumulation are often neglected. Here we link the C:N:P stoichiometry from foliar plant tissues, through senescent litters to peat, and determine C, N and P accumulation rates at Mer Bleue Bog, eastern Canada. Average C:N:P ratios changed from 794:17:1 in the foliar tissues to 911:10:1 in litter and 1285:32:1 in acrotelm peat. The increase in C:N and C:P ratios from mature to senescent tissues is related to nutrient resorption. The increase in C:P and N:P ratios in peat, which was contrary to that observed in Canadian forest soils, may be related to plant/mycorrhizae uptake of P. The long-term apparent rates of C, N and P accumulation were 29.5 ± 2.1 (SE) g C, 0.87 ± 0.01 g N and 0.017 ± 0.002 g P m−2 yr−1, respectively. The significant correlation between the accumulation rates of N and P and that of C suggests more attention be placed on C:N:P stoichiometry in peatland biogeochemistry, in particular in understanding why C:P ratios are so large in the lower parts of the profile.
Export citation and abstract BibTeX RIS

Content from this work may be used under the terms of the Creative Commons Attribution 3.0 licence. Any further distribution of this work must maintain attribution to the author(s) and the title of the work, journal citation and DOI.
1. Introduction
Northern peatlands store one-third (547 Gt) of the global total soil carbon (C) (Yu et al 2010), arising from the imbalance between primary productivity and litter and peat decomposition (Charman 2002). However, we know little about the accumulation of nitrogen (N) and phosphorus (P), two macro-nutrients essential in controlling both primary productivity and litter and peat decomposition. Ecological stoichiometry deals with elemental balances in ecological processes and interactions, providing an integrative nutrient framework linking biogeochemical patterns at scales from the global to the cellular or organismal (Sterner and Elser 2002). Koerselman and Meuleman (1996) suggest plant growth is N- or P-limited when the plant N:P ratio is smaller than 14 or larger than 16, respectively, and graminoid litter decomposition is affected by N and P concentrations and their ratio (Güsewell and Verhoeven 2006). Therefore, examining the decomposition cascade of C:N:P stoichiometry from plant foliage to senescent litters and to peat is of great importance in understanding nutrient cycling in northern peatlands.
There is significant (∼50%) resorption of nutrients, especially N and P, into plants during senescence (Aerts 1996, Güsewell 2005, Wang et al 2014), resulting in nutrient-depleted litter. The mismatch between the stoichiometry of litter and that of decomposers, primarily bacteria and fungi in northern peatlands (Winsborough and Basiliko 2010), governs ecosystem nutrient cycling and thus C accumulation (Sterner and Elser 2002, Hessen et al 2004). For example, the substantially larger C:N:P mass ratio of 1000:20:1 in subarctic flora than 180:6:1 in soil microbial biomass in tundra (Cleveland and Liptzin 2007) indicates a possible long-term net N and P immobilization in soil until a critical litter C:N and C:P ratio is reached.
A 12-year litter decomposition study in Canadian forests (Moore et al 2011), showed a convergence of litter C:N:P ratio of 427:17:1 with 20% of initial C remaining. This study also suggested the critical C:nutrient ratios for net mineralization were ∼40:1 for N and ∼1000:1 for P. Unlike most forest leaf litters, the litter of peat-forming Sphagnum mosses decomposes at much slower rates, with exponential k values of 0.02−0.08 yr−1 (Moore and Basiliko 2006), making the long-term measurement of nutrient dynamics more difficult. Yet peat profiles can be regarded as a record of the temporal changes in litter decomposition, over millennia. Here we link the C:N:P stoichiometry from mature plant tissues, through senescent litter to peat and determine C, N and P accumulation rates in an ombrotrophic bog located in eastern Canada. We hypothesize that:
- (1)the C:N and C:P stoichiometric ratios would increase from mature to senescent tissues due to nutrient resorption; and
- (2)the C:N and C:P stoichiometric ratios would decrease from senescent tissues to peat owing to microbial immobilization during decomposition.
2. Materials and methods
2.1. Study site
The Mer Bleue peatland is located 10 km east of Ottawa, eastern Ontario, Canada (45.40°N, 75.50°W). The central part of the peatland is an ombrotrophic bog with hummock and hollow micro-topography, covered mainly by a continuous layer of Sphagnum mosses and evergreen shrubs. The Mer Bleue peatland started accumulating ∼8500 yr before present (BP) in an abandoned channel of the Ottawa River. The early sedge-dominated fen phase switched to the current bog phase ∼6800 yr BP. The mean annual temperature, and monthly mean temperature in January and July are 6, −10.8 and 20.9 °C, respectively (Bubier et al 2007). The mean annual precipitation is 943 mm (76% as rainfall) and 350 mm of the precipitation falls from May to August (Canadian Climate Normals 1981−2010). The wet N deposition is ∼ 0.8 g N m−2 yr−1 (Turunen et al 2004) and wet P deposition ranges from 6 to 26 mg P m−2 yr−1 (Vet 2012).
2.2. Plant tissues sampling
The capitula of moss (S. capillifolium (Ehrh.) Hedw. and S. magellanicum Brid.) and the sun-exposed mature leaves from the top canopy of three evergreen shrubs (Chamaedaphne calyculata (L.) Moench, Rhododendron groenlandicum (Oeder) K.A. Kron & W.S. Judd and Kalmia angustifolia L.), one deciduous shrub (Vaccinium myrtilloides Michx.), one graminoid (Eriophorum vaginatum L.) and one forb (Maianthemum trifolium (L.) Sloboda) were randomly sampled (n = 5) in July and August. Senescent tissues of M. trifolia and V. myrtilloides were collected in September, and in October for E. vaginatum. The nutrient concentration in senescent leaves of C. calyculata and R. groenlandicum were derived from Wang et al (2014). For S. capillifolium, the current year's stem (the upper portion below the capitulum), collected in September 2012, was considered to represent their senescent tissues based on cranked wire growth (Moore et al 2002) and the morphology of Sphagnum stem leaves.
Total C and N concentration were determined by dry combustion on an elemental analyser (Leco CNS 2000, Leco Corporation, St. Joseph, Michigan, USA). Total P was determined colorimetrically by the ammonium molybdate-ascorbic acid method (Murphy and Riley 1962) on a Lachat Quik-Chem AE flow-injection auto-analyser (Lachat Instruments, Milwaukee, WI), after digestion in concentrated sulfuric acid and hydrogen peroxide with selenium and lithium sulfate as catalysts (Parkinson and Allen 1975). Digested samples were filtered through 0.45 μm glass fibre filters (MN 85/90, MACHEREY-NAGEL GmbH & Co. KG, Germany) before analysis.
2.3. Soil microbial biomass C, N and P
The C, N and P concentration in soil microbial biomass were derived from Basiliko (2004) who sampled peat at depth intervals of 0–5, 5–10, 10–20 and 20–30 cm from the surface at Mer Bleue. Samples were extracted by potassium sulfate after a chloroform fumigation treatment for 24 h.
2.4. Peat cores
Two peat cores, MB930 and MB775, were collected in the northwestern portion of the peatland, yielding complete peat profiles of 5.97 m and 3.47 m, respectively. The age models of the cores are based on radiocarbon dates and palynostratigraphical correlations for core MB930 (Frolking et al 2010), and on palynostratigraphical correlation with core MB930 for core MB775. Carbon, N and P concentrations were determined as described above, every 2 cm for the top 2 m of the cores and every 4 cm for the rest. Based on the stratigraphy of the peat cores, the portion of the peat profile corresponding to the acrotelm for this analysis is the upper ∼50 cm, a depth at which ∼20% of original C remains, based on the profile generated by the Holocene Peatland Model (Frolking 2013).
The C, N and P data from MB930 and MB775 were averaged by time interval (0–100, 100–200, 200–500, 500–1000, 1000–1500, 1500–2000, 2000–3000, 3000–4000, 4000–5000, 5000–6000, 6000–7000, 7000–8000 and >8000 cal. yr BP).
2.5. Statistics
The C:N:P stoichiometric mass ratios of living and senescent tissues at Mer Bleue were weighted arithmetic means based on foliar biomass of each species (Bubier et al 2006) and the net primary productivity of Sphagnum mosses (Moore et al 2002).
Shapiro–Wilk tests were used to examine the normality of data. Linear regression was used to examine the relationship between the accumulation rates C, N and P. The differences in the slope and intercept of the regression models between the bog and the fen phase were examined by t-test (Zar 1999). The differences in stoichiometric ratios between bog and fen phase were examined by t-test. Coefficients of variation (CV) were calculated as the mean divided by standard deviation. All the analyses were conducted in IBM SPSS Statistics Version 20.0 for Windows (IBM Corp., Armonk, New York State, USA).
3. Results
3.1. C:N:P stoichiometry from plants to peat
The average mass C:N:P ratio was 794:17:1 and 911:10:1 in mature and senescent tissues, with a smaller variation among plant functional types in mature tissues than that in senescent tissues in C:N (CV = 31 and 53% respectively) and N:P ratios (CV = 20 and 27% respectively) (figure 1). The C:N:P stoichiometry in graminoid and forb types varied little from mature to senescent tissues, whereas the C:N ratio increased in moss and deciduous species (by 121 and 97% respectively), the C:P ratio increased by 59% in deciduous species and N:P ratio decreased by 53% in moss during tissue senescence.
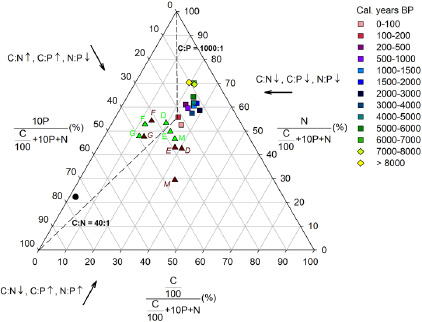
Figure 1. Ternary diagram showing the stoichiometric relationship of C, N and P from mature (green triangles) and senescent tissues (brown triangles) in deciduous (D), evergreen (E), graminoid (G), forb (F) and moss species (M), to peat (bog (squares) and fen (diamonds) phases) in comparison with microbes (circle). Dashed lines indicate the critical ratios of C:N (40) and C:P (1000). The thick arrows indicate the direction in which the axes should be read and the increase (↑) or decrease (↓) of the stoichiometric ratios. For visual reasons, the C and P concentration is divided and multiplied by a factor of 100 and 10, respectively.
Download figure:
Standard image High-resolution imageThe C:N:P stoichiometry averaged 31:3:1 and 2073:56:1 in microbes and peat, respectively, with significantly smaller C:P and N:P ratios and larger C:N ratios in the bog than fen phase (C:N:P = 1942:50:1 and 2422:78:1, respectively, p < 0.001, figure 2). From senescent tissues to acrotelm bog peat, the C:P and N:P ratios increased by 41 and 220% respectively, and the C:N ratio decreased by 54% (figure 1). An overall trend of decreasing C:N ratio and increasing C:P and N:P ratios with depth is observed from the top (young) to the bottom (old) of the bog phase and all three ratios slightly decrease with time (depth) within the previous fen phase (figure 2).
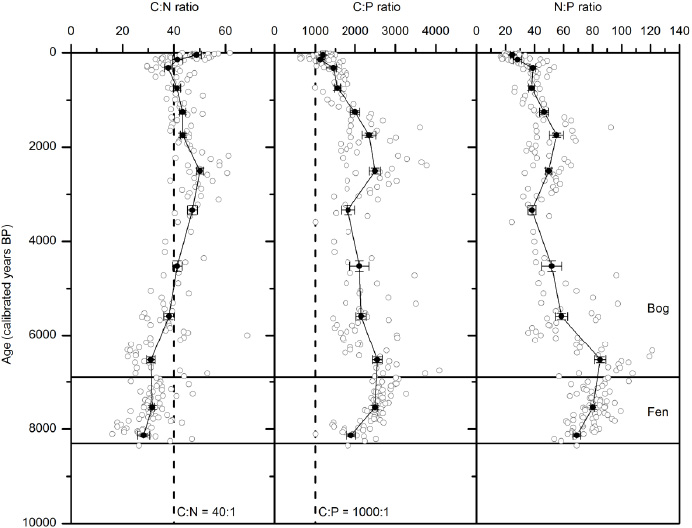
Figure 2. The stoichiometric mass ratio (mean ± SE) of C:N, C:P and N:P in peat profiles through time. Open circles are the individual data points from two profiles and filled circles are means based on grouped age intervals (see section 2 for details). The horizontal lines indicate the bog and fen phases in the profiles. The vertical dashed lines indicate the critical C:N and C:P ratios.
Download figure:
Standard image High-resolution image3.2. The accumulation rates of C, N and P
The long-term (∼8000 yr) apparent rates of C, N and P accumulation (LORCA, LORNA and LORPA, respectively) at Mer Bleue were 29.5 ± 2.1 g C m−2 yr−1 (mean ± SE), 0.87 ± 0.01 g N m−2 yr−1 and 0.017 ± 0.002 g P m−2 yr−1 respectively (figure 3). The rates were significantly smaller in the bog phase (22.7 ± 1.0 g Cm−2 yr−1, 0.57 ± 0.01 g N m−2 yr−1 and 0.015 ± 0.003 g P m−2 yr−1) than in the fen phase (46.0 ± 3.8 g C m−2 yr−1, 1.63 ± 0.04 g N m−2 yr−1 and 0.023 ± 0.002 g P m−2 yr−1). The average recent rate of C, N and P accumulation (RERCA, RERNA and RERPA, respectively) over the past 150 yr were 35.1 ± 2.4 g C m−2 yr−1, 0.78 ± 0.05 g N m−2 yr−1 and 0.033 ± 0.009 g P m−2 yr−1.

Figure 3. The apparent accumulation rates (mean ± SE) of C, N and P in peat profiles through time. Open circles are the individual data points from two profiles and filled circles are means based on grouped age intervals. The horizontal lines indicate the bog and fen phase in the profiles.
Download figure:
Standard image High-resolution imageThe accumulation rates of C were positively correlated with N and P accumulation rates in both the bog and fen phases, but there were differences (figure 4). In the bog and fen phases, a similar pattern of C and N accumulation occurs, whereas C and P have different relationships in the bog and fen phases, with C accumulation consistently faster in the fen phase than in the bog phase under the same rate of P accumulation. N and P accumulation rates were also positively correlated in both the bog and fen phases (R2 = 0.76 and 0.96 respectively, p < 0.001).
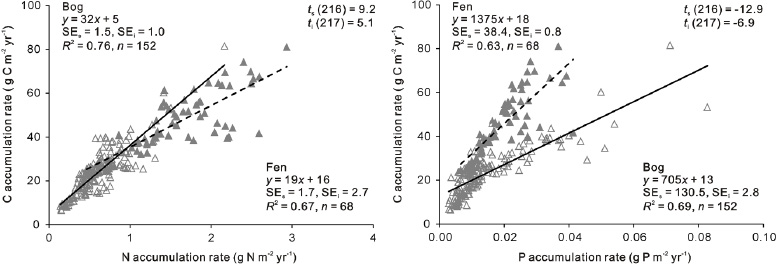
Figure 4. Relationship between the apparent accumulation rates of N and P and C accumulation rate in the bog (open triangle, solid lines) and fen (filled triangles, dashed lines) phases of the peat profiles. The regression model is significant (p < 0.001) in all cases. For each model, SEs and SEi indicate the standard error of the slope and intercept. The differences in the slope and intercept of the regression models between the bog and fen phases are all significant (p < 0.001) with ts and ti (degree of freedom in the parentheses) indicating the t values of the t-test on the difference in slope and intercept respectively.
Download figure:
Standard image High-resolution image4. Discussion
As part of a nutrient-deficient ecosystem, ombrotrophic bog evergreen plants show strong resorption of nutrients during tissue senescence, especially N and P (Wang et al 2014), that drives the trend of increasing C:N and C:P ratios from mature to senescent tissues (figure 5), supporting our first hypothesis. In senescent tissues at Mer Bleue, the C:N ratio (92:1) was larger and the C:P (911:1) and N:P ratios (10:1) were smaller than the C:N (50:1), C:P (1000:1) and N:P ratios (20:1) from subarctic flora (Aerts et al 2012) respectively. This discrepancy is probably because of the larger resorption efficiency of P (63%) in these high-latitude ecosystems (Freschet et al 2010) and the larger resorption of N of Sphagnum moss at Mer Bleue.

Figure 5. The cascade of C:N:P stoichiometry from leaves to peat in Mer Bleue Bog and soil organic horizons in Canadian forests, with C:N ratios in parentheses. The C:N:P stoichiometry in living tissues from Canadian forests are derived from Paré et al (2012), with 8 of the species included in Moore et al (2011) from Canadian sites (Betula papyrifera, Fagus grandifolia, Larix laricina, Picea mariana, Pinus banksiana, Populus tremuloides, Pseudotsuga menziesii and Thuja plicata) and assuming the C content is 50% of the dry mass. The C:N:P stoichiometry in litter (arithmetic mean of 10 litter types) and soil organic horizons (arithmetic mean of 22 sites) from Canadian forests are derived from Moore et al (2011). The C:N:P stoichiometry of soil microbial biomass (decomposers) in forest organic horizons are derived from Basiliko et al (2009). Not drawn to scale.
Download figure:
Standard image High-resolution image
Litter decomposition should decrease C:N and C:P ratios to approach that of the decomposers as N and P are immobilized and C released until critical C:N and/or C:P ratios are reached, for example mass C:N and C:P ratios of ∼40 and ∼1000 in Canadian forest litter (Moore et al 2011). There are no equivalent long-term litter decomposition studies in peatlands, so it is not clear whether these critical ratios may be applicable for ombrotrophic bogs. After 12 years of decomposition in Canadian forests, Moore et al (2011) found a convergence in mass C:N:P to 427:17:1 with 20% of the original C remaining. Compared to the soil surface organic horizons (i.e. LFH), the C:N ratios increased from 25 to 42, the N:P ratio decreased from 17 to 10 and the C:P ratios remained similar at 427 to 420 (figure 5) (Moore et al 2011). In contrast, our results show a decrease in C:N ratio but a substantial increase in C:P and N:P ratios from senescent tissues to acrotelm and deeper peat. These are very different from the ratios in Mer Bleue peat microbes (figure 5), rejecting our second hypothesis. Our in situ buried-bag peat incubation showed a weak mineralization of N and immobilization of P after 3 months (Wang 2012), supporting the hypothesis that the mismatch of the stoichiometry between peat and decomposers plays an important role in regulating nutrient cycling.
In the peat, the movement of the C:P and N:P ratios away from those of the soil microbes may be the result of two mechanisms. First, the formation of cluster roots and the carboxylate exudation pathway have been shown to be an important P-acquisition strategy in nutrient-impoverished soils in Australia (Lambers et al 2012, 2013). However, there is no evidence of cluster roots in the dominant shrub species at Mer Bleue (Murphy 2013) and the low pH (<5.0) does not favour the carboxylate-releasing strategy (Lambers et al 2012).
Second, associations with ericoid mycorrhizae grant ericaceous shrubs the advantage of taking up N and P, the co-limiting nutrients (Smith and Read 2008). Long-term fertilization at Mer Bleue with N, P and potassium (K) over a decade showed that shrub growth was only stimulated after fertilization by both N and PK (Larmola et al 2013), supporting N and P co-limitation based on leaf-level N:P:K stoichiometry (Wang and Moore 2014). The absence of significant external P input and elevated atmospheric N deposition in ombrotrophic systems requires efficient internal cycling of P. Consequently, the preference of uptake for P over N may account for the increase in C:P and N:P ratios with depth in the bog phase of the peat. In the fen phase with dominant sedges without mycorrhizae, decreasing C:P and N:P ratios with depth were observed (figure 2). In contrast to bogs, the preferential uptake of N over P in Canadian forests, which are primarily N-deficient ecosystems, may explain the increasing C:N ratio, decreasing N:P ratio and litter change in C:P ratio from litter to soil organic horizon as discussed above. The preferential uptake of limited nutrients in bogs and Canadian forests suggests that plant/mycorrhizae associations can out-compete microbes in taking up limited nutrients and are important in biogeochemical cycling.
The strong correlation between C and N and P accumulation rates at Mer Bleue suggests the indispensable role of N and P in controlling C accumulation. Extrapolating the average C:N (37) and C:P (2073) ratios in peat from Mer Bleue to northern peatlands with a storage of 547 Gt C, we estimate that northern peatlands store 15 Gt N and 0.3 Gt P, respectively, comprising 11–16% of the N in global soil organic matter (95–140 Gt N) and ∼2% of the P in labile or organic form in soils to a 50 cm depth (13.8 Gt P) (Schlesinger and Bernhardt 2013). Our LORCA falls within the range from 24 to 37 g C m−2 yr−1 in North America (Gorham and Janssens 2005) and from 5 to 34 g C m−2 yr−1 in eastern Canada (Turunen et al 2004), and larger than the time-weighted C accumulation rate of 22.9 ± 2.0 g C m−2 yr−1 in northern peatlands during the Holocene (Loisel 2013). However, N and P accumulated faster at Mer Bleue than rates reported by Gorham and Janssens (2005) of 0.36−0.55 g N m−2 yr−1 and 0.008−0.014 g P m−2 yr−1, and the Holocene time-weighted N accumulation rate of 0.5 ± 0.04 g N m−2 yr−1 in northern peatlands (Loisel 2013). The short term (∼150 years) C and N accumulation rates are lower than those determined by 210Pb dating in eastern Canada, ranging from 40 to 117 g C m−2 yr−1 and from 1.1 to 2.5 g N m−2 yr−1 (Turunen et al 2004).
The P (co)limitation at Mer Bleue, as indicated by C:N:P:K stoichiometry in mature tissues and long-term fertilization, suggests the processes which maintain P at co-limitation are important to understanding biogeochemical processes in ombrotrophic bogs. The increase in C:nutrient ratios from mature to senescent tissues is related to efficient nutrient resorption and the increase in C:P and N:P ratios in peat profiles may be related to plant/mycorrhizae uptake of nutrients. The significant correlation between the accumulation rates of N and P and that of C suggests more attention be placed on C:N:P stoichiometry in peatland biogeochemistry, in particular in understanding why C:P ratios are so large in the lower parts of the profile and that P limitation may be a significant control on plant production.
Acknowledgments
We gratefully acknowledge the laboratory assistance of Leanne Elchyshyn, Hélène Lalande, Sheng-Ting Lin and Cheenar Shah, and the field assistance of Zhaojun Bu, Mike Dalva, Tuula Larmola and Zheng Wang. We are grateful to Steve Frolking, Jill Bubier and Tuula Larmola for their comments that improved the earlier version of the manuscript. This research was funded by a Natural Sciences and Engineering Research Council Discovery Grant to TRM. MW as awarded a PhD fellowship by the Chinese Scholarship Council. We thank the National Capital Commission for access to Mer Bleue.