
Abstract
Global warming is expected to enhance fluxes of fresh water between the surface and atmosphere, causing wet regions to become wetter and dry regions drier, with serious implications for water resource management. Defining the wet and dry regions as the upper 30% and lower 70% of the precipitation totals across the tropics (30° S–30° N) each month we combine observations and climate model simulations to understand changes in the wet and dry regions over the period 1850–2100. Observed decreases in precipitation over dry tropical land (1950–2010) are also simulated by coupled atmosphere–ocean climate models (−0.3%/decade) with trends projected to continue into the 21st century. Discrepancies between observations and simulations over wet land regions since 1950 exist, relating to decadal fluctuations in El Niño southern oscillation, the timing of which is not represented by the coupled simulations. When atmosphere-only simulations are instead driven by observed sea surface temperature they are able to adequately represent this variability over land. Global distributions of precipitation trends are dominated by spatial changes in atmospheric circulation. However, the tendency for already wet regions to become wetter (precipitation increases with warming by 3% K−1 over wet tropical oceans) and the driest regions drier (precipitation decreases of −2% K−1 over dry tropical land regions) emerges over the 21st century in response to the substantial surface warming.
Export citation and abstract BibTeX RIS

Content from this work may be used under the terms of the Creative Commons Attribution 3.0 licence. Any further distribution of this work must maintain attribution to the author(s) and the title of the work, journal citation and DOI.
1. Introduction
Based upon energy and moisture budget constraints, precipitation (P) is expected to increase in the global mean as surface temperature (T) rises, in particular for regions that experience the most rainfall already (Held and Soden 2006, Mitchell et al 1987, Muller and O'Gorman 2011, Seager and Naik 2011). Although regional projections of future precipitation are subject to substantial uncertainty (Meehl et al 2007) there is a sound physical basis for anticipating drying of the dry subtropics and increased precipitation in the wet inter-tropical convergence zone (ITCZ) and for the extratropics poleward of around 45° N/S as global temperatures rise (Held and Soden 2006, Seager and Naik 2011).
Signals of these changes in wet and dry regions are beginning to emerge from the observational record (Zhang et al 2007, Allan et al 2013, Noake et al 2012, Liu et al 2012, Chou et al 2013). However, observational limitations (spatial and temporal coverage and homogeneity) and substantial regional variability in atmospheric circulation mean that it is difficult to demonstrate consistency in physical mechanisms necessary for building confidence in future projections. In addition to the thermodynamic moisture balance-driven changes in precipitation, subtropical drying may equally be explained by dynamical processes such as poleward expansion of tropical Hadley circulation (Scheff and Frierson 2012). For continental climates, cause and effect between T and P coupling can be ambiguous (Trenberth and Shea 2005) with warm phases of El Niño southern oscillation (ENSO) leading to reduced rainfall over land (Gu et al 2007, Liu et al 2012). The nature of radiative forcing and its impact on atmospheric circulation additionally introduce complex regional responses in precipitation patterns relating to the strength and position of the Walker and Hadley circulations (Bony et al 2013, Bollasina et al 2011, Wilcox et al 2013).
By separating dynamic and thermodynamic drivers of precipitation change (e.g. Emori and Brown 2005, Allan 2012, Chadwick et al 2013, Bony et al 2013) it is possible to improve understanding of the physical mechanisms operating. In the present study we adopt a simplified approach to analyse separately changes in the wet and dry regions, defined dynamically each month as the 30% of wettest grid points and 70% of driest grid points within the tropics, based upon gridded P (Allan et al 2010) or considering precipitation minus evaporation (P − E) fields. Thus, the geographical location of the wet and dry regions alters from month to month and year to year; this ensures that the expected signals relating to enhanced moisture convergence and divergence with global and tropical warming are maximized. Global and tropical precipitation changes and relationships with surface temperature are analysed over the period 1850–2100 combining gauge-based and satellite-based observations where available with a suite of climate model simulations employing realistic radiative forcings. The influences of surface temperature and atmospheric circulation on the spatial signature of the precipitation trends are discussed.
2. Data sets
The observational and simulated data sets used in the present study are listed in table 1 with some brief descriptions. The rain-gauge observations from the University of East Anglia (UEA) (Hulme et al 1998) and Global Precipitation Climatology Centre (GPCC) (Rudolf et al 2010) cover global land since 1900 although spatial coverage is limited in many regions. The Global Precipitation Climatology Project (GPCP) blends GPCC observations over land with satellite retrievals including sounding observations, microwave measurements and infrared radiances since 1979 (Adler et al 2008, Huffman and Bolvin 2011). The reconstructed precipitation data from CICS/ESSIC (Cooperative Institute for Climate and Satellites/Earth System Science Interdisciplinary Center) using global Empirical Orthogonal Function analyses of GPCP data and the Global Historical Climate Network (GHCN) gauge data are also used for comparison purpose (Smith et al 2012, Ren et al 2013). The observed surface temperature is from the HadCRUT4 (Morice et al 2012) data set (ensemble medians). Additionally, a multi-variate ENSO index (MEI) is also used in the comparisons (Wolter and Timlin 1998).
Table 1. Observed and simulated data sets and their properties. Ticks indicate the data set is used in the corresponding analysis.
| Data set | Lat × Lon resolution | AMIP5 | Historical | RCP 4.5 | References |
|---|---|---|---|---|---|
| BCC-CSM | 2.77° × 2.81° | ✓ | Wu et al (2013) | ||
| CanESM2 | 2.77° × 2.81° | ✓ | ✓ | ✓ | Arora et al (2011) |
| CCSM4 | 0.94° × 1.25° | ✓ | Gent et al (2011) | ||
| CNRM-CM5 | 1.39° × 1.41° | ✓ | ✓ | ✓ | Voldoire et al (2013) |
| CSIRO-Mk3.6 | 1.85° × 1.88° | ✓ | Rotstayn et al (2012) | ||
| GISS-E2 | 2.0° × 2.5° | ✓ | ✓ | ✓ | Schmidt et al (2006) |
| HadGEM2 | 1.25° × 1.88° | ✓ | ✓ | ✓ | Collins et al (2011) |
| INMCM4 | 1.5° × 2.0° | ✓ | ✓ | ✓ | Volodin et al (2010) |
| IPSL-CM5A-LR | 1.89° × 3.75° | ✓ | ✓ | ✓ | Hourdin et al (2013) |
| MIROC5 | 1.39° × 1.41° | ✓ | ✓ | ✓ | Watanabe et al (2010) |
| MPI-ESM-LR | 1.85° × 1.88° | ✓ | Raddatz et al (2007) | ||
| MRI-CGCM3 | 1.11° × 1.13° | ✓ | ✓ | ✓ | Yukimoto et al (2012) |
| NorESM1-M | 1.89° × 2.5° | ✓ | ✓ | ✓ | Zhang et al (2012) |
| UEA | Global land, 0.5° × 0.5° | Hulme et al (1998) | |||
| GPCC v6 | Global land, 1° × 1° | Rudolf et al (2010) | |||
| GPCP v2.2 | Combined observed precipitation from satellite and rain gauges. Monthly data, global ocean and land, 2.5° resolution | Adler et al (2008), Huffman and Bolvin (2011) | |||
| CICS/ESSIC | Reconstructed precipitation (anomalies + climatology). Analysis are computed using global EOF analyses of GPCP 1979–2008 data to form statistics. GHCN (global historical climate network) gauge data are fit to the EOF modes to produce the analyses. 5° resolution, global | Smith et al (2012) | |||
| HadCRUT4 | Monthly data, global, 5° resolution. Median anomaly from 100 ensemble members in each grid box | Morice et al (2012) | |||
We exploit a range of simulations from the Coupled Model Inter-comparison Project phase 5 (CMIP5; Taylor et al 2012; http://cmip-pcmdi.llnl.gov/cmip5/) from a range of modelling centres, detailed in table 1. These include coupled simulations for the past (1850–2005 historical experiment using realistic past radiative forcings) and projections made thereafter from 2006 to 2100 (RCP4.5: Representative Concentrations Pathway 4.5, a mid-range scenario where radiative forcing reaches 4.5 W m−2 by the end of the 21st century; Thomson et al 2011). Also used are atmosphere-only CMIP5 simulations (AMIP5) in which observed sea surface temperatures and sea ice distribution are prescribed as boundary conditions. These cover the period 1979–2008 apart from the GISS model from which simulations over the period 1950–2010 are utilized. We compute the ensemble mean from the range of models highlighted in table 1; to ensure equal weighting from each model, we consider only one ensemble member from each experiment to form composite AMIP5 and CMIP5 historical and RCP 4.5 data sets.
3. Mechanisms for changes in the global and regional atmospheric water cycle
As discussed by Held and Soden (2006), assuming that tropical circulations do not substantially alter, moisture balance dictates that P − E patterns enhance with warming in proportion to the increases in low-level moisture with warming, α ∼ 7% K−1, which is determined by the Clausius–Clapeyron equation:

Figures 1(c)–(f) illustrate the projected enhancement of P − E for the tropical (30° S–30° N) wettest 30% and driest 70% of grid points (land and ocean) as defined in section 1 for the CMIP5 historical/RCP4.5 simulations over the period 1850–2100, together with the present day AMIP5 simulations. Also shown in figures 1(a) and (b) are variations in T, together with the ensemble medians from HadCRUT4 observations. Anomalies are calculated based on the reference period from 1860 to 1950 for CMIP5 historical data. Since RCP 4.5 runs are projections following on from the CMIP5 historical runs, they share the same base. The reference period for HadCRUT4 is from 1961 to 1990 and from 1988 to 2005 for AMIP5 data sets whose anomalies are shifted up and down to match the 1988–2005 mean from the CMIP5 historical simulation ensemble mean. Warming since 1850 over tropical oceans and land are punctuated by cooling following large volcanic eruptions (Krakatoa in 1883, Santa María in 1902, Agung in 1963, and Mount Pinatubo in 1991) and relating to negative aerosol radiative forcing from 1950 to 1965 (Wilcox et al 2013).
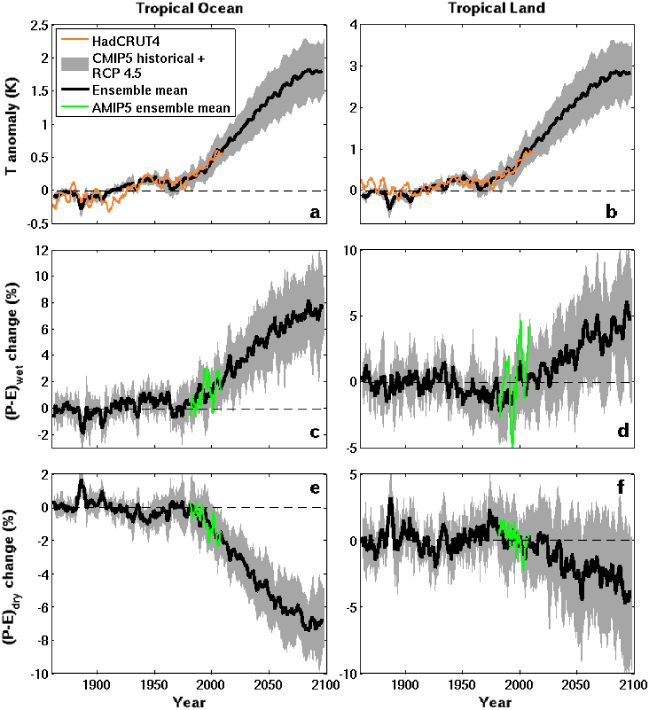
Figure 1. Deseasonalized anomaly time series of temperature ((a), (b)) and precipitation minus evaporation (P − E) changes over the tropical oceans and the tropical land for ((c), (d)) wet and ((e), (f)) dry regions. The wet and dry regions are defined as the 30% highest and 70% lowest P − E grid points each month. Data are from the CMIP5 historical and RCP 4.5 simulations (1850–2100) and the AMIP simulations (1979–2008). Anomalies are calculated with respect to the 1860–1950 period for CMIP5 historical data, 1961–1990 for HadCRUT4 and 1988–2005 for AMIP5 data sets; HadCRUT4 and AMIP anomalies are adjusted to agree with the CMIP5 ensemble mean over the period 1988–2005. All lines are 48 month running means. The shaded area is the ensemble mean ± 1 standard deviation.
Download figure:
Standard image High-resolution imageThere is a clear amplification of P − E over the ocean (figures 1(c) and (e)) of around 6% over the 21st century as anticipated from the substantial warming of up to 1.5 ° C (figure 1(a)) indicating a sensitivity of around 4% K−1. This is lower than anticipated from the Clausius–Clapeyron scaling and may be explained by reduced tropical circulation caused by the inter-play between energy budget constraints on global precipitation changes and the Clausius–Clapeyron constraint upon low-level moisture (Held and Soden 2006, Bony et al 2013). Assuming precipitation rate is equal to the boundary layer specific humidity (q) multiplied by the mass flux of moisture from the boundary layer into the free troposphere per second (M):

Since q increases at the Clausius–Clapeyron scaling of 7% K−1, while P is constrained by the rate at which additional latent heating in the atmosphere may be radiated away, around 2% K−1, then M must decrease (Allen and Ingram 2002, Held and Soden 2006, Chadwick et al 2013). However, not all the low-level moisture flux from the boundary layer to the free troposphere is involved in precipitation, some being transported away from the wet regions in the mid-troposphere (Zahn and Allan 2013); this may explain why P − E changes are reasonably well approximated by the simple Clausius–Clapeyron scaling arguments (Held and Soden 2006). Indeed, climate model projections suggest that dynamical weakening of the tropical circulation only offsets around half of the wet gets wetter and dry gets drier response in the tropics (Allan 2012).
An additional effect on tropical circulation and precipitation arises through the direct atmospheric heating effect from CO2 radiative forcing which operates rapidly, within days (Cao et al 2012). From equation (2), decreases in P yet unchanged q (since surface temperature has not yet begun to respond to the radiative forcing) also imply reduced M leading to reduced tropical circulation (Bony et al 2013).The magnitude of the direct effect of CO2 radiative forcing on P is relatively large compared with surface warming influence in the 20th century while the warming effect on P becomes increasingly important in the 21st century: this is likely to be important in determining the time-dependent changes in tropical circulation and P (Allan et al 2013).
Changes in P − E are variable over the 20th century where warming is relatively weak although small increases in P − E in the wet region since 1950 (excluding years affected by volcanic cooling) are in agreement with simulated and observed amplification of salinity patterns (Durack et al 2012). P − E over land displays contrasting responses in the wet and dry regions (figures 1(d) and (f)). However, the range of changes by different models is substantial, indicating that land-surface feedbacks may be important (for example, moisture availability is limited over some regions such that evaporation cannot continue to increase with surface warming). The AMIP5 simulations capture the coupled model trends although indicate substantial variability over wet tropical land regions.
Using equation (1) as a predictor of changes in P alone is useful in comparing with available observations. Held and Soden (2006) note that assuming E increases in proportion to the global-mean rate (∼2% K−1) then equation (1) becomes:

where β = 1 − (0.02/α) ∼ 0.7. Assuming α > 0.02 K−1, then dP/dT > 0 for P > βE and dP/dT < 0 for P < βE, thus indicating that dP/dT is positive for higher percentiles of P and negative for low percentiles.
4. Observed and simulated changes in precipitation
We now investigate the responses in P globally and over the wet and dry portions of the tropics in observations and model simulations. Trends (dP/dt) and sensitivity to surface temperature (dP/dT) are computed in tables 2–3 and area-mean P anomaly variations from different data sets over the wet and dry tropical oceans and land are plotted in figure 2 (and figure S1 available at stacks.iop.org/ERL/8/034002/mmedia). The calculated anomalies from observations (GPCP and GPCC) relative to the reference period 1988–2005 are shifted to match the 1988–2005 CMIP5 historical ensemble mean.

Figure 2. Time series of precipitation anomalies over the tropical oceans and land; ((a), (b)) over the wet tropical oceans and land; ((c), (d)) over the dry tropical oceans and land. The reference period for CMIP5 historical and RCP 4.5 model simulations are from 1860 to 1950 and from 1988 to 2005 for GPCP and GPCC. The GPCP data prior to the microwave era (1988) over the tropical oceans are not plotted. GPCP and GPCC anomalies are adjusted to agree with the CMIP5 ensemble mean over the period 1988–2005. All lines are 48 month running means. The shaded area is the ensemble mean ± 1 standard deviation. The wet region is defined as the 30% highest P grid points and the dry region the 70% lowest P grid points each month.
Download figure:
Standard image High-resolution imageTable 2. Precipitation trend for different data sets over various time periods. Statistically significant values at the 95% confidence level are marked bold. Δm denotes the 95% confidence range. Trends from composite model runs are calculated from ensemble means.
| Data set | Period | Global | Global land | Tropical ocean | Tropical land | ||
|---|---|---|---|---|---|---|---|
| dP/dt | dP/dt | dPwet/dt | dPdry/dt | dPwet/dt | dPdry/dt | ||
| m ± Δm (%/dec) | m ± Δm(%/dec) | m ± Δm(%/dec) | m ± Δm(%/dec) | m ± Δm(%/dec) | m ± Δm(%/dec) | ||
| GPCP v2.2 | 1979–2008 | 0.14 ± 0.23 | 0.23 ± 0.47 | 2.8 ± 0.56 | −6.6 ± 1.0 | 0.68 ± 0.66 | −1.3 ± 1.4 |
| 1988–2008 | 0.18 ± 0.40 | 0.90 ± 0.81 | 1.7 ± 0.96 | −3.4 ± 1.6 | 2.0 ± 1.2 | −1.5 ± 2.5 | |
| GPCC v6 | 1950–2010 | −0.06 ± 0.18 | −0.16 ± 0.23 | −0.58 ± 0.49 | |||
| 1979–2008 | 0.93 ± 0.50 | 1.6 ± 0.69 | −0.02 ± 1.4 | ||||
| UEA | 1950–2010 | 0.11 ± 0.18 | −0.13 ± 0.24 | 0.41 ± 0.47 | |||
| 1979–2008 | 1.2 ± 0.51 | 1.6 ± 0.70 | 2.5 ± 1.3 | ||||
| CICS/ESSIC | 1950–2008 | 0.19 ± 0.08 | 0.06 ± 0.10 | 0.70 ± 0.21 | −0.29 ± 0.34 | 0.05 ± 0.16 | −0.13 ± 0.28 |
| 1979–2008 | 0.60 ± 0.21 | 0.85 ± 0.27 | 1.6 ± 0.61 | −1.6 ± 0.98 | 1.6 ± 0.46 | 0.21 ± 0.72 | |
| GISS AMIP5 | 1950–2010 | 0.02 ± 0.04 | −0.16 ± 0.13 | 0.41 ± 0.12 | −0.76 ± 0.20 | −0.40 ± 0.19 | −1.3 ± 0.54 |
| 1979–2008 | 0.17 ± 0.10 | 0.41 ± 0.37 | 0.41 ± 0.34 | −0.75 ± 0.60 | 0.49 ± 0.51 | −0.68 ± 1.5 | |
| AMIP5 ensemble | 1979–2008 | 0.30 ± 0.07 | 0.56 ± 0.31 | 0.65 ± 0.26 | −1.0 ± 0.42 | 0.82 ± 0.47 | −0.79 ± 0.94 |
| CMIP5 historical + RCP 4.5 | 1950–2010 | 0.11 ± 0.02 | 0.15 ± 0.07 | 0.17 ± 0.05 | −0.31 ± 0.08 | 0.00 ± 0.09 | −0.33 ± 0.22 |
| 1979–2008 | 0.40 ± 0.05 | 0.65 ± 0.19 | 0.37 ± 0.15 | −0.31 ± 0.25 | 0.48 ± 0.25 | −0.19 ± 0.65 | |
| RCP 4.5 | 2006–2055 | 0.48 ± 0.02 | 0.56 ± 0.08 | 0.61 ± 0.07 | −0.18 ± 0.12 | 0.43 ± 0.12 | −0.33 ± 0.27 |
| 2006–2100 | 0.42 ± 0.01 | 0.50 ± 0.03 | 0.48 ± 0.03 | −0.01 ± 0.05 | 0.42 ± 0.05 | −0.29 ± 0.11 | |
Table 3. As table 2 but for precipitation responses to the surface temperature changes (dP/dT).
| Data set | Period | Global | Global land | Tropical ocean | Tropical land | ||
|---|---|---|---|---|---|---|---|
| dP/dT | dP/dT | dPwet/dT | dPdry/dT | dPwet/dT | dPdry/dT | ||
| m ± Δm (% K−1) | m ± Δm(% K−1) | m ± Δm(% K−1) | m ± Δm(% K−1) | m ± Δm(% K−1) | m ± Δm(% K−1) | ||
| GPCP v2.2 | 1979–2008 | 1.0 ± 0.98 | −0.25 ± 2.0 | 14.2 ± 2.6 | −26.2 ± 5.0 | −3.3 ± 3.1 | −11.9 ± 6.7 |
| 1988–2008 | 2.2 ± 1.4 | 0.85 ± 2.8 | 11.1 ± 3.2 | −9.7 ± 5.8 | −2.6 ± 4.2 | −9.9 ± 8.8 | |
| GPCC v6 | 1950–2010 | −0.97 ± 1.2 | −3.9 ± 1.7 | −12.5 ± 3.5 | |||
| 1979–2008 | 1.6 ± 2.2 | −0.36 ± 3.3 | −10.8 ± 6.5 | ||||
| UEA | 1950–2010 | 0.08 ± 1.3 | −3.7 ± 1.7 | −4.9 ± 3.4 | |||
| 1979–2008 | 3.0 ± 2.2 | 0.95 ± 3.3 | 0.73 ± 6.2 | ||||
| CICS/ESSIC | 1950–2008 | 1.7 ± 0.55 | 0.24 ± 0.74 | 5.2 ± 1.5 | 1.9 ± 2.5 | −0.86 ± 1.2 | −5.1 ± 2.0 |
| 1979–2008 | 2.3 ± 0.92 | 1.8 ± 1.2 | 7.0 ± 2.9 | −0.28 ± 4.7 | 2.6 ± 2.3 | −3.2 ± 3.4 | |
| GISS | 1950–2010 | 1.1 ± 0.25 | −1.8 ± 0.97 | 5.0 ± 0.87 | −5.4 ± 1.4 | −4.4 ± 1.3 | −15.9 ± 3.7 |
| 1979–2008 | 1.8 ± 0.43 | 0.05 ± 1.8 | 5.3 ± 1.5 | −4.8 ± 2.8 | −2.2 ± 2.4 | −16.8 ± 6.9 | |
| AMIP5 | 1979–2008 | 1.5 ± 0.19 | 1.7 ± 0.97 | 4.8 ± 1.1 | −5.6 ± 1.9 | −4.4 ± 2.2 | −6.9 ± 4.3 |
| CMIP5 historical + RCP 4.5 | 1950–2010 | 1.3 ± 0.11 | 1.6 ± 0.45 | 2.5 ± 0.39 | −2.3 ± 0.68 | 0.15 ± 0.68 | −3.7 ± 1.8 |
| 1979–2008 | 1.9 ± 0.17 | 2.6 ± 0.76 | 2.8 ± 0.67 | −2.2 ± 1.2 | 1.6 ± 1.2 | −3.6 ± 3.1 | |
| RCP 4.5 | 2006–2055 | 1.9 ± 0.07 | 2.2 ± 0.33 | 3.0 ± 0.30 | −1.0 ± 0.56 | 1.5 ± 0.54 | −2.3 ± 1.23 |
| 2006–2100 | 2.1 ± 0.04 | 2.5 ± 0.17 | 2.9 ± 0.16 | −0.20 ± 0.30 | 2.2 ± 0.29 | −2.1 ± 0.64 | |
Global warming since 1950 (0.11 K/decade in HadCRUT4, 0.13 K/decade in CMIP5 simulations) is accompanied by increasing global mean P in CMIP5 simulations (0.11%/decade), primarily determined by large increases over wet regions since 1979. The global interannual sensitivity dP/dT ranges from 1.0–2.3% K−1 depending upon dataset and time period (table 3), broadly consistent with energetic constraints (Andrews et al 2010). For the present period (1979–2008) global precipitation trends (0.3–0.4%/decade) and interannual responses to T (1.5–1.9% K−1) from AMIP5 and CMIP5 simulations are larger than the GPCP estimates (∼1% K−1). Over global land, precipitation trends are not statistically significant over the period 1950–2010 in observations or models and are only significantly positive for the 1979–2008 period in CMIP5 simulations and UEA and CICS/ESSIC observations (table 2). Simulated global P increases with warming in the future (around 0.5%/decade and 2% K−1). Precipitation increases steadily with time in the projections of RCP 4.5 and stabilizes after ∼2060 due to equilibrating surface temperatures and radiative forcing (Thomson et al 2011, Allan et al 2013).
Consistent with more positive P − E in wet regions and more negative P − E in dry regions (figure 1) there is a clear tendency for P to increase in the wettest regions of the tropics and decrease in the drier regions in the future (figure 2). Equation (3) dictates that in the wet regions, where P ≫ E, dP/dT is similar to the expected (P − E) response. However, in the dry regions where P < E, increased E with warming offsets the contribution from enhanced divergence of moisture out of the atmospheric column (e.g. Bony et al 2013). This leads to decreases in P (figures 2(c) and (d)) that are smaller than the decreases in P − E over the ocean (figure 1(e)) but larger than that over dry land (figure 1(f)) due to limited availability of moisture for evaporation.
Characteristics of tropical P variability during the 20th century are more complex than the P − E changes and there are large discrepancies between observations and simulations (figure 2; Balan Sarojini et al 2012). Climate model simulations indicate robust precipitation decreases in the tropical dry regions of about −0.3%/decade from 1950 to 2010 (table 2) with larger magnitude (but not statistically significant) decreases also detected in the Global Precipitation Climatology Centre (GPCC) observations over tropical dry land (−0.58%/decade). Comparing figures 1(e)–(f) and 2(c)–(d), and considering equation (3), this suggests that decreases in E over dry land accompany declines in P over the 20th century, leading to stable freshwater flux, P − E. This appears not to be the case for projections into the future with decreases in P − E in the dry regions (figures 1(e) and (f)). Climate model simulations indicate a continuation of the weak drying trends over tropical dry regions out to 2050 over ocean and out to 2100 over land (figures 2(c) and (d); table 2). Precipitation appears to stabilize earlier in the 21st century over the ocean than over land, particularly for the dry regions (figures 2(c) and (d)) which may indicate exacerbating land-surface feedbacks (e.g. Lo and Famiglietti 2011). Changes in water vapour transport from ocean to land (Gimeno et al 2013) related to the contrast of land/ocean temperature difference may also influence these changes and this merits further investigation.
Over the wet tropical ocean, P − E and P variability (figures 1(c) and 2(a)) are linked with changes in T (1(a)) and the volcanic suppression of precipitation is clearly evident (figure 2(a)), although responses are delayed relative to the tropical land (Gu et al 2007, Trenberth and Dai 2007). The GPCP data shows substantial variability and the data are not plotted prior to 1988, when microwave retrievals were not available, since they do not form a homogeneous dataset over the ocean (e.g. Liu et al 2012). The CICS/ESSIC ocean P variability is also at odds with model simulations over the 20th century (figure S1; Ren et al 2013). Over the recent period (1988–2008) precipitation trends are 1.7%/decade for GPCP and 0.35%/decade for the model ensemble mean; the observed trend is much stronger than the model simulations as previously identified by Wentz et al (2007) but observed trends are highly sensitive to time period and dataset (John et al 2009) precluding firm conclusions relating to the fidelity of model simulations or observations. The standard deviation of model spread (1970–2100) over wet land (∼5.8%) is larger than over the ocean wet region (∼3.9 %) indicating a diversity of projections, likely involving land-surface feedbacks.
For wet tropical land regions there is a more complex picture with stagnant or declining precipitation during the period 1950–2010 in observations and models (figure 2(b), figure S1), relating to negative volcanic and aerosol forcing over the period 1950–70 (Wilcox et al 2013). Rapid rises in P are simulated by climate models over all wet tropical regions after 1979 with 2006–55 trends around 0.5–0.6%/decade over the ocean and 0.4%/decade for land (table 2; figures 2(a) and (b)).
To investigate the contrasting observed and simulated variability in tropical land P we employ AMIP5 experiments in which observed sea surface temperature and sea ice fields are prescribed along with realistic radiative forcings, consistent with the historical CMIP5 experiment (figure 3; anomalies are calculated relative to the reference period 1988–2005). In addition to the AMIP5 ensemble mean (1979–2008) we also use the GISS-ER extended AMIP5 simulation (1950–2008).

Figure 3. Time series of precipitation anomalies over the tropical land for (a) wet and (b) dry regions respectively. All lines are 48 month running means. The shaded area is the ensemble mean ± 1 standard deviation. Multi-variate ENSO index (MEI) is multiplied by −5.
Download figure:
Standard image High-resolution imageThe AMIP5 simulations are able to capture the substantial decadal fluctuations in P over tropical land in the observations (figure 3). Correlation between the AMIP simulations and the observational datasets is significant over the wet tropical land regions for the 1979–2008 period, ranging from r = 0.30 to 0.37 using a two-tailed test and Pearson critical values at the 5% significance level, allowing for autocorrelation (table S1). The GISS-ER simulation also captures aspects of the GPCC observed decadal fluctuations over the 1950–2008 period (figure 3(a); r = 0.64) relating to the changes in sea surface temperature and volcanic eruptions. Plotting the multi-variate ENSO index (MEI; Wolter and Timlin 1998), it is apparent that much of the variability relates to decadal changes in ENSO index (r =− 0.57 for unsmoothed monthly-mean data between GPCP and MEI over 1979–2008). Thus some of the discrepancies between observed and CMIP5 historical simulations relate to changes in ENSO. Over tropical dry regions, differences between datasets become apparent with UEA displaying lower P anomalies than GPCC prior to the 1990s (figure 3(b)), explaining the contrasting trends between datasets during 1950–2010 period (table 2).
The tendency for wet regions to become wetter and dry regions drier during the 21st century appears robust both for P − E (which determines water availability) and P (which is now being monitored by satellite as well as ground-based rain gauges). Moreover, changes in sea surface temperature combined with realistic radiative forcing appear sufficient in accurately representing past decadal variability in wet region P over land since 1950. Although negative radiative forcing from volcanic and anthropogenic aerosols is thought to have driven decreases in precipitation over the period 1950–1970, decadal fluctuations in rainfall over tropical land appears to be primarily determined by decadal changes in ENSO index, in agreement with findings for the more recent period (Liu et al 2012).
5. Spatial structure of precipitation trends
As in previous studies, the observed and simulated precipitation trends over the wet and dry areas of the tropical oceans and tropical land are consistent in sign (Allan et al 2010, Chou et al 2013) but there are substantial uncertainties over regional scales (Meehl et al 2007, Rowell 2012, Chadwick et al 2013) which are more closely related to societal impacts. It is therefore valuable to consider the spatial manifestation of the wet and dry region trends in observations and simulations.
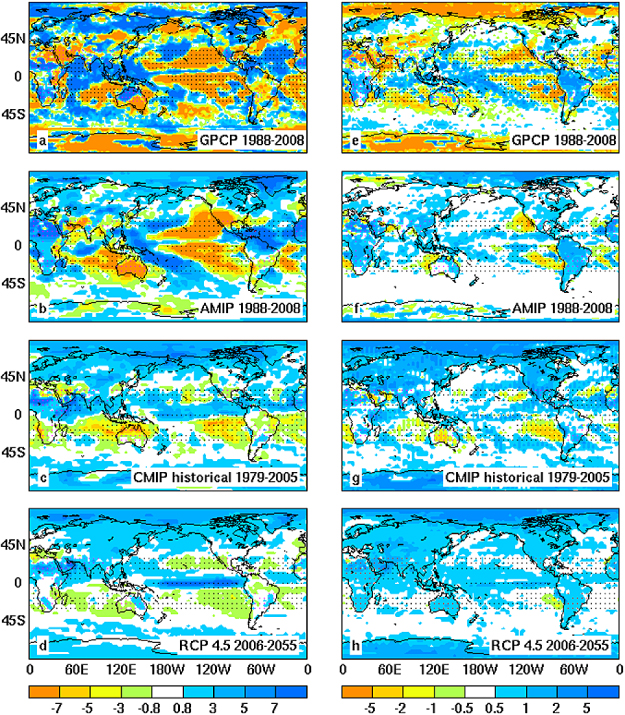
Global maps of precipitation trends (with climatologically dry tropical regions denoted by dots) from the monthly anomaly data are plotted in figures 4(a)–(d) for GPCP and AMIP5 simulations (both 1988–2008), CMIP5 historical simulations (1979–2005) and RCP 4.5 projections (2006–2055). Anomalies are calculated as a percentage departure from the mean 1988–2005 seasonal cycle for GPCP, AMIP5 and CMIP5 historical/RCP4.5 data sets. All calculations are carried out using the original model grid and the trends from all models are averaged over a 3° × 3° grid box to guarantee all models contribute to the average.
Figure 4. Spatial structure of precipitation anomaly trend (left column) and trend difference relating to changes in precipitation intensity distribution (right column) from ((a), (e)) GPCP, ((b), (f)) AMIP5, ((c), (g)) CMIP historical and ((d), (h)) RCP 4.5 data sets. The dry tropical oceans are marked with black dots and the dry tropical land with magenta dots (defined as the 70% lowest P grid points for the tropical oceans and the tropical land respectively using the 1988–2005 mean). Trends (%/decade) are calculated over 1988–2008 for GPCP and AMIP5 data sets, 1979–2005 for CMIP5 historical data and 2006–2055 for RCP 4.5 data set. Please note the non-linear colour bars.
Download figure:
Standard image High-resolution image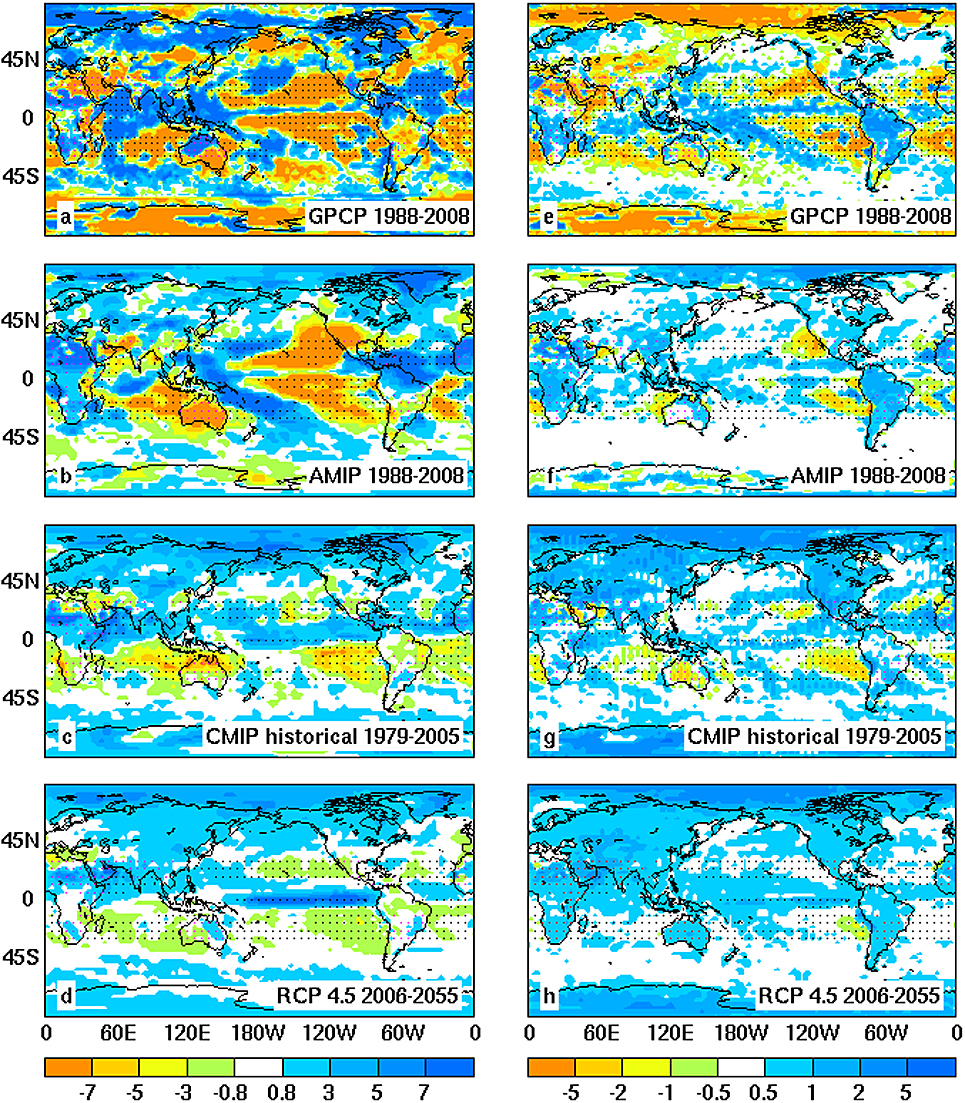
Observed and AMIP5 simulated trends are positive over the narrow ITCZ and SPCZ (south Pacific convergence zone) and negative over most of the subtropical oceans (figures 4(a) and (b)). There are positive trends over the north Atlantic subtropical gyre, most areas of Africa and the high-latitude land (north of 45° N). The enhancement of rainfall over the tropical west Pacific is dominated by an observed intensification of the tropical circulation (Sohn et al 2012, Merrifield 2011, L'Heureux et al 2013), thought to relate to natural variability and of opposite sign to the anticipated future changes in tropical circulation (Vecchi et al 2006, Chadwick et al 2013). GPCP trends are generally of larger magnitude and there are differences in sign over west Australia, the Sahara and the northern high-latitude Atlantic and Pacific (figures 4(a) and (b)). Observed trends over polar regions and the Sahara in figure 4(a) are unlikely to be reliable due to scarce observational data. Similar observed and simulated trends over many land regions reflects the good agreement between observed and AMIP5 simulated mean P variability over land (Liu et al 2012), particularly for wet regions (figure 3(a)).
The observed positive trend over the ITCZ is captured by the CMIP5 historical ensemble (figure 4(c)) but the asymmetry between trends in the northern and southern tropics is obvious. The CMIP5 fully coupled historical simulations generate their own ENSO cycles and the ITCZ belt is wider than those from observations and AMIP5 model simulations. Rainfall decreases in the south subtropical dry belt and increases in the south Asia monsoon regions in the coupled simulations. Details of the observed regional changes are not represented by the CMIP5 ensembles which are not designed to simulate the correct timing of natural variability, important in determining observed changes in precipitation patterns on this short timescale (Gu and Adler 2012). Projected precipitation trends over the period 2006–2055 (figure 4(d)) are similar in nature to the present day trends simulated by the historic CMIP5 experiment with drying of the subtropical high pressure regions, particularly in the Southern Hemisphere, and enhancement in the east Pacific ITCZ associated with weakening Walker circulation.
The precipitation change in figures 4(a)–(d) is affected by atmospheric circulation changes (e.g. Gu and Adler 2012, Yeh et al 2009) but also the thermodynamic enhancement in moisture transport with global warming (Held and Soden 2006, Zahn and Allan 2013). In order to investigate the contributions from these two processes, we recomputed precipitation trends assuming a fixed intensity distribution across bins of increasing P (e.g. the heaviest rainfall bin remains fixed as the mean heaviest rainfall bin for 1988–2005). The first bin is from 0 to 30% (considering zero precipitation over land can be as high as ∼15% grid points over certain months of GPCP data) and then increased by 1% percentiles. The precipitation intensity distribution (PI) is calculated by arranging monthly grid box P into ascending order. PI for each bin is calculated for global ocean and land separately. The second step is to replace the monthly precipitation with the fixed PI. The new precipitation trend (dPI/dt in %/decade) is then calculated (figure S2). This trend can be regarded as contributions from dynamical process and the difference between dP/dt and dPI/dt shown in figures 4(e)–(h) represents the contribution from the changing precipitation intensity distribution (e.g. Emori and Brown 2005).
The amplitude in figures 4(e)–(h) is smaller than that in figures 4(a)–(d), implying that regional precipitation trends are dominated by dynamic processes, consistent with Chadwick et al (2013). The contribution of changes in PI indicate an enhancement in P over wet regions and a decline in P in subtropical regions, consistent with enhanced moisture transport arguments (Held and Soden 2006). The PI changes are particularly strong for GPCP with precipitation increasing along the ITCZ, SPCZ, the north Pacific and the north Atlantic storm track regions in the past two decades. This effect is more pronounced when calculated for 1979–2008 (not shown) and may reflect the artificial effect of the changing observing system in altering PI over the oceans. The overall trend patterns are, however, similar to the AMIP5 and CMIP5 historical simulations for the tropics despite their smaller magnitude of change. The global increases in P dominates PI changes over most regions over the period 2006–2055. Comparing projected P trends (figure 4(d)) with the PI change contribution (figure 4(h)) indicates that dynamical changes appear to dominate regional trends, in agreement with other studies (Scheff and Frierson 2012, Chadwick et al 2013). When trends are recomputed separately for the wettest and driest month in each year only (e.g. Chou et al 2013) we find that the total trend (figure 4) is similar to the wettest month (figure S3) whereas the drying trend is more extensive when considering the driest month (figure S3). Nevertheless, the thermodynamic contribution appears to drive enhanced P − E patterns and seasonality of tropical rainfall in response to surface warming (Chou et al 2013).
6. Conclusions
Variability, trends and future projections of global and regional precipitation over the period 1850–2100 are analysed using a physically-based framework, combining satellite and gauge-based observations with coupled and atmosphere-only global climate simulations. We find that the wet tropical region becomes wetter (increased P and P − E) and the dry region drier (decreased P and P − E) as anticipated from increasing water vapour and enhanced moisture transports which are constrained by basic physics (Held and Soden 2006). This applies both to the recent past in models and observations, in agreement with previous analysis (Chou et al 2013, Allan et al 2010), and for climate projections over the 21st century, despite the counteracting effects of a reducing tropical circulation intensity, such as the weakening of the Walker circulation (Chadwick et al 2013, Allan 2012, Bony et al 2013).
Precipitation trends of −0.3%/decade are simulated over the 20th and 21st centuries for the driest land regions yet the spread in land precipitation responses is substantial indicating diversity in simulated land-surface feedbacks and circulation responses. Drying of dry tropical land regions over the 20th century appears robust in both models and observations. However, the observed decadal variability in precipitation over land is substantial and not captured by the ensemble mean of the coupled climate simulations. By analysing atmosphere-only climate simulations driven by observed sea surface temperatures and radiative forcings we find that this variability is represented and explained by changes in ENSO which exert a large influence over land rainfall as previously documented (Gu and Adler 2012, Liu et al 2012).
By considering changes in the intensity distribution of precipitation, we find that recent regional trends (e.g. at the continental and ocean-basin scale) are dominated by variability in the large-scale circulation. Unforced variability appears to dominate trends for the present day but land-surface feedbacks and secular changes in atmospheric circulation patterns become increasingly important into the future (Scheff and Frierson 2012). However, future increases in precipitation in already wet regions and declining precipitation in drier regimes appears robust indicating that enhancement in seasonality and wet and dry extremes (flooding and drought) may be anticipated over the coming century (Chou et al 2013, Allan et al 2013).
Acknowledgments
This work was undertaken as part of the PAGODA and PREPARE projects funded by the UK Natural Environmental Research Council under grants NE/I006672/1 and NE/G015708/1 and was supported by the National Centre for Earth Observations and the National Centre for Atmospheric Science. GPCP v2.2 data were extracted from http://precip.gsfc.nasa.gov/gpcp_v2.2_data.html; CMIP5 historical and AMIP5 data sets from the BADC (British Atmospheric Data Centre, http://badc.nerc.ac.uk/home/index.html) and the PCMDI (Program for Climate Model Diagnosis and Intercomparison, http://pcmdi3.llnl.gov/esgcet/home.htm). The Cooperative Institute for Climate and Satellites/Earth System Science Interdisciplinary Center precipitation reconstructions were retrieved from http://essic.umd.edu/cics/. The scientists involved in the generation of these data sets are sincerely acknowledged. We sincerely thank the two reviewers for their insightful comments which have helped to improve the paper.