
Abstract
The influences of agricultural irrigation on trends in surface air temperature from 1959 to 2006 over Xinjiang, Northwest China are evaluated using data from 90 meteorological stations. The 90 stations are located in landscapes with markedly different cultivated land uses. The increasing trends in daily average temperature (Ta), maximum temperature (Tmax), and minimum temperature (Tmin) for May–September (the main growing season) are negatively correlated with cultivated land proportions within 4 km of the meteorological stations, as indicated by year 2000 land use data. The correlations between the trends in Tmax and cultivated land proportions are the most significant. The trends in Ta, Tmax, and Tmin for May–September are expected to decrease by −0.018, −0.014, and −0.016 ° C per decade, respectively, along with a 10% increase in cultivated land proportion. As irrigated cultivated land occupies over 90% of total cultivated land, the dependence of temperature trends on cultivated area is attributed to irrigation. The cooling effects on stations with cultivated land proportion larger than 50% are compared to temperature trends in a reference group with cultivated land proportion smaller than 10%. The irrigation expansion from 1959 to 2006 over Xinjiang is found to be associated with cooling of May–September Ta, Tmax, and Tmin by around −0.15 ° C to −0.10 ° C/decade in the station group with extensive irrigation. Short periods of rapid irrigation expansion co-occurred with the significant cooling of the May–September temperature.
Export citation and abstract BibTeX RIS

Content from this work may be used under the terms of the Creative Commons Attribution 3.0 licence. Any further distribution of this work must maintain attribution to the author(s) and the title of the work, journal citation and DOI.
1. Introduction
The rapid expansion of irrigation during the 20th century has significantly altered the hydrological cycle and energy budget at the land surface of many regions. At the regional or local scale, interactions between irrigated land surfaces and the atmosphere occur as irrigation proceeds, and climate characteristics are considerably affected (Boucher et al 2004, Lobell and Bonfils 2008, Lobell et al 2009, Ferguson and Maxwell 2012, Kueppers and Snyder 2012). The reduction in surface air temperature through shifts in the Bowen ratio from sensible to latent heating is an important direct climatic effect of irrigation. In certain regions, the magnitude of temperature reduction may be comparable to or even exceed the effects of greenhouse gas emissions (Kueppers et al 2007, Sacks et al 2009, Puma and Cook 2010).
The irrigation cooling effect has been widely demonstrated in numerous modeling (Lobell et al 2006, 2009, Cook et al 2011) or observational (Bonfils and Lobell 2007, Lobell and Bonfils 2008, Lee et al 2009, Zhu et al 2012) studies. Observational studies typically rely on pairwise comparisons of temperature trends between irrigated and non-irrigated locations (Lobell and Bonfils 2008, Zhu et al 2012). The maximum temperature was 2 ° C lower over irrigated lands than over adjacent non-irrigated lands on hot, dry days in the southern Great Plains (Barnston and Schickedanz 1984). The trends in maximum temperature significantly decrease in meteorological stations located in irrigated sites in Nebraska relative to non-irrigated dryland sites (Mahmood et al 2004). The temperature difference between highly and lightly irrigated sites is significantly correlated with the irrigation area over the past 53 years in Jilin, Northeast China (Zhu et al 2012). In California, the trends in maximum temperature in regions with different irrigation levels are negatively correlated with increasing irrigation levels (Bonfils and Lobell 2007). The effects on minimum temperature and diurnal temperature ranges relative to the maximum temperature are less pronounced (Christy et al 2006, Bonfils and Lobell 2007, Zhu et al 2012).
Nearly 100% of cultivated lands in arid regions are intensively irrigated because of low precipitation, thus bringing significant influences on local climates (Wen and Jin 2012). The expansion of irrigation is identified as a first-order climate influence (Kueppers et al 2008). The Xinjiang province of Northwest China is characterized by a very arid climate, with average annual precipitation of less than 200 mm in most parts of the area. The oasis plains along the middle and lower reaches of the inland rivers are dotted with irrigated cultivated lands. Irrigated cultivated lands cover only 5% of the land surface (Chu et al 2005) but support 95% of the population in this area. Since 1949, irrigated areas have expanded to nearly four times, significantly increasing water consumption (Zhong et al 2009). During the same period, climate characteristics have dramatically changed (Wu et al 2010). The spatial variations and temporal changes of potential evaporation are influenced by the irrigation-induced changes in actual evapotranspiration (Liu et al 2009, Han et al 2011). A significant rising trend in air temperature has been exhibited in the past 50 years. The increasing effects of air temperature on potential evaporation are weaker in stations surrounded by large proportions of cultivated lands (Han and Hu 2012, Han et al 2012). Increasing temperature trends are more obvious in stations with higher elevation than in stations with lower elevation (Li et al 2011). Cultivated lands are known to be located in oases with lower elevation, and irrigation is rare in mountainous areas with high elevation. Temperature increase is relatively low during spring and summer (Zhang et al 2011, Li et al 2012a, 2012b), the period when perennial irrigation is conducted. The findings of the aforementioned studies give rise to the question of whether a relationship exists between temperature trends and irrigated cultivated land uses. The present study aims to use observational data as the bases in quantifying the effect of irrigation on temperature trends in Xinjiang.
2. Study area, data, and methods
2.1. Study area and data
Located in the Eurasian hinterland, Xinjiang province extends between 73°40'E–96°23'E and 34°25'N–49°10'N, covering an area of 1 600 000 km2 (figure 1). Two major basins (the northern Junggar Basin and the southern Tarim Basin) are located between three mountain ranges from north to south (the Altai Mountains, Tian Shan, and the Kunlun Mountains). Land uses and human activities are distinctly different among regions of the study area. Extremely arid desert regions with no irrigation occupy nearly 60% of the area. The mountainous regions are relatively wet. The land covers are mainly natural vegetation and bare land with little irrigation. Rivers originating from mountainous regions flow into the alluvial plains and gradually thin out after reaching the edge of the deserts. Along these streams are oases, wherein almost all the cultivated lands are distributed.
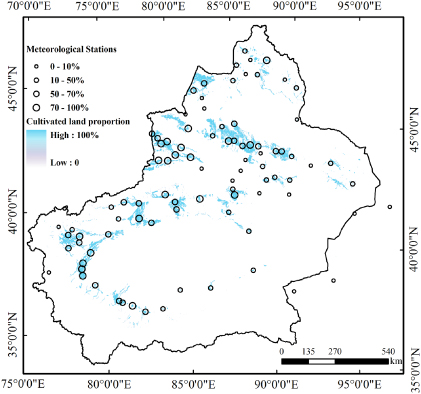
Figure 1. Study area with meteorological stations and the area proportions of cultivated lands in each 1 km grid. The circles represent the stations and the size of the circle represents the cultivated land proportion within a 4 km radius of each station.
Download figure:
Standard image High-resolution imageThe climate in Xinjiang is typical of inner-continental land masses. As precipitation is low, agriculture is highly characterized as 'desert oasis, irrigation agriculture' (Xinjiang Uygur Autonomous Water Conservancy Office, 1993) (Zhong et al 2009). Based on census data, cultivated land area over Xinjiang increased from 2.58 × 10⁶ ha in 1959 to 3.64 × 10⁶ ha in 2006, and irrigated cultivated land areas increased from 2.37 × 10⁶ ha to 3.46 × 10⁶ ha over the same period (figure 2) (Statistics Bureau of Xinjiang 2005, 2006, 2007). The staple crops are cotton, wheat, and maize, all of which rely heavily on seasonal irrigation. River water withdrawal is the primary source of irrigation. Surface irrigation is still the most important method, accounting for over 80% of the irrigation area (Zhong et al 2009). Irrigation is mainly carried out during the main growing season, which lasts from May to September. Irrigation is also carried out during winter and early spring to achieve salt leaching and soil moisture conservation. Nevertheless, water is always stored in the soil for consumption in the next growing season because of the low water requirement. At present, average irrigation water uses per unit area are around 11 300 m3 ha−1 and 14 300 m3 ha−1 in North and South Xinjiang, respectively (Deng 2010).
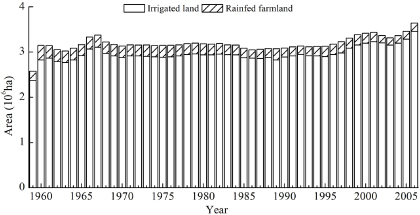
Figure 2. Cultivated land (including irrigated land and rainfed farmland) area in Xinjiang. Data from 1959 to 2004 were documented from the Statistics Compilation of Xinjiang from 1955 to 2005 (Statistics Bureau of Xinjiang 2005), and data of 2005 and 2006 were documented from the statistical yearbook (Statistics Bureau of Xinjiang 2006, 2007).
Download figure:
Standard image High-resolution imageSpatially referenced land use data were provided by the Data Center for Resources and Environmental Sciences of the Chinese Academy of Sciences. The land uses in year 2000 at a scale of 1:1 × 10⁵ and classified into 6 first levels and 25 second levels of land use categories are based on the Landsat Thematic Mapper (TM) data. The main data sources in China are 508 scenes captured as Landsat TM digital images in 1999 and 2000. Data from China to Brazil Earth Resources Satellite 1 were also used in acquiring land use information. Readers should refer to Liu et al (2003) for details of data. The proportions occupied by cultivated, forest, residential, industrial lands, and roads in each 1 km grid were calculated based on land uses in year 2000 (http://www.geodata.cn). The spatial distributions of the area proportions of cultivated land for each 1 km grid in the study area are shown in figure 1.
Daily surface air temperature data from 1959 to 2006 covering 109 stations across Xinjiang province were provided and quality tested by the National Meteorological Information Center of the China Meteorological Administration. The data were published in the data sharing system for meteorological research (http://cdc.cma.gov.cn). The data included daily average temperature (Ta), daytime maximum temperature (Tmax), nighttime minimum temperature (Tmin), and diurnal temperature range (DTR = Tmax − Tmin), all of which satisfy the standards of the World Meteorological Organization (China Meteorological Administration 2003). After the data were filtered for missing observations, nine stations with time series of less than 30 years were excluded. Average cultivated land and urban land ratios within a certain radius of each station were regarded as two indices reflecting the effects of agricultural and urbanization activities, respectively (Han et al 2012). Ten stations with urban land proportion larger than 25% within a 4 km radius were excluded to eliminate the influence of urban land uses. In the end, 90 stations were included in the analysis (figure 1).
The 90 stations are located in landscapes with markedly different cultivated land uses. In this study, the cultivated land proportion within a 4 km radius of each station (C), as indicated by year 2000 land use data, was used as the index to reflect cultivated land use level. The cultivated land proportions of the 90 stations range from 0% to 90%. Among the 90 stations, 22 are characterized by C < 10% (C = 0% for 17 of these stations), 23 by 50% < C < 70%, and 21 by 70% < C < 90%. The stations with C < 10% are located in mountainous regions or desert regions with little irrigation. The stations with intensive cultivated land uses (C > 50%) are located in oases with abundant water supply for irrigation. The spatial distributions of the stations are shown in figure 1. The characteristics of the four groups are listed in table 1.
Table 1. General conditions of the stations with different cultivated land proportions.
| Groups with different cultivated land proportions | |||||
|---|---|---|---|---|---|
| 0–10% | 10–50% | 50–70% | 70–90% | ||
| Number of stations | 22 | 24 | 23 | 21 | |
| Elevation (m) | Average | 1698 | 944 | 956 | 1005 |
| max | 3539 | 1985 | 1422 | 1851 | |
| min | 35 | 2 | 346 | 320 | |
| Average cultivated land proportion | 1% | 30% | 60% | 79% | |
| Average temperature (° C) | Tave | 4.31 | 8.27 | 9.59 | 8.76 |
| Tmax | 11.12 | 15.68 | 16.71 | 16.00 | |
| Tmin | −1.76 | 1.64 | 3.29 | 2.45 | |
| DTR | 12.88 | 14.03 | 13.42 | 13.54 | |
2.2. Methods
Non-parametric Mann–Kendall tests were used to identify temperature trends (Jhajharia et al 2009, 2011). A trend-free, pre-whitening method proposed by Yue et al (2002) was used to limit the effect of serial correlations on the Mann–Kendall test. The magnitudes of the trends in the surface air temperature are given by

where Xi and Xj are the time-series surface air temperature data of the ith and jth year, respectively, and β is the slope of each station. The correlations between temperature trends and cultivated land proportions were evaluated using linear regression. The statistical significance of the correlation coefficient was evaluated using t-tests.
3. Results
3.1. Temperature trends and their dependence on cultivated land use levels
The trends in annual Ta,Tmax,Tmin, and DTR from 1959 to 2006 were evaluated. The average trend slopes of Ta,Tmax,Tmin, and DTR for the 90 stations are 0.33, 0.23, 0.49, and −0.25 °C/decade, respectively. The trends in annual Ta,Tmax,Tmin, and DTR are significant at the 95% confidence level for 85, 64, 81, and 76 of all the 90 stations, respectively. The trends in seasonal Ta,Tmax,Tmin, and DTR from 1959 to 2006 were also evaluated, from May to September (the main growing season of crops), and from October to April of the following year. Ta,Tmax,Tmin, and DTR across days of the seasons of each year were computed first, and then temporal trends were calculated. From May to September, the trends in Ta,Tmax,Tmin, and DTR are weaker, at 0.22, 0.17, 0.39, and −0.22 °C/decade, respectively. The spatial distributions of the trend slopes for the annual and May–September Ta,Tmax,Tmin, and DTR for the 90 stations are shown in figure 3. The trends in Ta,Tmax, and Tmin, show some local characteristics, especially for May–September.

Figure 3. Trend slope of annual and May–September (a) Ta; (b) Tmax; (c) Tmin and (d) DTR from 1959 to 2006.
Download figure:
Standard image High-resolution imageThe cultivated land proportion within a certain radius of each meteorological station was used to evaluate the influence of cultivated land uses. Correlations between temperature trends (Ta,Tmax,Tmin, and DTR) and cultivated land proportions within a radius of 1–10, 15, and 30 km of each station were evaluated using a linear regression method. The trends in May–September Ta are negatively correlated with cultivated land proportion, and the correlation is highly significant (p < 0.01, sample= 90) at 4–7 km radii. The trends in May–September Tmax are negatively correlated with cultivated land proportion, and the correlation is highly significant (p < 0.01, sample= 90) at radii less than 9 km. The trends in Tmin show weak negative correlation with cultivated land proportion, and the correlation is highly significant (p < 0.1, sample= 90) at 3–9 km radii. No correlation exists between the trends in DTR and the cultivated land proportion. On an annual basis, the trends in Ta,Tmax, and Tmin are weakly correlated with cultivated land proportion, whereas for October–April, no correlation is found. The parameters with certain radii are listed in table 2.
Table 2. Correlation coefficients for trends in Ta,Tmax,Tmin and DTR with cultivated land proportion within a specific radius of each station.
| Radii | Annual | May–September | October–April | |||||||||
|---|---|---|---|---|---|---|---|---|---|---|---|---|
| Tmean | Tmax | Tmin | DTR | Ta | Tmax | Tmin | DTR | Tmean | Tmax | Tmin | DTR | |
| 1 | −0.12 | −0.20 | −0.08 | 0.00 | −0.25a | −0.35b | −0.14 | −0.01 | −0.05 | −0.10 | −0.06 | −0.01 |
| 4 | −0.12 | −0.12 | −0.10 | 0.05 | −0.31b | −0.33b | −0.18a | 0.03 | −0.02 | 0.00 | −0.06 | 0.04 |
| 7 | −0.11 | −0.11 | −0.09 | 0.05 | −0.31b | −0.34b | −0.18a | 0.03 | 0.01 | 0.02 | −0.05 | 0.04 |
| 10 | −0.08 | −0.10 | −0.08 | 0.05 | −0.28b | −0.32b | −0.17 | 0.03 | 0.04 | 0.03 | −0.03 | 0.03 |
| 15 | −0.07 | −0.09 | −0.09 | 0.06 | −0.27a | −0.31b | −0.19a | 0.05 | 0.05 | 0.03 | −0.03 | 0.04 |
| 30 | −0.04 | −0.02 | −0.10 | 0.10 | −0.23a | −0.25a | −0.20a | 0.10 | 0.08 | 0.10 | −0.03 | 0.07 |
aSignificant at the 90% confidence level. bSignificant at the 99% confidence level.
In this study, the cultivated land proportion within a 4 km radius of each station was used to evaluate the dependence of surface temperature trends on cultivated land use levels. The trends in May–September Ta,Tmax, and Tmin for all 90 stations are plotted against cultivated land proportions in figure 4. As no correlation exists between the trends in DTR and cultivated land proportion, no plot for the two factors is shown. The trend slopes of Ta,Tmax, and Tmin decrease with increasing cultivated land proportion. The trends in Ta,Tmax, and Tmin are expected to decrease by 0.018, 0.014, and 0.016 °C per decade respectively, with a 10% increase in cultivated land proportion. The correlation between the Tmax trends and cultivated land proportions is the most significant.

Figure 4. Trends in May–September (a) Ta; (b) Tmax and (c) Tmin against the cultivated land proportion (within 4 km radius) of each station and their line trends (dashed lines, *y = ax + b,y is the trend in surface air temperature, x is the cultivated land proportions centered at each station; ∗∗R2 is the regression coefficient).
Download figure:
Standard image High-resolution image3.2. Cooling effects of agricultural irrigation on stations with high levels of cultivated land use
The temperature trends of meteorological stations in Xinjiang with high levels of cultivated land use significantly depend on cultivated land use levels. Cooling effects on the 44 stations with C > 50% were evaluated. No significant statistical correlation exists between temperature trends and cultivated land proportions as well as urban land proportions of the 22 stations with C < 10%. The urbanization and agricultural influence on the temperature trends of these 22 stations is statistically negligible. Therefore, these 22 stations are used as reference. The average values of the temperature trend slopes of all stations with C > 50% and of the reference station group are compared in table 3. The average values of May–September Ta,Tmax, and Tmin trends of the station group with C > 50% are 0.183, 0.136, and 0.342 °C per decade respectively. These values are considerably smaller than those of the reference station group (0.310, 0.239, and 0.452 °C per decade, respectively). However, no obvious difference can be observed in the station-averaged October–April Ta,Tmax, and Tmin trends between the two groups.
Table 3. Comparison of trends in May–September Ta,Tmax,Tmin and DTR (°C per decade) of station groups with cultivated land proportions larger than 50% and smaller than 10%.
| aStation-averaged trend slope of the group | bTrend slope of station-averaged temperature time series | |||||||
|---|---|---|---|---|---|---|---|---|
| Ta | Tmax | Tmin | DTR | Ta | Tmax | Tmin | DTR | |
| Group C < 10% | 0.310 | 0.239 | 0.452 | −0.222 | 0.334 | 0.261 | 0.486 | −0.225 |
| Group C > 50% | 0.183 | 0.136 | 0.342 | −0.208 | 0.185 | 0.142 | 0.347 | −0.203 |
| cCooling effect | −0.127 | −0.103 | −0.110 | 0.014 | −0.148 | −0.119 | −0.138 | 0.022 |
aArithmetic mean of the trend slopes of all stations in the group. bCalculating the station-averaged temperature time series from 1959 to 2006 first, and then calculating the trend slope of the time series. cComputed by subtracting value of station group with C < 10% from that of group with C > 50%.
Similar to the urban minus rural method used in detecting urban heat island effects (Yang et al 2011), the cooling effects on the station group with C > 50% were determined by evaluating the differences in temperature trends between the station group with C > 50% and the reference station group with C < 10%. The differences in average values of the trend slopes of Ta,Tmax,Tmin, and DTR are listed in table 3. The irrigation expansion from 1959 to 2006 is associated with the cooling of May–September Ta,Tmax, and Tmin by about −0.127, −0.103, and −0.11 °C per decade, respectively, for the station group with C > 50%.
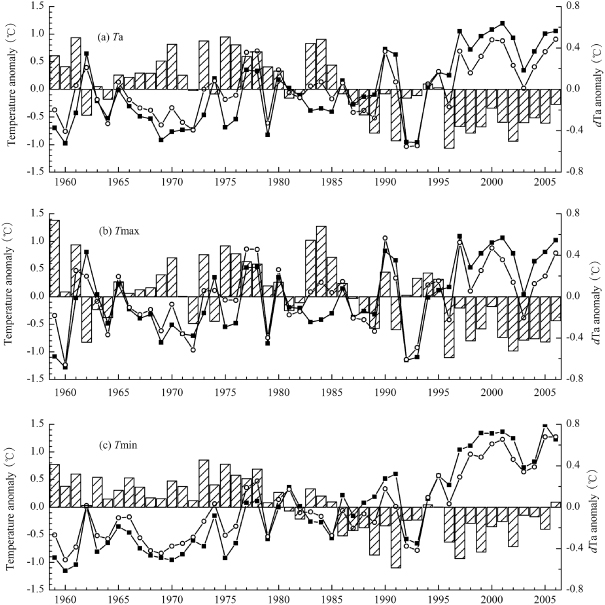
To evaluate the variations in May–September temperatures from 1959 to 2006, the station-averaged May–September temperature anomalies of the group with C > 50% and the reference station group were calculated; these values are compared in figure 5. Variations in the station-averaged Ta,Tmax, and Tmin for the May–September of the two groups are similar. A slight increase in Ta,Tmax, and Tmin occurred from 1959 to the early 1990s, followed by a more obvious increase in 2006; however, a weaker increase was shown in the station-averaged Ta,Tmax, and Tmin for the May–September of the station group with intensive irrigation. From 1959 to 2006, the trends in the station-averaged Ta,Tmax,Tmin for the May–September time series of the station group with C > 50% are 0.185, 0.142 and 0.347 °C per decade, respectively. These values are considerably smaller than those of the reference station group (table 3). The differences in the trend slopes of the station-averaged time series among the two groups are similar to those indicated by comparing the station-averaged trends. According to the differences, the cooling effects on May–September Ta,Tmax, and Tmin are −0.148, −0.119, and −0.138 °C per decade, respectively.
Figure 5. Time series of station-averaged May–September (a) Ta; (b) Tmax and (c) Tmin anomalies of the station group with C > 50% (solid lines with circles) and C < 10% (solid lines with squares) and temperature differences anomaly between the two groups (bars) (Group C > 50% minus Group C < 10%).
Download figure:
Standard image High-resolution image
Differences in temperature for the May–September time series were computed by subtracting the station-averaged Ta,Tmax, and Tmin of the reference group from those of the station group with C > 50%. The use of differences is aimed at eliminating the variability common to both time series while attempting to isolate the impact of irrigation from that of large-scale forcing (Bonfils and Lobell 2007). The anomalies in temperature differences for the May–September time series are shown in figure 5. The changes in temperature differences of Ta,Tmax, and Tmin have corresponded with irrigation since 1959. The irrigated areas rapidly expanded from 1959 to the mid-1960s and stabilized up to the early 1990s. Then, the irrigated areas rapidly increased until 2006. In periods characterized by rapid irrigation expansion, cooling of the May–September temperature is highly significant (i.e., the difference anomalies are negative).
4. Discussion and conclusions
From 1959 to 2006, the trends in the May–September Ta,Tmax, and Tmin of 90 stations in Xinjiang are statistically negatively correlated with cultivated land proportions within a radius of 4 km of each station. The trends in stations surrounded by large areas of cultivated land are considerably smaller than those in reference stations surrounded by little cultivated land. May–September Ta,Tmax, and Tmin trends are expected to decrease by −0.018, −0.014, and −0.016 °C per decade, along with a 10% increase in cultivated land proportion. Irrigated cultivated land occupied over 90% of total cultivated land in Xinjiang from 1959 to 2006; in recent years, this percentage has reached over 95%. The spatial patterns of cultivated land areas (figure 1) approximate the spatial distribution of irrigation. The dependence of temperature trends on cultivated land uses can be attributed to irrigation. Cultivated land proportion within a specific radius of a meteorological station is an index that effectively reflects the effects of agricultural irrigation in Xinjiang. The stations with larger cultivated land proportions are more significantly affected by intensive irrigation compared with their counterparts.
In this study, the cooling effects of agricultural irrigation were detected according to pairwise comparisons of temperature trends between stations with larger and smaller cultivated land proportion. Among the 44 stations with C > 50%, 31 are extremely arid, with mean annual precipitation of less than 200 mm; only 2 stations have mean annual precipitation of over 400 mm (but less than 510 mm). As precipitation is low, the cultivated land surrounding these stations relies heavily on seasonal irrigation. For stations with C > 50%, the irrigation expansion from 1959 to 2006 is associated with the cooling of May–September Tmax by around −0.11 °C per decade. If the trends of the reference station group are referred to as natural climate variability and the effects of increasing greenhouse gas emissions (Li et al 2012a, 2012b), then the cooling effects on Tmax approximately approach 45% of the total changes. Bonfils and Lobell (2007) estimated a cooling of June–August Tmax by −0.14 to 0.25 °C per decade from 1915 to 1979 in regions of the Central Valley where the current irrigation level exceeds 50%. The effects were also estimated at −0.129, −0.077, and −0.102 °C per decade from 1950 to 2000 in Thailand, the Aral Sea basin, and Nebraska. The cooling effect on Tmax in Xinjiang agrees with that reported by Bonfils and Lobell (2007).
For stations with C > 50%, the irrigation cooling of May–September Tmin is around −0.12 °C per decade. The cooling effect on Tmin is also significant compared with Tmax, which disagrees with other studies. In Jilin Province, Northeast China, the cooling effect on Tmin is almost half of that on Tmax (Zhu et al 2012). In the Central Valley, even an increasing effect in Tmin was found in irrigation regions (Christy et al 2006, Bonfils and Lobell 2007). The irrigation cooling of May–September Ta is around −0.13 °C per decade, while there is no correlation between trends in DTR and irrigation. Our results on Ta and DTR in Xinjiang likewise disagree with other regions. Given the extremely arid climate over Xinjiang, irrigation induces local circulation between the oasis and the desert (Chu et al 2005), which possibly explains the significant cooling effect on Tmin; however, further study is needed.
The variations in cooling effects were evaluated according to changes in the irrigation area. The results indicate that May–September temperature differences between the station group with C > 50% and the reference station group occurred concomitantly with increasing irrigation. Periods characterized by rapid irrigation expansion co-occurred with large cooling effects on Ta,Tmax, and Tmin. The results also suggest that irrigation development is the main reason for the net cooling effect (Bonfils and Lobell 2007).
As data on land use changes are lacking, only the land use data for year 2000 were used. The scattered points illustrated in figure 4 are possibly a result of using only current cultivated land proportions. Stations with similar cultivated land proportions may differ in spatial distributions of cultivated lands, types of crops grown, or irrigation methods used (Lobell and Bonfils 2008). These factors were not considered in the present study. More observations and temporal information are needed for a further understanding of the cooling effect of agricultural irrigation in Xinjiang.
Acknowledgments
This research was partially sponsored by the National Science and Technology Support Program Project (2013BAC10B01, 2012BAC19B03) and the National Natural Science Foundation of China (50909097). This research was also partially supported by Open Research Fund Program of State key Laboratory of Hydroscience and Engineering (sklhse-2013-A-02). Land use data were provided by the Data Center for RESDC. The authors also thank the anonymous reviewers for their useful comments.