
Abstract
Soil moisture induced droughts are expected to become more frequent under future global climate change. Precipitation has been previously assumed to be mainly responsible for variability in summer soil moisture. However, little is known about the impacts of precipitation frequency on summer soil moisture, either interannually or spatially. To better understand the temporal and spatial drivers of summer drought, 415 site yr measurements observed at 75 flux sites world wide were used to analyze the temporal and spatial relationships between summer soil water content (SWC) and the precipitation frequencies at various temporal scales, i.e., from half-hourly, 3, 6, 12 and 24 h measurements. Summer precipitation was found to be an indicator of interannual SWC variability with r of 0.49 (p < 0.001) for the overall dataset. However, interannual variability in summer SWC was also significantly correlated with the five precipitation frequencies and the sub-daily precipitation frequencies seemed to explain the interannual SWC variability better than the total of precipitation. Spatially, all these precipitation frequencies were better indicators of summer SWC than precipitation totals, but these better performances were only observed in non-forest ecosystems. Our results demonstrate that precipitation frequency may play an important role in regulating both interannual and spatial variations of summer SWC, which has probably been overlooked or underestimated. However, the spatial interpretation should carefully consider other factors, such as the plant functional types and soil characteristics of diverse ecoregions.
Export citation and abstract BibTeX RIS
1. Introduction
The frequency and intensity of extreme weather and climate events have shown profound impacts on both human society and the natural environment (Easterling et al 2000). Summer drought is one of the extreme climate issues that have tremendous impacts on ecosystem processes from both local to regional and global scales (Phillips et al 2009, Fensharm et al 2009, Ledger et al 2011). For example, a drought was reported to reduce 30% of gross primary production (GPP) and led to a net carbon source over the whole of Europe in 2003 (Ciais et al 2005). Global reduction of terrestrial net primary production (NPP) due to severe drought has also been reported, although the reasons and magnitudes are still unresolved (Zhao and Running 2010, Samanta et al 2011).
While the importance of summer drought has been recognized, it is still listed as one of the least understood issues in global environmental change (Breshears et al 2005, Piao et al 2009, Sowerby et al 2008, Mishra and Singh 2010, Ledger et al 2011). Soil water content (SWC, %) is an important indicator of drought (Peñuelas et al 2007, Piao et al 2009), and, therefore, efforts have been made to understand the relationships between SWC and climate change factors, including temperature (Li et al 2007), radiation (Ramanathan et al 2001) and precipitation (Knapp et al 2008). Among these factors, SWC is assumed to be mainly regulated by precipitation because of the role of SWC as the direct link between precipitation and ecological processes (Weltzin et al 2003, Pan et al 2003) as well as evidence of precipitation being affected by SWC (Eltahir 1998, Koster et al 2004).
Rather than precipitation quantity, recent results have shown that the pattern of precipitation may have more important impacts on ecosystem processes (Knapp et al 2002, Fang et al 2005). In particular, precipitation regimes are predicted to become more variable with more extreme rainfall events punctuated by longer intervening dry periods (Heisler-White et al 2008). These temporal changes in precipitation pattern would greatly affect the soil moisture but our ability to interpret such changes on ecosystem processes and the associated responses of soil moisture is still limited. This indicates an urgent need to evaluate the relationship between SWC and the frequency of precipitation, which in turn would be helpful to assess future droughts and their impacts.
Due to the lack of long-term observation data, the relationship between SWC and precipitation frequency is not well understood, with limited sites and plant functional types previously reported (Katul et al 2007, Piao et al 2009). These uncertainties associated with both interannual and spatial patterns between SWC and precipitation frequency prevent a full evaluation of feedbacks between ecosystem processes and climate change. With long-term (415 site yr) flux measurements world wide (75 sites), here we provide an investigation on the temporal–spatial relationships between summer SWC and various precipitation frequencies derived from datasets of different temporal scales. The temporal pattern provides an opportunity to identify the response of interannual summer drought to precipitation frequency regimes while its spatial pattern will give insights into this response across regions and plant functional types. Such analysis will be useful for comprehending feedbacks between ecosystem processes and future climate change.
2. Materials and methods
2.1. Study sites
A global search for flux data indicated that the availability of SWC data mainly restricts our analysis. As a result, we identified 75 flux sites which provided 415 site yr of data to support the temporal and spatial analyses between summer SWC and precipitation frequencies (figure 1). The data for each site employed in this study were downloaded from the following flux networks: AmeriFlux ( http://public.ornl.gov/ameriflux/dataproducts.shtml), Fluxnet-Canada Data Information System ( www.fluxnet-canada.ca), European Eddy Fluxes databases cluster ( www.europe-fluxdata.eu/newtcdc2/p_home.aspx), CarboAfrica Database ( www.europe-fluxdata.eu/newtcdc2/CarboAfrica_home.aspx), AsiaFlux ( http://asiaflux.net/) as well as the Public FLUXNET Dataset Information ( www.fluxdata.org/DataInfo/default.aspx). The rules for site selection were mainly regulated by data availability, data quality and data time duration. These sites covered diverse plant functional types which can be classified into three groups, including 30 non-forest sites (NF), 18 deciduous forest sites (DF) and 27 evergreen forest sites (EF). Detailed descriptions of each site and their regional climates are shown in supplementary table 1 (available at stacks.iop.org/ERL/7/024011/mmedia).
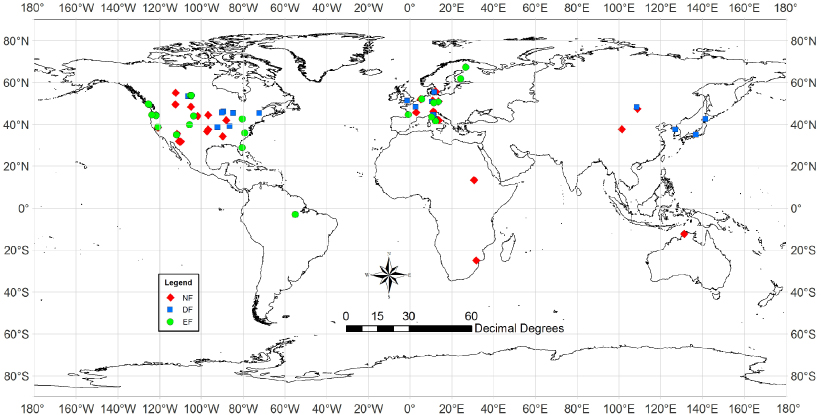
Figure 1. The spatial distribution of the 75 sites in this study. The NF ( ), DF (
 ) and EF (
 ) represent non-forests, deciduous forests and evergreen forests, respectively.
Download figure:
Standard image2.2. Precipitation and SWC data
The available data for the months from June to August in each year were applied to calculate the summer precipitation frequency and soil water content (SWC, %). However, the months from December to February were used for sites in the Southern Hemisphere. With our analysis limited to the summer months, we had more opportunity to acquire good quality precipitation data without large gaps. For both precipitation frequency and SWC, summers with amounts of missing data (either precipitation frequency or SWC) larger than 10% (∼440 half-hourly readings for the whole period of the summer months) were excluded to guarantee the quality of the data.
Precipitation data for all sites were obtained from the half-hourly meteorological measurements collected by on-site tipping bucket sensors, which transmit the registered data to an indoor console (or digital transmitter unit). The half-hourly measurements were used to generate datasets of various temporal resolutions, including 0.5, 3, 6, 12 and 24 h (daily) products. Then, five precipitation frequencies were calculated (hereafter referred as 0.5, 3, 6, 12 and 24 h-PF), and each was determined as the number of time periods with precipitation recorded on the sensor from the respective observations (n = number of times with recorded precipitation). For the half-hourly precipitation data, a minimum threshold for precipitation was included (0.1 mm/half-hour), considering the accuracy of the sensor as well as avoiding very light rainfalls being counted as precipitation events.
Site-level SWC was consistently measured by time-domain reflectometry (TDR) type probes (30 min intervals) at a general depth of around 0–30 cm, which slightly differed for individual sites. We also averaged the multiple SWC measurements at different depths within 0–30 cm if these multi-depth data were available at a site. The mean values for the summer months were calculated to represent the summer SWC. Statistical results for summer precipitation and SWC for each site are shown in supplementary table 2 (available at stacks.iop.org/ERL/7/024011/mmedia).
2.3. Radiation, temperature and latent heat data
To support the analysis between precipitation frequency and SWC, we also collected several auxiliary parameters, including the photosynthetic active radiation (PAR) and air temperature (Ta). We further selected seven representative sites (CA-GRA, CA-OAS, CA-OBS, CA-OJP, CA-DF49, CA-DF88 and CA-DF00) in the Fluxnet-Canada network to explore the relationship between precipitation frequency and latent heat (LH), which is a main variable controlling evapotranspiration (ET). The selection of these seven representative sites was based on the considerations that (1) they covered all three plant functional types (i.e., NF, DF and EF) in our analysis, (2) they had relatively long time of observation records (mean time of 9 yr), (3) they had good quality of data, (4) they covered the same forest with different ages (CA-DF49, CA-DF88 and CA-DF00 were harvested in 1949, 1988 and 2000, respectively), and (5) they covered forests of contrasting species (deciduous versus evergreen) at different sites from the same latitude. The radiation, temperature and latent heat were measured half-hourly using sensors mounted on the towers and the mean values for the summer months were calculated to compare with the precipitation frequencies.
2.4. Statistical analyses
Both the temporal (within sites) and the spatial (across sites) relationships between summer SWC and precipitation frequency were analyzed in this study. The pairwise Pearson coefficient (r) and p-value were used to evaluate these correlations. The temporal patterns between summer SWC and precipitation frequency were analyzed based on the year-to-year anomalies of both variables considering their diverse dynamic ranges across sites and regions:

where Ai is the anomaly of a variable, xi and xi−1 are the observations in years i and i − 1, respectively.
These correlations were also separated by plant functional types, i.e., for all NF sites (113 site yr), DF sites (78 site yr) and EF sites (149 site yr). To analyze the spatial pattern, the mean values as well as the standard deviations of the summer SWC and precipitation frequency were calculated for each site (i.e., 30 NF, 18 DF and 27 EF sites), both of which were then used to test the relationships between the summer SWC and precipitation frequencies spatially.
3. Results and discussion
Relationships between the interannual variability of summer SWC and the precipitation and its frequencies are shown in figure~2. Precipitation showed a positive impact on summer SWC with a Pearson coefficient (r) of 0.49 (p < 0.001) for the overall dataset, and the coefficients were 0.51 (p < 0.001), 0.51 (p < 0.001) and 0.47 (p < 0.001) for the datasets classified as NF, DF and EF, respectively. These results suggest that increase of summer precipitation favors soil moisture and mitigates summer drought. When the precipitation frequencies were explored to explain interannual variability in summer SWC, we observed improved results for all the sub-daily precipitation frequencies with the r ranging from 0.61 (p < 0.001) for 0.5 h-PF to 0.51 (p < 0.001) for 12 h-PF. Generally, these improvements were consistent, irrespective of differences in plant functional types and ecoregions. In contrast, an r equal to 0.42 (p < 0.001) was acquired between the summer SWC and the 24 h-PF, implying the limited potential of daily precipitation frequency in explaining interannual SWC variability. Our results expand the previously reported dependence between storm frequency and summer soil moisture at stand level, suggesting that this relationship is robust for most vegetated areas globally. These observations reveal for the first time that the precipitation frequency may play an overlooked role in explaining interannual summer SWC compared to the commonly adopted precipitation quantity. However, this potential is also regulated by the temporal resolution on which the precipitation frequency is calculated.
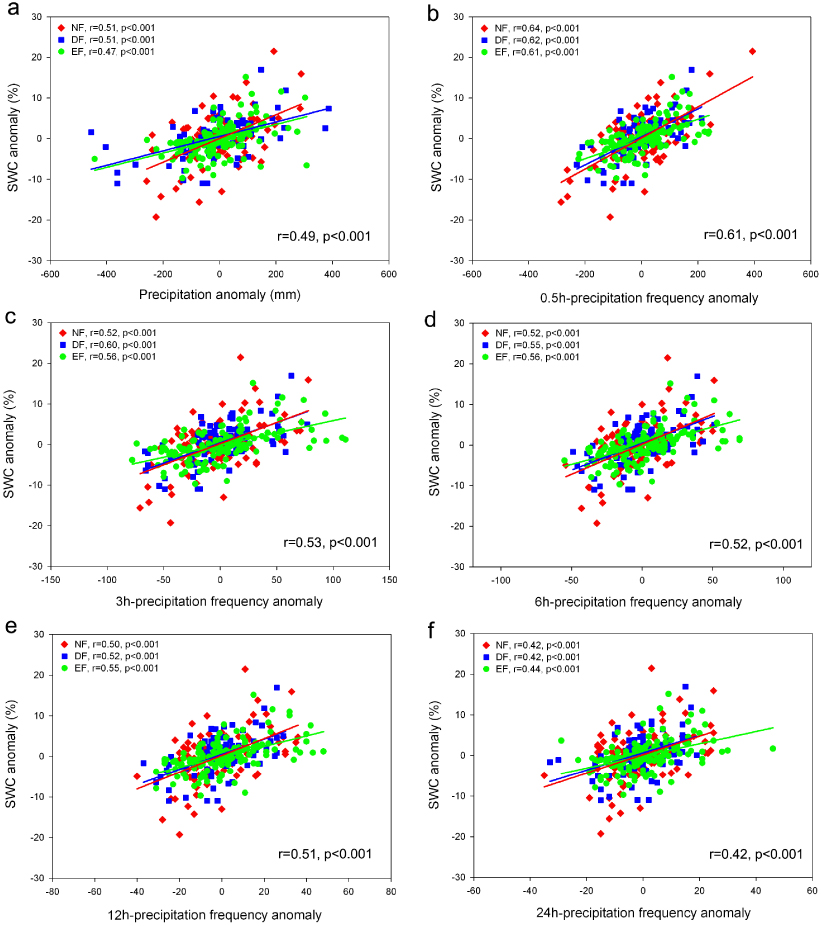
Figure 2. Temporal relationships between the interannual summer soil water content (SWC) anomaly and the anomalies of (a) precipitation quantity, (b) 0.5 h-precipitation frequency, (c) 3 h-precipitation frequency, (d) 6 h-precipitation frequency, (e) 12 h-precipitation frequency, and (f) 24 h-precipitation frequency. The NF (), DF () and EF () represent non-forests, deciduous forests and evergreen forests, respectively.
Download figure:
Standard imageTo better understand the interannual relationships between SWC and precipitation frequencies, we explored the impacts of precipitation frequencies on the total summer precipitation, mean air temperature (Ta) and mean photosynthetic active radiation (PAR) for all sites, given that SWC is affected by both the total precipitation and evaporation (table~1). Significant correlations (p < 0.001) were found between total summer precipitation and the five precipitation frequencies for all plant functional types, suggesting that increasing frequency of rainfall generally provides more water into the soil layer. By comparison, both Ta and PAR were negatively correlated with precipitation frequency, implying that higher frequency of rainfall mitigates drought impacts thereby enhancing SWC.
Table 1. Relationships between precipitation frequency (PF) anomalies and summer precipitation (PP), air temperature (Ta) and photosynthetic active radiation (PAR) for non-forest (NF), deciduous forest (DF) and evergreen forest (EF) sites.
| Precipitation frequency | Pearson coefficients | PP | Ta | PAR | ||||||
|---|---|---|---|---|---|---|---|---|---|---|
| NF | DF | EF | NF | DF | EF | NF | DF | EF | ||
| 0.5 h-PF | r | 0.73 | 0.61 | 0.70 | −0.39 | −0.46 | −0.61 | −0.52 | −0.55 | −0.49 |
| p | <0.001 | <0.001 | <0.001 | <0.001 | <0.001 | <0.001 | <0.001 | <0.001 | <0.001 | |
| 3 h-PF | r | 0.65 | 0.62 | 0.59 | −0.41 | −0.51 | −0.59 | −0.46 | −0.60 | −0.46 |
| p | <0.001 | <0.001 | <0.001 | <0.001 | <0.001 | <0.001 | <0.001 | <0.001 | <0.001 | |
| 6 h-PF | r | 0.60 | 0.60 | 0.59 | −0.41 | −0.51 | −0.57 | −0.41 | −0.58 | −0.46 |
| p | <0.001 | <0.001 | <0.001 | <0.001 | <0.001 | <0.001 | <0.001 | <0.001 | <0.001 | |
| 12 h-PF | r | 0.56 | 0.53 | 0.57 | −0.42 | −0.51 | −0.58 | −0.39 | −0.54 | −0.47 |
| p | <0.001 | <0.001 | <0.001 | <0.001 | <0.001 | <0.001 | <0.001 | <0.001 | <0.001 | |
| 24 h-PF | r | 0.51 | 0.53 | 0.51 | −0.40 | −0.36 | −0.43 | −0.32 | −0.43 | −0.35 |
| p | <0.001 | <0.001 | <0.001 | <0.001 | <0.001 | <0.001 | <0.001 | <0.001 | <0.001 | |
For the seven representative sites, we further found that the SWC was positively correlated with the latent heat with r of 0.61 (p < 0.001) (figure~3). This relationship is consistent with the understanding that humid soil has a high evapotranspiration rate, which uses the latent heat as the main energy. Meantime, we also found that the latent heat was significantly (p < 0.05) correlated with the five precipitation frequencies with r of 0.52, 0.42, 0.39, 0.35 and 0.47, respectively. Therefore, it is reasonable that the precipitation frequencies would correlate with the SWC.

Figure 3. Relationships between interannual summer latent heat (LH) and the anomalies of (a) soil water content (SWC), (b) 0.5 h-precipitation frequency, (c) 3 h-precipitation frequency, (d) 6 h-precipitation frequency, (e) 12 h-precipitation frequency, and (f) 24 h-precipitation frequency for the seven Fluxnet-Canada representative sites (CA-GRA, CA-OAS, CA-OBS, CA-OJP, CA-Df49, CA-DF88 and CA-DF00).
Download figure:
Standard imageSubstantial variations were observed between summer SWC and both precipitation quantity and frequencies spatially (figure~4). Our results demonstrated that the spatial pattern of summer SWC cannot be explained by either precipitation or its frequencies. However, the correlation seemed to differ substantially among plant functional types. While no correlation was observed between these indicators and SWC for forest ecosystems, significant relationships were identified between summer SWC and precipitation quantity (r = 0.54, p = 0.004) for the non-forest ecosystems. Similar results were also found when we explored the relationships of (a) minimum SWC and minimum summer precipitation, and (b) maximum SWC and maximum summer precipitation (data shown in supplementary table 2 available at stacks.iop.org/ERL/7/024011/mmedia). In particular, all those precipitation frequencies can better explain summer SWC with r values of 0.72 (p < 0.001), 0.73 (p < 0.001), 0.72 (p < 0.001), 0.72 (p < 0.001) and 0.68 (p < 0.001) for 0.5 h-PF, 3 h-PF, 6 h-PF, 12 h-PF and 24 h-PF, respectively, suggesting an unrecognized role of precipitation frequency in controlling the spatial patterns of SWC in non-forest ecosystems.
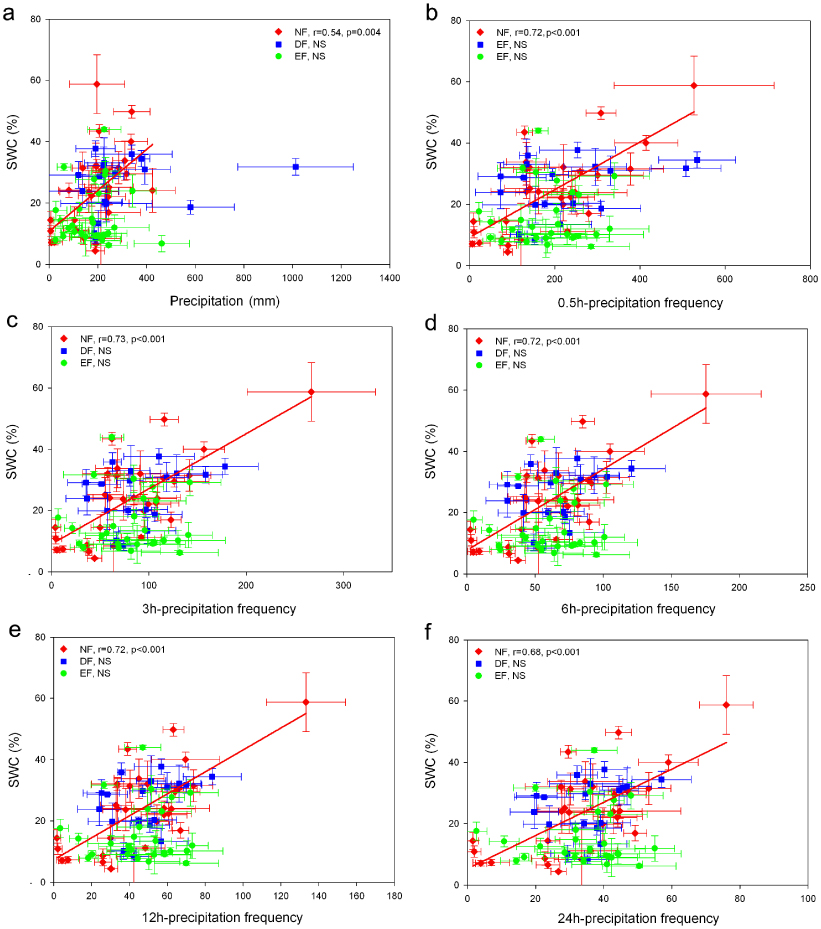
Figure 4. Spatial relationships between summer soil water content (SWC) and (a) precipitation quantity, (b) 0.5 h-precipitation frequency, (c) 3 h-precipitation frequency, (d) 6 h-precipitation frequency, (e) 12 h-precipitation frequency, and (f) 24 h-precipitation frequency. The NF (), DF () and EF () represent non-forests, deciduous forests and evergreen forests, respectively. The points represent data (±standard deviation) for each site. NS represents no significant correlation.
Download figure:
Standard imageThe interannual relationship between precipitation frequency and summer SWC differs from its spatial counterpart. Interannually, precipitation frequency was significantly correlated with SWC for all plant functional types. However, it was only for the non-forest sites that the precipitation frequency was found to be correlated with the SWC spatially. We used a year-to-year anomaly method to analyze the impact of precipitation frequency on interannual SWC variability. Therefore, the temporal relationship between precipitation frequency and SWC will not be affected by site specific soil properties (e.g., soil structures, chemical compositions, topography), which are vital for water holding capacity (Sowerby et~al 2008, Ledger et~al 2011). Hence, the impacts of precipitation frequency on interannual SWC variability will be more evident. When trying to interpret summer SWC spatially, on the contrary, these environmental forcing and soil characteristics are smoothed by averaging multi-year observations, which lead to equilibrium responses of SWC to the combined effects of covarying factors (e.g., climate, structure, species compositions). Therefore, no significant relationship was observed between summer SWC and precipitation frequency for forest ecosystems (both DF and EF sites). These differences potentially imply the important role of soil characteristics in regulating these correlations and challenges of trying to equate spatial and temporal SWC variability.
A more complicated issue is the impact of plant functional type on the temporal–spatial relationships between precipitation frequency and summer SWC. Precipitation frequency can only explain the spatial patterns of summer SWC for non-forest ecosystems. We suggest that the different sensitivities of resisting drought influence between non-forest and forest species is the main reason for these observations. Schwendenmann et~al (2010) demonstrated that tree-based systems may provide several mechanisms that can mitigate the impacts from extreme weather events such as drought. Light to moderate decease in rainfall will not necessarily cause significant reduction in SWC as forests can extract water from deeper soil layers (Schume et~al 2004). In contrast, non-forest ecosystems, e.g. grasslands and crops, are highly sensitive to drought and SWC may be more directly related to the availability of water. Such differences in sensitivity among plant functional types to drought were also observed in the previous analysis of Schwalm et~al (2010) where agricultural areas exhibited the highest sensitivity whereas the tropical region had minimal sensitivity to drought. Overall, these differences between non-forest and forest ecosystems can be attributed to the relative importance between water and other factors in regulating SWC temporally and spatially (Huxman et~al 2004, Köchy 2008, Zha et~al 2010). These results suggest that while interannual variability in summer SWC can be better evaluated from precipitation frequencies, it seems problematic to model its spatial pattern based entirely on these indicators without factors accounting for soil characteristics, further implying the difficulties and challenges in interpreting summer drought globally.
There are several broad implications of this observed relationship between precipitation frequency and summer SWC. Precipitation frequency highlights the importance of precipitation patterns rather than the quantity alone in driving ecological processes through soil water content (Weltzin et~al 2003). It provides insights to improve the accuracy of ecosystem models that do not incorporate such mechanisms or considerations but intend to connect precipitation and soil moisture. The correlation between precipitation frequency and SWC holds the potential to bridge experimental results under manipulated precipitation patterns (e.g., equal precipitation quantity but differing in size and frequency) to natural settings, improving the role of precipitation variability (Knapp et~al 2002). This method may provide a solution to analyze the temporal heterogeneity of precipitation that can lead to substantial differences in precipitation patterns even if the interannual summer precipitation totals are relatively stable. With the expected rates of longer and more severe periods of drought projected by climate change models, there is an urgent need for models and methods to mechanically link precipitation regimes and ecological processes. It is advisable that future models for the analysis of precipitation effects take precipitation frequency into consideration to improve the ability of climate models to predict quantitative ecosystem responses in future climate scenarios.
4. Conclusions
Using long-term observations from multiple sites, we showed that the interannual variability in summer SWC at the regional scale was correlated with the precipitation quantity for each plant functional type. Spatially, the dynamic SWC pattern was also related to precipitation distribution, but this relationship was only observed in non-forest ecosystems. We also showed that interannual summer SWC is significantly correlated with several precipitation frequencies, which may have better potential than the precipitation quantity previously adopted. These results suggest that the role of precipitation frequency is probably underestimated, which may result from the difficulty in obtaining such information. With increased capability in data collection and processing, the pattern of precipitation should be considered in future ecosystem models to better link precipitation and ecosystem functioning. To the best of our knowledge, these analyses are first results for the impacts of precipitation frequency on summer SWC globally. Furthermore, we also showed the importance of the temporal resolution on which the precipitation frequency was based. While sub-daily precipitation frequencies better explain interannual summer SWC, our global analysis indicates that the precipitation frequency calculated at the daily temporal scale is not a good indicator of interannual summer SWC, and is even inferior to the summer precipitation quantity. These observations provide a feasible solution to better analyze interannual summer drought, especially considering the availability of precipitation forecasting data at the sub-daily temporal scale globally (e.g., NCEP, National Centers for Environmental Prediction).
Acknowledgments
This work was funded by an NSERC Strategic Grant (381474-09), the National Natural Science Foundation of China (Grant No. 41001210), the Knowledge Innovation Program of CAS (KZCX2-EW-QN302), and we also acknowledge the Academy of Finland Centre of Excellence program and Academy of Finland project (218094). The flux data were acquired by the FLUXNET community and in particular by the following networks: AmeriFlux, AfriFlux, AsiaFlux, CarboAfrica, CarboEuropeIP, CarboItaly, CarboMont, ChinaFlux, Fluxnet-Canada, GreenGrass, KoFlux, LBA, NECC, OzFlux, TCOS-Siberia and USCCC. We acknowledge the financial support to the eddy covariance data harmonization provided by CarboEuropeIP, FAO-GTOS-TCO, iLEAPS, Max Planck Institute for Biogeochemistry, National Science Foundation, University of Tuscia, Université Laval and Environment Canada, and US Department of Energy, and the database development and technical support from Berkeley Water Center, Lawrence Berkeley National Laboratory, Microsoft Research eScience, Oak Ridge National Laboratory, University of California-Berkeley, University of Virginia.