

Abstract
Eutrophication is a major global concern in lakes, caused by excessive nutrient loadings (nitrogen and phosphorus) from human activities and likely exacerbated by climate change. Present use of indicators to monitor and assess lake eutrophication is restricted to water quality constituents (e.g. total phosphorus, total nitrogen) and does not necessarily represent global environmental changes and the anthropogenic influences within the lake's drainage basin. Nutrients interact in multiple ways with climate, basin conditions (e.g. socio-economic development, point-source, diffuse source pollutants), and lake systems. It is therefore essential to account for complex feedback mechanisms and non-linear interactions that exist between nutrients and lake ecosystems in eutrophication assessments. However, the lack of a set of water quality indicators that represent a holistic understanding of lake eutrophication challenges such assessments, in addition to the limited water quality monitoring data available. In this review, we synthesize the main indicators of eutrophication for global freshwater lake basins that not only include the water quality constituents but also the sources, biogeochemical pathways and responses of nutrient emissions. We develop a new causal network (i.e. multiple links of indicators) using the DPSIR (drivers-pressure-state-impact-response) framework that highlights complex interrelationships among the indicators and provides a holistic perspective of eutrophication dynamics in freshwater lake basins. We further review the 30 key indicators of drivers and pressures using seven cross-cutting themes: (i) hydro-climatology, (ii) socio-economy, (iii) land use, (iv) lake characteristics, (v) crop farming and livestock, (vi) hydrology and water management, and (vii) fishing and aquaculture. This study indicates a need for more comprehensive indicators that represent the complex mechanisms of eutrophication in lake systems, to guide the global expansion of water quality monitoring networks, and support integrated assessments to manage eutrophication. Finally, the indicators proposed in this study can be used by managers and decision-makers to monitor water quality and set realistic targets for sustainable water quality management to achieve clean water for all, in line with Sustainable Development Goal 6.
Export citation and abstract BibTeX RIS

Original content from this work may be used under the terms of the Creative Commons Attribution 4.0 license. Any further distribution of this work must maintain attribution to the author(s) and the title of the work, journal citation and DOI.
1. Introduction
Freshwater lakes are increasingly vulnerable to global changes such as climate change and pressures of rising nutrient loads from human activities threatening future water and food security (Chidammodzi and Muhandiki 2015, Ma et al 2020, Yao et al 2021). By 2050, one-sixth and one-fourth of the projected world's population are estimated to be exposed to high-water-quality risks due to excessive N and P, respectively (Ifpri 2015), making nutrient pollution one of the most threatening water quality issues. According to Steffen et al (2015), N and P loadings already exceed the planetary boundaries, especially from the fertilizers use in agriculture. Nutrient management is thus critical to reduce pollution and achieve water-related targets in the global Sustainable Development Goals (SDGs) (Wang et al 2022).'Eutrophication' is the enrichment of nitrogen (N) and phosphorus (P) in water bodies leading to the enhanced growth of harmful algae and phytoplankton biomass, compromising its quality, use and ecological integrity (Hutchinson 1973, European Commission 1991, OECD 1993, UNEP 2001, European Commission and WHO 2002, Khan and Ansari 2005). Figure 1 summarizes the main nutrient sources, pathways and impacts of eutrophication in freshwater lake basins with a schematic overview.

Figure 1. Schematic overview of main nutrient sources (the purple color), pathways (the red color), and impacts (the green color) of eutrophication in freshwater lakes. Population and economic growth drive nutrient emissions. The main sources are 1- croplands, 2- livestock, 3- domestic sewage from rural and urban areas, 4- industrial effluents, 5- legacy nutrients (from surplus in soil on agricultural lands and green areas). These nutrient loads are delivered to lakes via two main hydrological pathways: 6- surface runoff, 7- leaching to groundwater subsequently discharged into streams. The increase of nutrient concentrations cause 8- algal blooms, increased floating macrophytes and 9- hypoxia. The extent of these impacts depend on the nutrient loads from land, rivers, and in-lake nutrient mechanisms i.e. P recycling from sediments, stratification, nitrification, fish abundance, plankton dynamics and climate change factors (e.g. temperature, precipitation). The dashed lines refer to links of population growth, economic growth and climate change with sources, pathways and impact. Refer to the web version of the article for the color representation of this figure.
Download figure:
Standard image High-resolution imageAs a result of nutrient enrichment, there is a general trend of increased algal bloom risks globally, although it is more pronounced in the developing regions like Asia and Africa (Ho et al 2019, Feng et al 2021, Hou et al 2022). The microcystis (blue-green algae) cyanobacterial blooms in Lake Erie led to shutdown of water supply for three days in city of Toledo, Ohio (Jetoo et al 2015, Carmichael and Boyer 2016, Watson et al 2016), while the blooms in Lake Taihu left almost two million people in China without drinking water for at least two weeks (Qin et al 2010, Zhang et al 2010). Regions with rapidly growing population, food demand and underdeveloped sanitation infrastructure are particularly more vulnerable to the effects of algal blooms. To support integrated water quality management, the main goal of the review is to synthesize the main indicators of eutrophication in the freshwater lake basins globally to improve mechanistic and holistic understanding of how they impact lake eutrophication dynamics. These indicators go beyond in-situ water quality status of lakes and also represent anthropogenic activities, climate change and socio-economic conditions of the basin to better understand their responses. We present an interdisciplinary overview of recent research linked to the indicators that include sources and pathway of nutrient emissions from surrounding basins to lakes with the aim to promote their inclusion in global monitoring and evaluate design of management options. Our primary target audience is the community of environmental science while experts in limnology, ecology or hydrology could benefit from the broad and integrated scope of the review.
Several reviews have covered a few themes considered in this work, but to our knowledge the level of comprehensiveness and the incorporation of a broad range of relevant indicators of lake eutrophication in a systematic manner has not been done before. Some examples of recent thematic review on the topic are from de Paul Obade and Moore (2018), Uddin et al (2021) focusing on water quality indices, le Moal et al (2019) with special attention to the land-water-sea continuum of eutrophication, Schneider et al (2020) on the littoral eutrophication indicators and Mishra et al (2021) analysing the studies concerning impacts of extreme climate events on water quality. In our work, the main novelties lie in three aspects. First, we review the main indicators of freshwater eutrophication with a special focus on the influencing role of drivers and pressures towards impact in lakes. Second, we develop a new causal network instead of a unidirectional causal chain, to signify the complex system interactions in a lake basin. Lastly, we provide a comprehensive overview of nutrient dynamics of the key indicators of drivers and pressures using seven cross-cutting themes: (i) hydro-climatology, (ii) socio-economy, (iii) land use, (iv) lake characteristics, (v) crop farming and livestock, (vi) hydrology and water management, (vii) fishing and aquaculture. The findings of this review are organized in four sections. Sections 1.1 and 1.2 provide the background on research challenges related to indicators and their relevance in eutrophication management, section 2 describes the review methodology, section 3 summarizes the main eutrophication indicators using the new causal network and provides an overview of the nutrient mechanisms of the drivers and pressures, and section 4 provides an outlook on the insights for advancing eutrophication management using indicators.
1.1. Indicators for eutrophication
In environmental sciences, an indicator is conventionally defined as a parameter, or a value derived from parameters that describe the state of the environment and its impact on human beings, ecosystems and materials, the pressures on the environment, the driving forces and the responses steering that system (OECD 1993, EEA 1999, USEPA 2006). Indicators are already a widely-used criteria to characterize the impacts in aquatic systems and consistently compare different regions across the world. However, the use of water quality indicators, water quality parameters and a water quality index or indices (Gholizadeh et al 2016, Wilder 2016, Uddin et al 2021) interchangeably often focus only on physical, chemical, biological and ecological characteristics of water. It fails to account for direct anthropogenic influences in the monitoring and evaluation of water quality, which hinders holistic assessments of lake eutrophication and sustainable nutrient management. Therefore, we first define water quality indicators specifically as (i) qualitative and quantitative metrics that describe natural and anthropogenic forcings on the system; (ii) metrics estimated based on spatiotemporal variation of known parameters such as total P, total N, dissolved oxygen; (iii) allow for long-term trends assessment, hotspots identification and future projections; (iv) help to set realistic targets and management actions towards a clean water supply. This review starts from the premise that indicators that describe the various dimensions of eutrophication, including impacts of global changes, can be a firm basis for integrated assessments of causes, impacts, responses and feedback. These type of comprehensive indicators can benefit the forthcoming progression of water quality monitoring networks especially in the developing regions, emerging economies and international policy making such as the SDGs.
There is still a lack of understanding of the comprehensive water quality indicators that represent the characteristics explained above. The reasons for their non-existence for lake eutrophication for wider use by researchers and practitioners can be summarized as four-fold. First, eutrophication is a complex environmental problem, but it lacks integrated assessments that include multiple dimensions of the issue. Second, water quality is often addressed at local scale (e.g. point scale, field-scale, river basin) even though eutrophication is a global issue. Third, the lack and unequal distribution of water quality monitoring data limits a comprehensive and large-scale assessment of lake euthropication. Fourth, nutrient emission and transport models that used to make up for the lack of data are missing an explicit representation of lake ecosystems. On the other hand, the existing lake models lack integration with other surface water systems, and in addition, some biogeochemical processes (e.g. legacy, phosphorus exchanges in sediment-water interface) are also not well characterised. To establish causal relationships between nutrient enrichment in lakes, its effects and the underlying nutrient pollution due to human activities, pathways and their dynamics with the landscape, quantitative studies to assess the indicators must be developed. This can help to diversify the monitoring programs and support efficient lake water quality management.
1.2. Status of eutrophication assessments
There have been significant scientific advances (e.g. N, P pathways from point-, diffuse-sources, the modeling of nutrient dynamics, field-based monitoring) to understand the long-term nutrient fluxes and their implications on global biogeochemical cycles since the early seminal works (Weber 1907, Thienemann 1918, Naumann 1919, Vollenweider 1968, Johnson and Vallentype 1971, Schindler et al 1971, Vollenweider 1975, 1976, Carlson 1977, Schindler 1978, Rast and Holland 1988). However, limited systemic studies combining climate, land use, hydrology and water management to underlying eutrophication in lakes exist. Eutrophication is a 'wicked' problem (Thornton et al 2013) that requires combined knowledge from environmental science (Smith 2003), climate science (Kosten et al 2012, Glibert 2020, Grant et al 2021), limnology (Jin 2002, Janssen et al 2021b), agronomy (Li et al 2019b, Vero and Doody 2021), hydrology (Maavara et al 2015, van Vliet et al 2017, 2021), freshwater biology (Langdon et al 2006, Lin et al 2014), ecology (Hampton et al 2018, Chang et al 2022), and social science (van Puijenbroek et al 2015, Yang et al 2019). The interactions between these dimensions result in complex responses within lake systems, requiring attention in eutrophication assessments and design of mangement scenarios (Lin et al 2021, Su et al 2021).
Historic understanding of N and P dynamics led to point source control in developed regions of North America and Europe. However point source pollution is still a threatening water quality issue in emerging economies such as Asia and Africa. Their impacts are amplified by climate change. The discovery of legacy effects from diffuse emissions (e.g. agriculture) (Sharpley et al 2013, van Meter et al 2016), has further increased concerns and the need to understand the land-water interactions as part of nutrient biogeochemical pathways. Advances in modeling studies aimed at understanding legacy nutrient dynamics (Chen et al 2015, van Meter et al 2017), revealed large uncertainities in the types of sources and dynamics and the spatial and temporal effects thereof (Hamilton 2012). Examples of outstanding challenges relevant to eutrophication include: estimation of denitrification rates for N, concentrations of P in sediments, and nutrient residence times in soils, groundwater bodies and surface waters (Zhang et al 2020). These limitations in the ability to quantify nutrient budgets are found to underestimate the impact of nutrients on the environment and to limit proactive nutrient management (Chen et al 2017, van Meter and Basu 2017).
Understanding multitude lake responses, such that synergistic impact and non-linear interactions of in-lake mechanisms, the external nutrient loadings and global changes are captured, can appropriate the root causes of nutrient enrichment (Glibert et al 2018, Paerl et al 2019a). An outlook on eutrophication that goes beyond general conclusions about the required P reduction (Schindler 2012, Schindler et al 2016) or N loadings (Lathrop 2007, Lewis et al 2011, Paerl et al 2019b) or both, is required to maintain lake ecosystem health and water quality. On the other hand, there is limited understanding of how climate change impacts nutrient dynamics in different climate zones and how they interactively trigger algae blooms (Fragoso et al 2011, Kosten et al 2012, Richardson et al 2019). An integrated understanding can support sustainable nutrient management and long-term policy making.
The advancement in water quality research is heavily constrained by a scarcity of in-situ monitoring data of water quality parameters across scales and geographies, particularly in Africa, South Amercia and large parts of Asia. These countries lack details that hinder local and large-scale assessments. Recent developments in satellite-based water quality observation seem promising to address this gap and support science-based management. A number of large-scale models have been developed to assess nutrient emissions and other water quality constitutents and their impact on surface waters. Examples of these are MARINA (Strokal et al 2016), SWAT (Abbaspour et al 2015), Global-NEWS (Mayorga et al 2010), SWIM (Krysanova et al 2005), HYPE (Lindström et al 2010), integrated modeling frameworks such as IMAGE-GNM (Beusen et al 2015), WorldQual as part of WaterGAP (Reder et al 2013), VIC-Qual (van Vliet et al 2021) and DynQual linked to PCR-GLOBWB (Jones et al 2022). Such models are able to identify hotspots and long-term nutrient trends in surface waters. They have, however, severe limitations in their representation of nutrient dynamics in lakes and lake ecosystems. Some process-based models such as PCLAKE+ (Janssen et al 2019), DYRESM–CAEDYM (Hamilton and Schladow 1997, Schladow and Hamilton 1997, UMEDA and IZUMI 2008) and LEEDS (Malmaeus and Håkanson 2004) can be specifically used to assess the eutrophication impact in lakes. There is a need to couple the existing lake models with the models that simulate the nutrient emissions from the surrounding river basin to the lake environment. In conclusion, the gaps in surface water quality data can be overcome by the integration of in-situ monitoring, satellite-based observation, nutrient emission, transport models and lake water quality models.
2. Methods
The methodology for this review can be explained in two steps: (i) the main indicators to develop a causal network; and (ii) nutrient specific mechanisms of driver and pressure indicators.
2.1. Need to develop a causal network
The drivers-pressure-state impact response (DPSIR) is a conceptual framework, widely used to categorize indicators in a cause-effect chain for policymaking and decision support (Duan et al 2021, Romanelli et al 2021, Kosamu et al 2022). It is a result of strategy recommendation for integrated environmental assessments (EEA 1999) where drivers are linked to pressure then to state, impact and response indicators respectively (figure 2). In its vast applications, variation is observed in the description of each of these elements and is often open to interpretation (Patrício et al 2016). In this paper, we define:
- Drivers as activities within the basin (e.g. socio-economic) and external factors (e.g. climate change) causing or worsening nutrients enrichment or both;
- Pressure as flows (e.g. fluxes and dynamics) of the nutrient emissions (e.g. point vs. diffuse) from specific sources and contributing sectors;
- State as physical or chemical or biological or ecological changes in lake ecosystem from nutrient loads, concentrations and climate;
- Impact as effects on aquatic and dependent ecosystems due to nutrient emissions to different environments and;
- Response as the actions of decision-making such as management and policy making to address any negative impact.

Figure 2. The drivers-pressures-state impact response (DPSIR) is the conceptual framework for eutrophication in freshwater lakes. This figure is adapted from (EEA 1999). The original DPSIR framework was developed to design integrated management solutions. In this context, the deliberation of interventions could either be to regulate drivers, pressures, states or impact (solid lines from response) while D-P-S-I (solid lines) are the one-way cause-effect chain. This causal chain does not represent the feedback mechanisms and interactions of causes and effects among the DPSIR elements (highlighted in dashed line). The cause-effect relationship of each of the indicators of the DPSIR elements is used to develop the causal network shown in figure 3 that also highlight these missing linkages. Refer to the manuscript for the definition of each DPSIR element and to the web version of the article for the color representation of the figure.
Download figure:
Standard image High-resolution imageThe key advantages of the DPSIR framework are (i) applicability to a range of ecosystems (e.g. rivers, lakes) and environmental issues such as eutrophication, water resource management, ecosystem monitoring (Wang et al 2015, Ramos et al 2018); (ii) it is a bridging tool among scientists, policymakers and the stakeholders that adopts interdisciplinary communication and visualization (Karageorgis et al 2005, Niemeijer and de Groot 2006, Helming et al 2012).
First, we did a qualitative literature survey to synthesize the existing evidence of the DPSIR studies to identify and categorize the potential indicators of lake eutrophication. As a result, 58 representative indicators were selected and categorised into DPSIR elements. The full set of indicators and its relevance to eutrophication is provided in the supplementary information (SI-1). These interactions of the indicators were mapped to form a causal network—instead of a causal chain. For this, a wide range of studies were selected that addressed the causes of eutrophication (e.g. climate, agriculture), nutrient mechanisms in the lakes and the application of DPSIR for freshwater eutrophication either separately or in combination. The cause-effect chain (solid lines in figure 2) is unidirectional, which oversimplifies the true complexities of the system. The main aim of the causal network is to address the gap in the representation of the feedback links (dashed lines in figure 2), to identify the interrelationships among indicators and feedback mechanisms of lake eutrophication. The concept of the causal network is novel in environmental science and the system interactions of the DPSIR framework have been understudied (Lundberg 2005, Niemeijer and de Groot 2008, Svarstad et al 2008, Srebotnjak et al 2012, Gregory et al 2013, Dolbeth et al 2016, Chang et al 2022). It is demonstrated that representing the system complexity in its entirety is useful for efficient policymaking and sustainable water quality management (Smith and Schindler 2009, Friberg 2014, Scharin et al 2016, Teurlincx et al 2019a, Birk et al 2020, Huang et al 2022).
2.2. Nutrient-specific mechanisms of drivers and pressures
To understand the direct and indirect impact on lakes from human-induced nutrient loads and global changes, nutrient specific-mechanisms are reviewed for the key indicators of drivers and pressures using seven cross-cutting themes: (i) hydro-climatology; (ii) socio-economy; (iii) land use; (iv) lake characteristics; (v) crop farming and livestock; (vi) hydrology and water management; (vii) fishing and aquaculture. The strings of key words for web searches are provided in the supplementary information (SI-2). Using the authors' knowledge, we selected peer-reviewed articles (review and research papers) depending on their relevance to eutrophication assessment and water quality indicators. The general search period for the selected articles is from 2015, however where it is essential to the discussions of the indicators, we have included articles before this period. To a limited extent, we have used international reports and policy guides to substantiate our discussions and arguments. A full list of selected articles is provided in SI-2. The list is categorized according to sections and cross-cutting themes to guide the readers. This review uses a traditional approach and is not a meta-analysis. We emphasize that due to breadth of the topics in this review, we provide a comprehensive overview based on recent research but inevitably had to compromise on the depth in each topic as they are individual study topics in themselves.
3. Results and discussion
3.1. The new causal network for indicators of eutrophication
The missing linkages (i) between the DPSIR elements such as drivers to state, impact and response as shown in figure 2 and (ii) among drivers, pressures, state and impacts are explored in this section. The new causal network in figure 3, depict non-linear complexities in the lake systems through interactions between and amongst each other. The cause-effect connections with each indicator is described in the supplementary information (SI-3). Mapping out these interactions reveals which processes in the cause and effect nework are poorly represented or require further investigation. For example, in figure 3(b), the indicators of drivers are mainly linked to the indicators of state, impact and response which reflect the missing feedback (dashed lines from driver) shown in figure 2. Even in the event that nutrient emissions to lakes and lake nutrient dynamics are fairly well understood, the influence of lake characteristics such as light availability, residence times and morphometric characteristics such as lake depth is a relatively new area of research to assist nutrient management of lakes. For instance, in figure 3(a), these drivers of the lake characteristics are highly linked to the state indicators such as macrophytes, phytoplanktons and zooplanktons, however their relationships with nutrient concentrations and thereby the occurrence of algal blooms are not linear. There is an additional pressure on these indicators from human-altered flow regimes, that depends on specific nutrient forms and its retention in water-columns (Glibert et al 2018). It is therefore important to understand their complex interplay and underlying mechanisms that can aid specific management responses (figure 3(f)). Furthermore, evidence suggests the physical traits of the phytoplankton community can adapt and are resilient to the prevailing nutrient ratios, water temperature, residence times (i.e. flushing rates) and light available for photosynthetic activity. On the other hand, the direct impact of temperature and precipitation change such as regime shifts and stratification are largely known in lake systems although there are still missing links on the altering of nutrient dynamics and its effects on concentrations and lake ecosystems during floods and droughts (figures 3(b) and (d)). Also, the way spatial and temporal variation in land-use characteristics and different sources such as cropland, livestock and sewage flow challenge the understanding of nutrients routing i.e. transport and retention from the landscape into lakes. Furthermore, the impact of a growing number of alternating drought-flood or flood-drought events on soil-nutrient dynamics and associated nutrient export are very uncertain and are documented to vary according to the catchment characteristics (e.g. land-use).
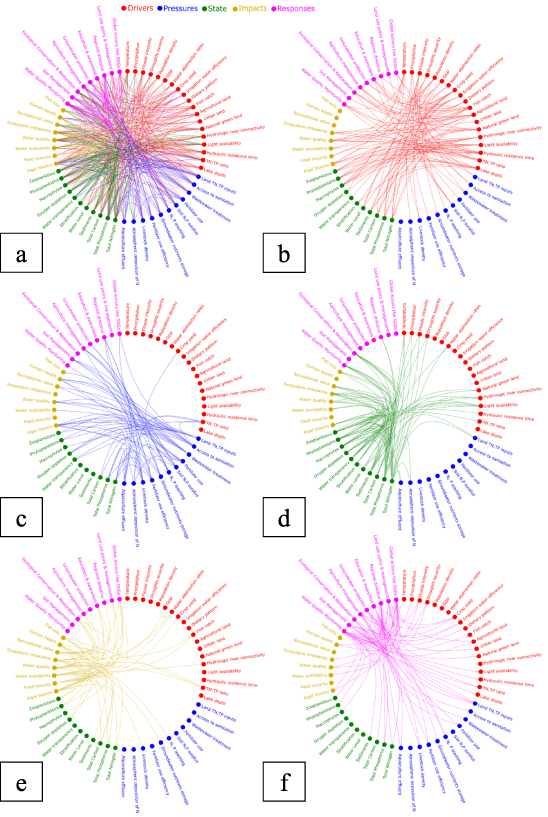
Figure 3. The new causal network of the DPSIR framework with 58 selected indicators. (a) the network connections for all the DPSIR elements, (b) network connections for drivers, (c) network connections for pressures, (d) network connections for states, (e) network connections for impact, (f) network connections for responses. The relevance of each of the indicators to eutrophication is described in SI-1 and to read each connections in the causal network refer to SI-3.
Download figure:
Standard image High-resolution imageSimilarly, in figure 3(c), the indicators of pressures are mainly linked to impact, responses and amongst each other show the missing feedback (dashed lines from pressure) in figure 2. For example, even though there is evidence of the impact of aquaculture effluent on lake water quality, they are rarely integrated in the analyses of eutrophication. There are also considerable limitations in the understanding and assessment of nutrients storage in groundwater. Although nitrogen leaching into subsurface pathways is an active research topic (Schilling et al 2012, Rudolp 2015, Basu et al 2022), due to longer residence times (even decades) in sub-surface pathways and lack of long-term monitoring, the assessments of their contribution to the lake nutrient budgets is difficult. Besides, both terrestrial and aquatic nutrient budgets apart from being governed by soil characteristics, soil and groundwater concentrations depend on land-based agricultural activities such as fertilizer use, irrigation, and water abstraction, which consequently play a key role in the lake-nutrient budget.
The causal network also elucidates possible two-way interconnections present in real systems, but are often simplified in a uni-directional causal chain. For instance, to maintain ecological balance and the phytoplankton biomass, the grazing activity of phytoplanktivore and detritivore fishes (altered by fish catch) is essential (figure 3(e)). However, the balance is also dependent on the vegetation dynamics of the ecosystem—which changes in response to high nutrients input leading to algal blooms and fish kills (figures 3(c) and (d)). On the other hand, already eutrified lakes have reduced water transparency and influence the vertical light distribution affecting the growth, distribution, and species interaction of the submerged macrophytes (Chen et al 2016), which further lead to hypoxic or anoxic conditions or both (Yang and Hao 2008) and alter the trophic levels.
The abovementioned are some examples of the complex interactions demonstrated in the causal network between climate, human activities and lakes. The causal network demonstrates the complexities of allochtonous (external) and autochthonous (internal) factors in lake basins in the visual framework (figure 3). This causal network is a general overview for freshwater basins and further details including quantitative weights of each processes can be developed based on the application and research questions to be addressed. The causal network offers an integrated approach and is able to disect the causes and mechanisms behind eutrophication in lakes and thus allows for the comprehensive interpretation of the water quality indicators. These are essential to comprehend nutrient dynamics and feedback mechanisms and to understand lake eutrophication trends and the effect on phytoplankton and bloom activities. We stress that this list of indicators is only an overview of the main indicators (by no means exhaustive) to highlight the requirement of a holistic approach in eutrophication assessments. The causal network should be considered only heuristically to include a similar level of detail to characterise processes in eutrophication assessments. It is a static network, but to a certain extent, multiple layers of networks can be developed for specific cases to represent key interactions for different timescales. Such complex representations that are conceptual frameworks can provide insight on emerging interactions to set realistic water quality targets for lakes. It can potentially assist researchers in discussions and decisions about the suitability and complexity of the water quality tools or assessment methods and prioritise the most important processes. Moreover, the visualization of such horrendograms (complex network – figure 3) also makes it easier to communicate the complexity of the problem to a wider audience of varied disciplines and by capturing this complexity in measurable indicators to potentially bridge the gap between science and practice. Studies by Janse (1997), Nikolaidis et al (1998), Richardson et al (2018), González Sagrario et al (2020) and Chen et al (2021) are examples of complex lake responses to nutrient enrichment and demonstrate highly non-linear relationships between nutrient emissions from land and lakes responses. More emphasis on the integration of interactions and multiple feedback loops could spur the development of new and innovative ways of integrated assessments for water quality.
3.2. Key indicators for the assessment of eutrophication in global freshwater lakes
Due to the understandable breadth of topics covering the 58 indicators outlined in section 3.1, the detailed nutrient cause-effect mechanisms have been reviewed only for the selected drivers and pressures (30 indicators in total). While it could be argued that most of the mechanisms for lake eutrophication are well established, the systemmatic understanding and quantificaton of diverse drivers and pressures from the entire lake basin lags behind undermining its integrated management. We have prioritized the indicators of drivers and pressures to understand the eutrophication impact due to the following: (i) it covers multiple dimensions of eutrophication explained using cross-cutting themes as shown in figure 4 to reiterate the importance of the lake-basin approach; (ii) explicit land-water interactions from nutrient sources considers global changes including climate change and anthropogenic influences; and (iii) understand root causes of nutrient enrichment. They aim to provide a holistic, interdisciplinary and systems analysis perspective while we highlight some potential knowledge gaps. Table 1 summarizes the cause-effect mechanisms of all the indicators with their definition in this study and a detailed explanation is provided in sections 3.2.1–3.2.7. Additional information on the global available datasets for the indicators of drivers and pressures are compiled in the supplementary information (SI-4) to assist water quality studies on indicators.

Figure 4. This figure provides an overview of the indicators of drivers and pressures categorized into seven cross-cutting themes: (i) hydro-climatology, (ii) socio-economy, (iii) land use, (iv) lake characteristics, (v) crop farming and livestock, (vi) hydrology and water management, and (vii) fishing and aquaculture. These 30 indicators represent spatial or temporal changes or both. Refer to table 1 for the definition of each indicators and summary on their cause-effect eutrophication mechanism.
Download figure:
Standard image High-resolution image
Table 1. The summary of cause-effect mechanisms of indicators of eutrophication drivers and pressures in freshwater lake basins.
| Thematic category | Indicators | Definition of the indicators | Cause-effect mechanisms | Selected References |
|---|---|---|---|---|
| Hydro-climatology | Temperature (D) | Mean lake temperature as a function of surface water temperature, deep-water temperature and vertical thermal gradients. | Regime shifts, (−) nutrient availability in epilimnion, impact dilution potential, (+) internal P recycling and denitrification in the benthic zone. | (Scheffer and Jeppesen 2007, Kosten et al 2012, Woolway et al 2021a) |
| Precipitation (D) | Spatiotemporal precipitation patterns in a lake basin dependent on amount and duration of rainfall. | (+) Precipitation: (+) transport of N and P via runoff, instream processes and infiltration to groundwater. (−) precipitation: (−) lake levels, (+) nutrient retentions due to (+) residence times. | (Ballard et al 2019, Bargu et al 2019, Coffey et al 2018) | |
| Floods intensity (D) | Percentile peak discharge at lake inflows from the lake basin as compared to its average seasonal discharge. | (+) Discharge fluxes of N, P from point (sewage overflow) and diffuse (agriculture) sources, (−) photosynthetic activity of blooms due to the flushing of biomass. | (Reichwaldt and Ghadouani 2012, White et al 2009) | |
| Frequency and severity of droughts (D) | Aggregated function of accumulated rainfall (meteorological), soil-moisture deficit (agricultural), the percentile of streamflow and reservoir water levels (hydrological). | (+) Nutrients retention in soils, (−) flushing rates, (+) nitrification and resuspension of P from sediments in the hypolimnion, (−) dilution capacity, TN and TP in lakes from point sources. | (Vicente-Serrano et al 2020, van Vliet and Zwolsman 2008, Qiu et al 2021) | |
| Socio-economy | Population density (D) | Ratio of the total population to the lake basin area. | (+) Economic activities due to (+) demand for water, energy, food and consumer products; pathways to (+) N and P: atmospheric deposition of N, biological fixation, (−) role of natural vegetation, land use change and (+) erosion. | (Duan et al 2009, Olokotum et al 2020) |
| GDP (D) | Average per capita income of the population within the basin area. | (Song et al 2021, Fang et al 2022) | ||
| Water abstraction rates (D) | Water withdrawal from lakes for total water demand of the lake basin. | (−) Water level and (+) total solute concentration, seasonal level fluctuations (+) residence time and (+) light availability, (+) P from sediments resuspension. | (van Vliet et al 2017, Hampton et al 2018, Wu et al 2018, Flint et al 2022) | |
| Wastewater treatment (P) | Percentage of wastewater treated of the total generated. | Inadequate wastewater collection and treatment infrastructure → risk of open defecation and direct waste water discharge (rich in N,P) into lakes; high organic matter → hypoxia or anoxia, (+) nutrients emission from sludge mismanagement, rapid N:P alteration in lakes due to point source nutrients emissions. | (van Puijenbroek et al 2019, Jones et al 2022) | |
| Access to sanitation (P) | Percentage of the total population without access to sanitation i.e. connection rate to the sewer network. | (Fuhrmeister et al 2015, Tong et al 2017) | ||
| Hydrology and Water Management | Hydrologic river connectivity (D) | Sum of longitudinal (river fragmentation) and lateral (to floodplain) connectivity. | Three pathways: exchange of nutrients from floodplain to rivers, rivers to floodplain and rivers to lakes; balance of nutrient export to and its retention in lakes. Trend: ↑ N in upstream rivers and floodplain, ↑ P and chlorophyll-a in lakes downstream; connectivity dynamics and geomorphology in dammed basins vary. | (Kufel and Leśniczuk 2014, Heino et al 2020, Maavara et al 2020) |
| Groundwater nutrients storage (P) | TN and TP in the total lacustrine groundwater discharge based on residence time and leaching rates of soil surplus N, P. | Groundwater-lake interactions of the surplus N (NO3 −), P (in anoxic conditions) through infiltration and nutrients legacy effect due to longer groundwater residence time. | (Schilling et al 2012, van Meter et al 2016, Ascott et al 2017) | |
| Irrigation water efficiency (D) | Ratio of total water uptake by the crops to the total water added to the agricultural land. | Over-irrigation → anoxic conditions → nutrients (from fertilizer on land) leaching from root zone; and (+) nutrients concentration in surface runoff. | (Blanco-Canqui 2018, Liang et al 2020) | |
| Land use | TN and TP inputs from lake basin (P) | Sum of TN and TP from all point and diffuse sources on land directly entering the lake and the riverine nutrients discharge. | Discharge of effluents from industries, untreated sewage and treated effluents from urban areas, discharge (drainage and runoff) from agricultural and natural areas, catchment to lake area ratio for external N and P loads. | (Silvino and Barbosa 2015, Keatley et al 2011, Wang et al 2021) |
| Change in agricultural, urban, and natural green cover (D) | Temporal change in the lake basin area of agricultural land, urban area and natural green cover (forests, wetlands, grasslands). | Changes to edaphic properties, natural green cover sink for nutrients, natural land reclaimed/converted to agriculture and urban → (+) nutrients and sediments, long-term nutrient accumulation, change of drainage response → nutrients export. | (Chang et al 2008, Dupas et al 2015, Atkinson et al 2019, Teurlincx et al 2019b, Yang et al 2020, Njagi et al 2022) | |
| Crop farming and livestock | Dietary pattern (D) | Consumption pattern (increase in global meat consumption) i.e. the fraction of the total protein intake as animal products. | Linked to N, P input-output balance of the whole food production, inefficient N and P uptake by the animals and improper manure management → (+) N, P soil surplus due to livestock intensification and feed crop production. | (Alexander et al 2015, Liu et al 2017, Springmann et al 2018) |
| Livestock density (P) | Livestock density is livestock unit(s) per unit of agricultural land. | (Sheldrick et al 2003, Schipanski and Bennett 2012, Ray et al 2022) | ||
| Atmospheric deposition of nitrogen (P) | The total deposition (wet and dry) of nitrogen (NH3, NOx) on land, rivers and lakes originated from agricultural activities such as manure management in livestock production and fertilizer application. | N from fertilizers, biological N2 fixation ((+) due to (+) food and energy demand), animal manure production, NO released during denitrification from croplands, NH3, N2O, NO by livestock manure and excretion → GHG emissions. | (Galloway et al 2010, Tian et al 2020, Yang et al 2021) | |
| Crop yield (D) | Harvested production per unit of harvested area for crop products (FAO). | Organic (manure, compost) and inorganic (N, P, K) fertilizers → over-enrichment of soils, inefficient N and P uptake by agriculture → in surplus residue in soils, NO2 and NO3 released to groundwater due to its mobile and soluble characteristic, less mobile P(PO4 3−) accumulate in soil → soil acidity impacting nitrogen fixation process, risk from accumulated P from organic fertilizers higher than N runoff into the lakes. | ||
| Fertilizer use efficiency (P) | Ratio of output of N or P in harvested crop parts to input (from fertilizer, manure, atmospheric deposition and biological N fixation). | (Bouwman et al 2009, Zhang et al 2020) | ||
| Fertilizer consumption (P) | The total use of fertilizers per unit of agricultural land for total crops production. | (Liu et al 2015) | ||
| N and P surplus (P) | The ratio of the total N and P available to the total uptake by crops and livestock. | (Shen et al 2011, Worrall et al 2015) | ||
| N, P leaching (P) | The total N, P from soil, leached into the sub-surface as a function of soil storage, soil properties and water percolation flux. | (Lewandowski et al 2015, Rosenberry et al 2015) | ||
| Lake Characteristics | Light availability (D) | Vertical light distribution through the water column. | Protein synthesis cells affecting algal growth, health of benthic habitat, altering light regimes impact hypoxic and anoxic zones, impacted by water temperature and transparency. | (Karlsson et al 2009, Chen et al 2016, Dou et al 2019) |
| Hydraulic residence time in lakes (D) | Ratio of lake water volume to the flowrate. | Nitrogen fixing capacities of the cyanobacteria, changing N:P ratios, influencing factor for phytoplankton population. | (Zhao et al 2022) | |
| N:P ratio in lakes (D) | The ratio of total nitrogen to total phosphorus concentration in the water column or sediment of the lake. | Seasonal occurrence of nitrogen fixing and non-nitrogen fixing bacteria, external atmospheric as well as N and P loadings from human activities on land, (+) denitrification and sediments resuspension of P. | (Collins et al 2017, Tong et al 2020) | |
| Lake depth (D) | The total lake volume to the surface area. | Stratification, predictor of total N and P concentration in lakes, (+) nutrient buffer capacity, wind-induced resuspension of sediments, varying effect depending on latitude and elevation. | (Janse et al 2010, Liu et al 2010) | |
| Fishing and Aquaculture | Fish catch (D) | The decrease in Catch Per Unit of Effort (CPUE) indicates overfishing. CPUE. | Two way effect: grazing by phytoplanktivore and detritivore fishes important for balance of phytoplankton biomass, improper fishing management (e.g. use of destructive gears, capture of immature fish without time for recruitment, introduction of non-native(or new) species) alter food web dynamics; and high nutrient inputs change vegetation density leading to anoxia and fish kills. | (Nguyen et al 2016, Deines et al 2017, Birk et al 2020) |
| Dissolved solids in untreated aquaculture effluent (P) | Total N and P concentration in the discharged effluents of farming ponds. | Sourced from fish feed and fertilizers i.e. total ammonia nitrogen and phosphate in fertilizers, additional P from fish fecal and food pellet waste direct effluent discharge to the freshwater lakes → oxygen depletion along water depth, influence nitrification and denitrification processes. | (Guo and Li 2003, Findlay et al 2009, Preena et al 2021) |
(D) is driver, (P) is pressure, (+) is increase in indicator or specified process, (−) is decrease in indicator or specified process, (↑) is high in terms of nutrients, and (→) is the cause or lead to. Definition of the indicators in this table imply spatial or temporal changes at a lake basin level unless otherwise stated.
3.2.1. Hydro-climatology
The key indicators of hydro-climatology drivers are temperature, precipitation, floods and droughts. An increase in surface water temperature is positively correlated with an increase in air temperature and a decline in water availability. The latter reduces the thermal capacity of water and increases the sensitivity of water bodies to atmospheric warming (van Vliet et al 2011). Higher temperatures and evapotranspiration also cause droughts impacting the bio-physical processes on land that directly influence nutrient concentrations in lakes (Vicente-Serrano et al 2020). Examples of impacted processes are enhanced internal P recycling (Nazari-Sharabian et al 2018) and denitrification processes (Ballard et al 2019), possibly leading to regime shifts (van Cleave et al 2014). A recent study by Woolway and Merchant (2019) projected a higher annual mean lake surface temperature of 2.5 °C and an increase of extreme temperature of 5.5 °C for a medium–high emissions scenario (RCP 6.0) worldwide for 2080–2100 relative to the period of 1985–2005. This can result in less frequent and reduced lake mixing regimes with earlier stratification that ends later (Woolway et al 2021b). It further leads to increased light availability favorable to promote phytoplankton communities and alter species composition creating ecological stress (Kim et al 2018). The thermal structure of lakes are also associated with deep water temperatures and vertical thermal gradients that potentially govern vertical mixing and alter dissolved oxygen levels (Friberg 2014). Studies even indicate variations of these processes in shallow and deep lakes (Kosten et al 2012, Pilla et al 2020, Zhao et al 2022) although an optimum temperature of 25 °C seems to favor the growth of harmful species of cyanobacteria and dinoflagellates (Butterwick et al 2005). However, there is new evidence of their physiological adaptations such as the favor of small sized cells to stay buoyant in a water column to further high photosynthesis (Glibert 2020) that need research attention to understand the impact of nutrient dynamics under the influence of lake temperature.
Next to this, drought impacts water availability and water levels (Aldous et al 2010). This may increase nutrient concentration (Vicente-Serrano et al 2020) and water temperature alike, which influence internal processes like denitrification, (van Vliet and Zwolsman 2008, Glibert 2017, Jankowiak et al 2019) and resuspension from the hypolimnion in lakes (Mosley 2015). This particularly increases primary productivity (also due to low flushing rates) (Mosley et al 2012) thus reducing water clarity and oxygen levels (Genkai-Kato and Carpenter 2005). Under the conditions of low flow, the water nutrient concentration can remain high due to prolonged lake residence times and resulting sediment-water column exchanges (Meerhoff et al 2022). This is ideal for the incubation and growth of algal blooms enhancing eutrophication risks (Nazari-Sharabian et al 2018). In some cases, lower N and P loads in inflows into lakes are observed during droughts attributed to the reduced surface and subsurface flows. This may lead to increased nutrients accumulation in the soil (Alvarez-Clare and Mack 2011) and particularly slower denitrification under dry conditions (Greaver et al 2016). However, in-lake concentrations of N and P can still be high due to constant point source discharges and reduced dilution capacity under lower water availability (Mishra et al 2021).
Similarly, changing spatial and temporal precipitation patterns impact algal bloom formation and occurrence (Paerl et al 2011) in lakes by on-site mobilization and the off-site transport of dissolved and sediment-absorbed nutrients (from upstream areas into the lakes) via three pathways: (i) transport of the N and P from land (farm and livestock, urban areas) to lakes via runoff (Roy and White 2012, Bargu et al 2019, El-Sheekh et al 2021); (ii) in-stream processes (altering nutrient fluxes and internal cycling due to increased delivery of sediments) (Schindler et al 2012, Coffey et al 2018, Romero et al 2020); and (iii) nutrient leaching to groundwater. Studies show a decrease in soil N and P concentrations (Hafeez et al 2019) but high nutrient (Ballard et al 2019) and sediment loads (Ramos et al 2018) transported via surface runoff that are attributed to intense precipitation and floods. Apart from the impact on nutrient loads, precipitation and subsequent surface runoff may affect cyanobacterial blooms and phytoplankton in lakes, by altering mineralization, concentration of solutes, water temperature, and the proportion of sediments (Greaver et al 2016) as well as by influencing internal nutrient cycling from changes in nutrient ratios (TN:TP) (Dodds 2007). In addition, future projections of precipitation under climate change show increases in annual TN and TP loads and sediments (Ockenden et al 2017, Qiu et al 2021) due to flushing. Additionally, reduced water levels attributed to precipitation variability were found to impact fish abundance and average size (Sanon et al 2020).
There are concerns in the synergistic effects from growing flood-drought regimes are recognized because they favor the incubation of algae and bloom development, however limited understanding exists regarding these flood-drought events. For instance, in 2015 heavy precipitation 7 inches from the upper catchment of Lake Erie transported large amounts of bioavailable and reactive phosphorus leading to the outbreak of cyanobacterial blooms during summer (Coffey et al 2018). In some cases, floods can limit the photosynthetic activity of the blooms by flushing (depending on the residence time of lakes) the biomass from the lakes, while also increasing nutrient emissions due to sewage overflows from urban areas. In addition, Qiu et al (2021) reported complex interactions of drought and precipitation events leading to the rapid flushing of accumulated sediments and nutrients influenced by soil water content, antecedent drought duration and other climatic variables. (Reichwaldt and Ghadouani 2012) analysed the effect of rainfall patterns on toxic cyanobacterial blooms and reported that: (i) increased frequency will reduce bloom occurrences due to disturbances in stratification, however (ii) the length of the dry period before rainfall combined with the intensity decides the ultimate effect of nutrient enrichment in lakes.
3.2.2. Socio-economy
The key socio-economic indicators of drivers are population density, gross domestic product (GDP) and water abstraction. Population growth and affluence (linked to GDP) are known global stressors that have resulted in increased N and P loadings in freshwater basins (Li et al 2019a, Olokotum et al 2020, Gilarranz et al 2022), which in turn stimulate cyanobacterial blooms. For example, (Duan et al 2009) studied the Lake Taihu basin from 1998–2007 and found a high correlation between annual duration and the initial blooming date of cyanobacterial blooms with total GDP and GDP per capita, outweighing climatic impact. Sometimes, the nutrient emissions due to a temporary increase of population by tourism play a role in the seasonal nutrient emissions (Guo et al 2001, Liu 2017) but are not always estimated. Further assessments of quantitative relationships related to population density, GDP and algal bloom occurences in lakes are required due to known linkages realized between economic development, nutrient emissions and eutrophication (Song et al 2021, Fang et al 2022).
To meet the rapidly growing freshwater demand, maintaining water quality is vital (van Vliet et al 2017). To meet the sectoral demands (e.g. agriculture, industry, domestic use), water abstraction directly from lakes or upstream area can lead to lower lake levels as well as reduced lake inflow (Hampton et al 2018). Water level decline can promote eutrophication and cyanobacterical blooms (Wu et al 2018) generally attributed to increased residence time, light availability and the internal nutrient loads especially in sediment-rich lakes (Hilt 2016). Additionally, Li et al (2020) reported high nutrient concentration during low water levels especially in dry season due to lower dilution capacity. On the other hand, an increase in water abstraction caused by more intense human activities in the lake basin are often associated with increased nutrient loadings into the lakes through return flow. Flint et al (2022) reported 417 kt nitrate-nitrogen (NO3-N), equivalent to 2% of global N-abstraction flux, is annually retained due to freshwater abstraction for the United States. But spatial or temporal distribution of the nutrient fluxes in the return flow due to human water use is largely unknown for lake basins. Their consideration in nutrient budgets is highly relavant for long-term nutrient management. There are still significant gaps in lake-response curves integrated with multiple indicators to connect basin nutrient loads to physical and biogeochemical impact in lakes (Mohamed et al 2019, Ersoy et al 2020). Other uncertainties driven by socio-political factors like friction to planning policies, conflicts of interests between various users and political interference pose challenges for developing future quantitative projections of nutrient loads to lakes.
The key socio-economy indicators of pressures are wastewater treatment and access to sanitation. About 80% of the wastewater generated is estimated to be directly discharged into the environment without treatment (WWAP, UNESCO 2017) while a recent assessment of Jones et al (2021) suggest that this number is in the order of 50%. The inadequate wastewater collection and treatment increases risk from nutrient loads in lakes and rivers (van Puijenbroek et al 2015). Point source control of nutrient pollution has been studied since the 1960s (Sawyer 1968, UNDP and GEP 1999) and resulted in management actions such as P removal in the detergents. The nutrients in human waste i.e. urine and feces depends on dietary pattern, mainly proteins (Rose et al 2015) and significantly contribute to global N and P flows (Morée et al 2013). van Puijenbroek et al (2019) evaluated a possiblity of decrease in future nutrient discharges globally from wastewater, by incorporating at least tertiary treatment in developing countries and advanced treatment in developed countries. Tong et al (2020) demonstrated higher P removal capacities (∼90%) than N (∼60%–70%) led to higher of TN:TP ratios in lakes, conducive for non-N2 fixing cyanobacteria such as Microcystis, Planktothix. In addition, the removal of bioavailable nutrients from the treated wastewater and sludge management are of concern to reduce their eutrophication potential (Preisner et al 2020, Kakade et al 2021, Preisner et al 2021).
The expansion of the wastewater treament network and its subsequent reuse reduces pressure on freshwater withdrawal by increasing freshwater availability and reducing the risk of waste loads. There are global efforts to expand access to sanitation especially both in rural and urban areas of developing countries. For instance, Tong et al (2017) observed the reduction of N loads in the lakes of China linked to improved sanitation facilities and indicated a potential reduction of future N discharges for less-developed regions through improved sanitation. Similarly, Fuhrmeister et al (2015) quantified N and P emissions due to inadequate sanitation in 108 low- and middle-income countries and found high nutrient pollution due to human excreta in densely populated regions like India, Comoros, Bangladesh, Rwanda and Haiti. While these emissions were low in other densely populated countries such as Chile due to improved sanitation infrastructure, to achieve maximum nutrients removal before disposure to freshwater, the study demonstrated the need to combine sanitation access with wastewater and sanitation treatment efficiencies. Research trends also indicate assessments to integrate human waste, especially from rural areas with on-site treament as a potential fertilizer resource for agriculture (Akram et al 2019, Harder et al 2020, Kelova et al 2021) as well as to manage lake water quality.
3.2.3. Land use
The key land use indicators of drivers are agricultural, urban and natural green areas. There is growing pressure on land to meet the increasing population demand and economic development (Lambin and Meyfroidt 2011, Stehfest et al 2019) and land-use change is therefore a global concern (Hurtt et al 2020). Land-use changes are reported to alter basin edaphic properties that influence their long-term nutrient dynamics causing eutrophication (Keatley et al 2011, Borrelli et al 2017, Njagi et al 2022). The land use condition impacts surface conditions, the overall runoff and erosion response to precipitation and resulting water and sediment flows (Chang et al 2008) thereby linked to nutrient transport and delivery to lakes (Zia et al 2016, McLellan et al 2018). Agricultural lands are hotspots of point, diffuse sources of N and P due to fertilizers use (Lu and Tian 2017) and improper fertilizer management (Withers et al 2014). Urban areas can have high population density, impervious surface, inadequate sewage and stormwater infrastructure, heavily contribute to point source nutrients discharge (McLellan et al 2018, Teurlincx et al 2019a, Strokal et al 2021). Geologic records of diatoms, algal biomass and nutrients in lake sediments are used to study the land-use change and its impacts on lakes. Such long-term studies can evaluate baseline conditions for lake nutrient status (Battarbee et al 2005, Bradshaw et al 2006, Leavitt et al 2009, Battarbee et al 2011), useful to set water quality targets, and further understand their sensitivity to interactive effects of changes in the landscape and climate (Smol and Cumming 2000, Pham et al 2008, Battarbee et al 2012). The review by Dubois et al (2018) highlighted the need to specifically use the global long-term records to investigate effects on an aquatic ecosystem functioning to better understand their linkages with landuse changes.
Natural green cover such as wetlands and floodplain ecosystems, which are located upstream of lakes act as natural sinks that retain or uptake nutrients (Knowlton and Jones 1997, Atkinson et al 2019). Nutrient retention (Janse et al 2019), transformation (Dupas et al 2015) and denitrification (Wu et al 2019) are key nutrient (re)cycling mechanisms in this context. The decline of green cover threatens the release of long-term stored nutrients to downstream lakes, while the advancement of upstream natural green cover provide opportunities to improve nutrient buffering and retention to control lake eutrophication (Yang et al 2020). Liu et al (2019) observed a decline in the nitrogen and phosphorus loadings in Changan Lake attributed to upstream wetland area. Cheng et al (2020) showed spatially targeted restoration, particularly in nutrient hotspot regions, can increase N removal from wetlands and reduce the loadings to downstream. The direct impact of natural green cover on algal bloom development in lakes is not exactly known. Studies that quantify nutrient accumulation and removal efficiencies are needed to incentivise decision-making on the protection of wetland ecosystems and management of downstream water quality. The effects of hydrological and seasonal variability in wetlands impacting nutrient dynamics are also understudied (Cheng et al 2023). Thus, to reduce nutrient loadings into lakes, proper land management practices, conservation of wetlands (Álvarez-Rogel et al 2020) and sustainable agriculture technologies, practices, and drainage management (Álvarez et al 2017), together can be beneficial.
Land TN and TP inputs is the key indicator of pressures in the land use theme. It is an important metric for the overall nutrient budgets in lakes. Nutrient emissions from indicators such as wastewater treatment (point source), nutrients from cropland and livestock (diffuse), hydrologic connectivity (nutrients retention) of a basin can be collectively used to determine the total nutrient inputs from land. For instance, Horppila et al (2019) used the catchment to lake area including all landuse types as a metric to evaluate the eutrophication risk of lakes. Silvino and Barbosa (2015) performed an integrated analysis to examine the trophic state of Lake Sumidouro linked with catchment land use, land occupation and lake morphometry. However, much research is required to understand interactions of basin nutrient inputs from different sources, nutrient retention on landscapes and in rivers to analyze their cumulative impact in lakes (Pirrone et al 2005, Damania et al 2019, Birk et al 2020, Wang et al 2021). The assessment of this indicator can provide clarity in the overall nutriet budgets in lakes that aids the study of sources of nutrient emissions impacting their fluxes and eutrophication potential to design feasible measures for eutrophication control.
3.2.4. Lake characteristics
The key lake characteristic indicators of drivers are lake N:P ratio,light availability, hydraulic residence time, and lake depth. Lake characteristics could explain their vulnerability to algal blooms and variation in response to nutrient concentrations among lakes (Janssen et al 2021a). For instance, nutrient stoichiometry (i.e. TN:TP ratio)-informs management on the control of external loading and internal storage (Tong et al 2018) and trophic interactions (Dodds 2007). In recent decades, studies of co-limitation and dual nutrient control has taken precendance over the historical paradigm of phosphorus limitation in lakes (Lewis and Wurtsbaugh 2008, Sterner 2008, Paerl et al 2016). Mesocosm studies on primary productivity of shallow lakes resulted in favorable growth and the increase of a phytoplankton biomass with N and P enrichment, compared with N or P enrichment separately (Zhang et al 2015, Ding et al 2019). Zhou et al (2022a) revealed low TN:TP ratios and high probability of N and P co-limitation, was prevalant in eutrophic waters and urged the assessment of lake trophic status to evaluate dual nutrient control. A shift from the nitrogen fixing cyanobacteria species to non-nitrogen-fixing cyanobacteria recognized dual control of N and P loads as a nutrient management strategy in Lake Erie (Lewis et al 2011). The largest freshwater lakes in the Chinese eastern plain (e.g. Lake Taihu, Poyang, Chaohu) demonstrated low N:P induced growth of nitrogen fixing cyanobacteria that would be further exacerbated due to PO4 3− in sediments often promoted by temperature increase (Zhao et al 2022). In large lakes of North America and Europe, low N:P combined with low silica and carbon supply rates led to early onset of cyanobacterial blooms and replace spring diatoms in some cases (Schindler 2006). The seasonal variability of the phytoplankton biomass proved control of N-input into Lake Taihu is critical to control severity, extent and duration of cyanobacterial blooms, in addition to the abatement of P-input (Xu et al 2010). The seasonal activities of the nitrogen fixing and non-nitrogen fixing bacteria are regulated by this ratio (Schindler et al 2012) and modeling studies indicate that certain species (Stephanodiscus, Aphanocapsa) possess adaptive traits that enable them to exploit the prevailing seasonal flow (Elliott and Defew 2012).
Similarly, the vertical light distribution determines physiological processes such as protein synthesis in cells that directly affect algal growth. An optimal light intensity is known to govern the benthic habitat of shallow lakes by controlling the phytoplankton growth and biomass. Dou et al (2019) evaluated 16 light-nutrients scenarios and observed algal growth inhibition for low light conditions, despite increased nutrient concentration with a decline after a threshold irrespective of the light intensity. Also, the effect of increased phosphorus on algal growth was found to be greater than nitrogen under constant light conditions. Whereas primary production in unproductive lakes is suggested to be controlled by organic matter through light attenuation, which is inconsistent with the philosophy of nutrient-limitation (Karlsson et al 2009). In contrast, in the higher latitudes, invasive cyanobacterium S aphanizomenoides—predicted to become a nuisance species in the future—showed growth even in poor light conditions due to increased total phosphorus in the lakes (Budzyńska et al 2019). Already eutrified lakes have reduced water transparency and influence the vertical light distribution affecting the growth, distribution, and species interaction of the submerged macrophytes (Chen et al 2016), which further lead to hypoxic or anoxic conditions or both (Yang and Hao 2008), and alter the trophic levels.
Early studies by Vollenweider (1968, 1975, 1976) and Schindler (1978) quantified external phosphorus loadings from water, in-lake P concentration and primary production in the water column as a function of mean lake depth and residence time. These findings set concerted efforts for permissible TP loads to lakes from the drainage basin. Hydraulic residence time can determine lake nutrient retention and their transformation processes. It can thus be a management tool to alter stratification, internal nutrient loads and potentially regulate bloom development (Olsson et al 2022). However, the long-term success of reduced residence time depends on the nutrient input, its source, specific form and water-column retention (Elliott et al 2009, Glibert et al 2018, Sheferaw Ayele and Atlabachew 2021, Huang et al 2023). Short residence times inhibit nitrogen fixing capacities (of cyanobacteria), changing N:P ratios and reduced light utilization rate depending on internal loads in sediment-water column (Zhao et al 2022). On the other hand, the increased phosphorus from point sources led to a decline in chlorophyll, while it increased for increased diffused P sources (Elliott et al 2009) which are more pronounced for summer flows. As a general rule, for the control of algal growth in mixed lakes, it is suggested that retention times that are longer than the doubling time of planktonic algae promote biomass development at a scale that might be problematic (Hilton et al 2006). Warming temperatures and intense precipitation with episodic nutrient inflow pose a serious threat of bloom profileration in lakes with longer residence time and require urgent attention (Malmaeus et al 2006).
The impact of nutrient enrichment is dependent on lake depth and influence key in-lake biogeochemical processes such as denitrification rates, sedimentation, stratification, oxygenation and nutrient fluxes across epilimnion, metalimnion and hypolimnion (Qin et al 2020). Zhou et al (2022b) showed a decreasing trend for trophic levels of the lakes with increasing depth, in particular the hypereutrophic status was confined to shallow lakes. In such lakes the P loadings are more prevalent due to wind-induced resuspension of sediments dependent also on the sediment density and sand content (Abell et al 2022). For example, sediments rich in clay contents bind P under aerobic conditions and releases P under anaerobic conditions. While Liu et al (2010) found that larger lake depths (deep lakes) are negatively correlated to chlorophyll-a concentration due to increased buffer capacity and plays an important role in the assessment of trophic status. Understanding critical thresholds for nutrient loadings play an important role in nutrient management, by allowing comparison with input loads, as the values differ for each case depending on lake depth, residence time and vertical nutrient dynamics (Janse et al 2008, Janse et al 2010, Lürling Mucci 2020). There are future research opportunities to implement the characterisation of phytoplankton dynamics in the context of global changes (Vadeboncoeur et al 2008, Vinçon-Leite and Casenave 2019). While the prediction of nutrient ratios is difficult due to the complex and varible response of lakes across scales and ecological context, it is an essential metric to understand effects on primary productivity and the potential implications on eutrophication control (Collins et al 2017, Tong et al 2018).
3.2.5. Crop farming and livestock
In section 3.2.3 we explained how the agricultural area is amongst the key land use drivers and is the largest contributor of N and P emissions globally (Hong et al 2021). A separate theme on crop farming and livestock is considered to explain the main processes on the agricultural land responsible for lake eutrophication. Crop yield is the key indicator of drivers in crop farming. The intensification of agriculture meeting the growing global food demand has emphasised high crop yields forcing the use of mineral fertilizers (Liu et al 2015). Essentially, two categories of fertilizers exist to ensure crop yield i.e. organic (manure, compost) and synthetic (N, P, K) (Khan et al 2018). The continuous application of fertilizers has led to surplus residue of N and P in the soils (Shen et al 2011, Worrall et al 2015, Zhang et al 2021a). The consequence of high N, particularly NO3, NH4 (Worrall et al 2015), soluble reactive phosphorus (SRP) (Maccoux et al 2016) and high nutrient stoichiometry (TN:TP) in soils (Penuelas et al 2020) is that high TP and TN loads enter lakes.
Fertilizer use, its efficiency, N and P soil surplus and nutrients leaching are the key indicators of pressures in crop farming. Lu and Tian (2017) reported that since 1961, the N and P fertilizer use rate on unit cropland areas increased eightfold and threefold, respectively. As a result, the N and P accumulate in the soils, especially within croplands and livestock landscapes (Bouwman et al 2013b). The excess nitrogen in the soils, which is very mobile and loosely binding to the soil, mainly leaches into groundwater in its most soluble forms (NO2 −, NO3 −) (Drecht et al 2003, Puckett et al 2011). The leaching of nutrients from point and diffuse sources to groundwater depends on the residence times, exfiltration or infiltration rates with lake, type of soil and nutrient concentrations amongst other factors (Lewandowski et al 2015, Loewald et al 2020). On the other hand, P is less soluble and mobile, is either lost in runoff in the form of dissolved and particulate P, that gets stored in sediments of lakes or absorbed to soil for longer timescales (Bouwman et al 2009, Yang et al 2013). Historical understanding of residual P can determine its potential to decrease current and future fertilizer applications. The spatial quantification of P legacies on croplands, at least on a local scale, can identify vulnerable regions for management interventions (Pavinato et al 2020). By further integration with cropping patterns, precise management, climate and soil type can provide optimised estimates of excess soil nutrients as a resource (Rowe et al 2016). Bouwman et al (2016) and Bhattacharyya et al (2021) suggested high N and P fertilizer use efficiency integrated with crop, irrigation, nutrient and runoff management considering the impact on downstream surface waters can guide policy making.
Similarly, improved prosperity from global economic production is changing the dietary patterns of people and driving the production of meat and milk (Alexander et al 2015). The intensive livestock industry associated with the production of ruminant animals (cattle, sheep, goats and camels), monogastric animals (pigs, poultry, horses and other small fur animals) and poultry (chicken, ducks, turkey, geese and guinea fowl) is a big emittor of nutrients (Liu et al 2017) that enter lakes. Future assessment of demands anticipate a pattern shift from poultry or pork, to more beef (Godfray et al 2018). Relatively, the N excretion and manure production per kg of meat is less for poultry and pork than beef (Bouwman et al 2013b) implying higher nutrient emissions in the future with the changing dietary patterns. This also contributes significantly to the greenhouse gas emissions (e.g. NxO, NH3) in livestock intensive areas (Springmann et al 2018). Three types of production systems are generally adopted globally—grazing (milk and meat), mixed (family owned to more managed) or specialized systems (large-scale industrial)—which play a role in reducing nutrient flows through integrated management (FAO and ILRI 2011). Also, the increasing agricultural trade requires the integration of these production systems and nutrient budget assessments for future policies and management (Schipanski and Bennett 2012).
The key indicators of pressures in livestock are livestock density and atmospheric deposition of N. Livestock density is directly correlated to the increase in meat and milk consumption (Kanianska 2016). Feed crop production and use of mineral supplements are increasing to aid livestock growth and boost productivity (Devendra and Sevilla 2002, Spiertz and Ewert 2009, Ray et al 2022). Typically, the import of animal feed motivates the food production system as the boundary condition to estimate the nutrient balance in livestock systems and therefore also includes fertilizer application (high yields) and resultant surplus residues in soil (Schipanski and Bennett 2012, Liu et al 2017). Livestock trampling on pasture lands causes a secondary impact, such as soil compaction, that increases soil erosion, surface runoff and increases the delivery of nutrients to lakes (Sivakumar 2007, Zacharias et al 2008, Laspidou and Samantzi 2014, Vero and Doody 2021), particularly with high livestock density. On the other hand, livestock excreta is an important nutrient source to the soil and the amount of N and P vary depending on the animal weight, diets and livestock production systems (Sheldrick et al 2003). Animal manure is a traditional source of N and P in crop-livestock farming that threatens eutrophication and hypoxia (Bian et al 2021). Thus, nutrient use efficiency (increased feed efficiency) and proper manure management, such as storage, recyling and its proper application on cropland, can regulate nutrient loads to surface waters by livestock (Bouwman et al 2013b, Strokal et al 2016).
The major anthropogenic nitrogen gas emissions from fertilizer use and the handling of animal manure are ammonia (NH3), nitrous oxide (N2O) and nitric oxide (NO) (Galloway et al 2010, Uwizeye et al 2020). A part of the soil nutrient stocks is lost to the N atmospheric deposition after soil N2O emissions and this amount is not always well-quantified but eventually enriches soils elsewhere (Tian et al 2020). N2O from agricultural soil is of the highest concern due to its global warming potential between 265–298 times greater than CO2 (IPCC 2014). NO and NH3 are also known to significantly contribute to N2O in soils (Cameron et al 2013, Pan et al 2022). Yang et al (2021) found that 25% of the soil N2O emissions was induced by atmospheric N deposition with a projected 80% increase in N deposition and a 241% increase in cropland N2O for RCP 8.5. Qasim et al (2021) estimated N2O and N leaching losses of 0.067 Tg N2O-N yr−1 and 97 ± 22 kg N ha−1yr−1 respectively from a meta-analysis for vegetable production in China mainly due to excessive fertilizers and low (15–35%) nitrogen use efficiency. Additionally, ammonia released during nitrification from fertilizers and manure returns to soil through wet or dry deposition and impacts water quality (Leip et al 2015). Bergström and Jansson (2006) found that increased N deposition in the unproductive lakes of northern hemisphere increased inorganic N inputs, causing eutrophication and the increase of phytoplankton biomass. Similar studies from Xu et al (2018) and Zhan et al (2017) demonstrate the need to integrate the assessment of atmospheric N deposition with the external N inputs which otherwise may lead to potential underestimation of lake nutrient budgets and impact water quality.
3.2.6. Hydrology and water management
The key hydrology and water management drivers identified are hydrologic river connectivity and irrigation water use efficiency. We know that the competing upstream freshwater demands, and the associated construction of reservoirs worldwide, have impacted the downstream lake water quality (Heino et al 2020, Jumani et al 2020). Natural geomorphological processes such as sedimentation also fragment the rivers and alter system connectivity (Doretto et al 2020). The lateral (to floodplain) and longitudinal (fragmentation) river connectivity in a basin are important in understanding spatiotemporal responses of rivers to external disturbances and nutrient retention mechanisms (Tockner et al 1999, Wohl 2017, Zhang et al 2021b) causing algal blooms in lakes. Lakes are connected to rivers in three ways: (i) permanently; or (ii) pulsing; or (iii) isolated and there are three nutrient exchange pathways in these ecosystems: (i) floodplain to rivers, (ii) rivers to floodplain, and (iii) rivers to lakes.
Kufel and Leśniczuk (2014) identified that hydrological connectivity was driving higher inorganic nutrients (DIN, SRP) and chlorophyll concentrations in connected lakes as compared to the isolated lakes. On the other hand, Castillo (2020) revealed higher nitrate removal in connected lakes while higher phosphorus and chlorophyll concentrations were observed in isolated lakes. This favored phytoplankton and biomass accumulation due to low turnover rate and high transparency in lakes. Further, higher nitrate was observed in lakes upstream with exception for lakes receiving groundwater discharge, while P varied depending on the riverine loadings and sediment loading from the floodplain. Finally, the construction of dams and reservoir operations alter flow regimes and impede the transport of sediments and nutrients along the river network. The nutrients in the reservoirs are transformed from dissolved to particulate forms through primary productivity or adsorption and gaseous elimination by atmospheric fixation (Maavara et al 2020) also influencing fish diversity (Shao et al 2019). Accounting for these processes, the incorporation of both nutrient and sediment delivery and in-stream nutrient retention linked to connectivity, are important in nutrient load assessments when analyzing the impact of multiple disturbances (Amoros and Bornette 2002, Bouwman et al 2013a). The reservoir operation and management for water withdrawal based on characterisation of local stratification has shown to eutrophication control downstream. While most of the evidence exists for temperate climate, there is interest towards understanding such interventions for tropics, due to dams (Scott Winton et al 2019, Calamita et al 2021).
As explained in section 3.2.5 due to intensified fertilizer application, nutrients accumulate in soils and promote leaching into groundwater and contribute to legacy nutrients. Over-irrigation is a known problem that leads to anoxic conditions, nutrients leaching from the root zone and decrease crop yields (Blanco-Canqui 2018, Kumar and Kumar 2018). Li et al (2018) conducted an experiment for cucumbers under a double-cropping system and reported a significant reduction of nutrients leaching under optimal irrigation water scenarios due to increased irrigation water use efficiency. Liang et al (2020) discusses that field-scale water management can significantly reduce nitrogen leaching for a study that reports high total dissolved nitrogen leaching in vegetable production systems but contribution from dissolved organic nitrogen was much higher for cropping systems with manure fertilization. Irrigation systems such as variable rate irrigation using sprinklers can reduce nutrients leaching as well as surface runoff and nutrient delivery to lakes (O'Shaughnessy et al 2019) and drip irrigation can save more than 30%–50% of fertilizer application (Fan et al 2020). Additionally, fertigation systems, i.e. controlled fertilizer input through optimized water supply to crops, reduces water consumption and fertilizer inputs (Aziz et al 2021).
Groundwater nutrient storage is the key pressure identified under this theme. Traditionally N-rich fertilizers were more commonly used than P-rich fertilizers that lead to increase in the soil N:P ratio. This influenced the total terrestrial budgets of N and P while impacting the aquatic ecosystem. In addition, the legacy effects of these nutrients elevate the concern of the long-term impact in surface water and groundwater (Chen et al 2018). The groundwater-lake interaction mechanisms and properties like exfiltration, groundwater discharge, hydraulic conductivity and topography govern the N and P transport to the lakes via baseflow (Lewandowski et al 2015). The transfer of legacy nutrients via groundwater has only recently gained attention (Schilling et al 2012, Rudolp 2015). Longer residence times of groundwater provide opportunities for microbial reactions depending on redox states that alter nutrient availability and can promote algal blooms (Brookfield et al 2021). However, mitigation of N and P contamination in groundwaters is a growing concern not only to control eutrophication in lakes but also to protect drinking water quality (Petit et al 2008).
Ascott et al (2016) first estimated the nitrate storage in the vadose zone for England and Wales, indicating its importance in terrestrial nutrient budgets and Ascott et al (2017) followed up with estimation for global scale and identified that greatest nitrate storage in groundwater during 1900–2000 was in North America, China, and Europe with thick vadose zones and extensive historical agriculture. Especially denitrification in the subsurface settings add uncertainty to the atmospheric deposition of nitrogen and the estimation of total nitrogen budgets (Puckett et al 2011, Wang et al 2012). On the other hand, phosphorus in groundwater is driving the lake-nutrient budget in many cases. For example, evidence suggests 53% of overall external P load in Lake Andersee was from lacustrine groundwater discharge (Meinikmann et al 2015). Similarly, the transport of dissolved inorganic phosphate through groundwater seepage (75%–81% of lake water budge) at the aquifer-lake interface was observed to enhance eutrophication in Lake Vaeng, Denmark (Kazmierczak et al 2020, Kazmierczak et al 2021).
3.2.7. Fishing and aquaculture
Fish catch is identified as the key indicator of drivers of this cross-cutting theme. In order to meet the global increase in protein demand since the 1950s, fishing and aquaculture have increased in many freshwater bodies (Welcomme 2011, McIntyre et al 2016, Deines et al 2017) and have become important economic activities to support food demand through import and export (Jia et al 2013, Lynch et al 2016). Until recently, overfishing has led to sharply declining trends in the total fish catch, especially in the largest lentic freshwater systems such as Lake Victoria, Lake Baikal and Lake Tana (Gebremedhin et al 2018, Njiru et al 2018). In addition, due to negligent fishing activities, such as the use of destructive fishing gears (Hampton-Smith et al 2021), the capture of immature fish without enough time for recruitment and the introduction of non-native (or new) species into the lake, have altered the food web dynamics (Yongo et al 2021) and increased the risk for eutrophication. Also, in the upstream of lakes, reservoirs reduce hydrologic connectivity and restrict the migration of spawning fish (Shao et al 2019).
The native fish diversity and species interactions are known to limit eutrophication potential of lakes through grazing by phytoplanktivore and detritivore fishes (Gophen 2015, Njiru et al 2018, Abell et al 2022). The phytoplankton biomass and chlorophyll concentrations can decrease due to increased fish biomass and cascading trophic interactions (Carpenter et al 1985). Altering fish biomass to increase grazing of phytoplankton is a food web manipulation tool to regulate the algal dynamics and manage water quality, particularly in shallow lakes (Benndorf 1987, Jeppesen et al 1997, Mehner et al 2002, Goto et al 2020). On the other hand, external nutrient inputs promote algal growth and change vegetation density. This potentially increases anoxia leading to the decline of species or fish kills in most cases. The blooms also impact the abundance and diversity of the fish, threatening food security, as well as threathening human health due to the bioaccumulation of cyanotoxins (Onyango et al 2020). Moreover, effects due to multiple drivers and pressures (e.g. temperature change, water abstraction, waste discharge) have been individually studied, but the combined impact on fish assemblages is unknown (Nguyen et al 2016, Bouraï et al 2020). Indicators such as fish composition, abundance and age structure are already used in the ecological assessment of lakes (Argillier et al 2013, Lyche-Solheim et al 2013, Jiang et al 2020). It is thus beneficial to consider the role of fish populations in assessments of eutrophication.
Dissolved solids in untreated aquaculture effluent is identified as the key indicator of pressures for fishing and aquaculture theme. In recent decades, overfishing and a decline in the total fish catch has led to a wide uptake of aquaculture (Ahmed and Thompson 2019). The contribution of aquaculture to the global fish production increased from 19.7% in 1990s to 49% in 2020 (FAO 2022a). Some of the popular inland aquaculture farming systems are open cage technology (Guo and Li 2003, Nijiru et al 2019) and recirculating aquaculture systems (RAS) (Ahmed and Turchini 2021, Ghamkhar et al 2021). In aquaculture production, the discharged effluent from excess fertilizers and solid waste i.e. fecal and fish feed, release nitrogen and phosphorus into the farming ponds (Ahmad et al 2021). Aquaculture production is often linked to rivers and lakes, and the discharge of these untreated effluents leads to nutrient enrichment that leads to the increase of phytoplankton biomass and impact the aquatic system (Findlay et al 2009, Lukman et al 2019). For example, in a spatial distribution study of nutrient pollution in Lake Toba, Indonesia, aquaculture waste accounted for 71% of total N and 75% of total P loads and was identified as a key pressure requiring management attention (Suffian et al 2018).
Research on the reduction of nutrient emissions by improving feed efficiency (e.g. precision nutrition, integrated multitrophic aquaculture to reuse nutrients for taxa like molloscus, algae or with livestock production) is vital for limiting eutrophication as well as for sustainable aquaculture (Zhang et al 2011, Bohnes et al 2019, Glencross 2020). Aquaculture is rarely found to be integrated in eutrophication assessments and with other dimensions of global changes. Newly growing aquaculture production is an opportunity to reduce the release of nutrients waste into the lakes. For example, some treatment techniques such as biological nitrification to remove ammonium, coagulation-flocculation for phosphate removal from sludge (Jegatheesan et al 2011, van Rijn 2013, Preena et al 2021) reduce nutrient loads from aquaculture effluents. Studies concerning aquaculture production processes that effect phytoplankton dynamics, is found to be particularly limited for lakes. However, it is gaining interest to promote sustainable aquaculture in the blue transformation programme (Edwards 2015, White 2017, FAO 2022b).
4. Conclusions and outlook
In this review we synthesized the main indicators of eutrophication for freshwater lake basins and mapped these indicators by developing a new causal network of the DPSIR framework. It highlights complex interrelationships among indicators that include the missing linkages of DPSIR elements, especially of the drivers and pressures. For instance, the direct links of drivers and pressures to the impact indicators is missing in the exisiting DPSIR framework. The causal network is a generic framework for integrated assessments, and the significance of individual links differ widely (e.g. climate, pollution sources). Tools such as comprehensive monitoring and modelling studies can be used to quantify these interactions in specific cases. The knowledge of multiple feedback mechanisms and interactions with lake basin conditions as viewed from different disciplines is urgently needed, particularly for developing countries with rapidly growing population, freshwater and food demand, to adopt sustainable water quality management. The estimation of safe operating space and planetary boundaries assessments for nutrients also mandates the integration of expertise across various disciplines (Gerten et al 2020, Kim et al 2020).
Our review on nutrient specific-mechanisms of the 30 key indicators (out of 58 indicators) of drivers and pressures using seven cross-cutting themes: (i) hydro-climatology, (ii) socio-economy, (iii) land use, (iv) lake characteristics, (v) crop farming and livestock, (vi) hydrology and water management, (vii) fishing and aquaculture; provides an interdisciplinary and systems analysis perspective necessary to understand the nutrient dynamics and address eutrophication in lake basins. Based on the literature analysis, we highlight the following main recommendations to improve the understanding of eutrophication dynamics in freshwater lake basins:
- The study of nutrient dynamics during floods and droughts has become an important area of research in water quality in the face of climate change. However, the complex cause-effect mechanisms in synergistic flood-drought events are poorly understood. One of the main challenges is the high temporal dynamics of nutrient processes during such events (e.g. daily or weekly). The increasing spatiotemporal information from satellites and drones can be combined with in-situ measurements to better understand the variability of nutrient processes and trends in flood-drought events. Further, developing hydrological or hydrodynamic models that couple the nutrient processes is beneficial. It is important to analyse nutrient loadings in conjunction with flow variables and landuse dynamics to develop robust nutrient relationships and assess the future impact of extreme events on nutrient dynamics.
- Legacy effects of the nutrients in the agricultural landscape have gained significant importance in water quality management. The study of these effects, however, is limited by the lack of long-term monitoring data, severely challenging assessments of pollution threats for groundwater and surface water quality. Its quantification has proven difficult and the legacy effect significantly contributes to additional uncertainty in the projections and the long-term management of lake nutrient concentrations. Besides estimating legacy effects, their assessment of their potential use as a resource in intensive crop production areas to reduce the application of fertilizers is an important area of research to advance sustainable management.
- The long-term nutrient dynamics impacting eutrophication potential in the lakes are modulated by upstream natural green areas, such as wetlands. They are at the risk of loss due to rapid urbanization. Studies to quantify long-term nutrients accumulation and their dynamics in these ecosystems can promote their protection and restoration. It is to retain their storage and buffer capacity and avoid the release of the stored nutrients into freshwater systems.
- There is a limited understanding on the adaptive capacities of harmful cyanobacterial blooms to the changing climate, nutrients and basin hydrology, while evidence suggests their adaptation to the changing environmental conditions (e.g. temperature increase). The cyanobacterial dynamics and its effects can be better understood by developing tools and methods to assess interactions of the individual species and its life cycle, with the surrounding biochemical mechanisms, changing climate and socio-economic factors.
- The lack of lake models integrating other water systems of the basin or limited representation of lakes in current large-scale modeling frameworks can be overcome by integrating the well-established knowledge from different disciplines. It can allow for considerable progress in integrated assessments to analyse specific physical, socio-economic and ecological impacts of nutrients. In addition to prioritizing coupling the models, combining in-situ data and emerging earth observation techniques (satellite products of lake water quality) can further fill the gap in water quality monitoring data. There is a need to overcome this data limitation for a better spatial and temporal (e.g. seasonal) understanding of water quality and avoid the unambiguous results for nutrient dynamics.
- The nutrient mechanisms in freshwater lakes are very complex, but it is highly important to assess the impact of eutrophication considering cumulative and interactive effects of multiple drivers and pressures. The drivers and pressures, such as from this study, can be used as proxies to develop historical trends of nutrients to better the nutrient dynamics under global changes.
The final conclusion is that the key indicators of lake eutrophication is of utmost importance to policymakers, practitioners and decision-makers to set realistic water quality targets and manage the freshwater quality in lakes. For instance, the current point source pollution in developing regions due to rapid population growth is very similar to historical trends witnessed in developed regions such as Europe and North America. The latter now suffer severe diffuse source pollution due to high intensity crop and livestock production systems. Extensive studies in these regions since the 20th century provided most of the fundamental knowledge on lake nutrient dynamics. While quantitative studies in developing regions are limited, it is essential to understand what and how lake responses differ in different climatic and development patterns. Nevertheless, there is a need to increase the number of integrated impact assessment studies globally for: (i) comprehensive assessments of causal relationships between indicators to assess short-term and long-term implications to water quality and its management across regions, and (ii) the application of lessons learnt from developed regions to benefit eutrophication management elsewhere, after they are carefully examined. We can further reflect from the review that the current impact could be worse due to changing climatic and environmental conditions. Arguably the most progressive policies of water management in the world, like the EU Water Framework Directive (European Commission 2000), do not consider different nutrient flows and pathways but rather focus only on cumulative concentrations (Wassen et al 2022). Indicators that holistically represent lake basins encompassing multiple sources and pathways can guide the global water quality efforts to manage our freshwater lakes, restore our polluted ecosystem and potentially mitigate the negative effects of climate change by enhancing the health, functioning and resilience of freshwater ecosystems.
Acknowledgments

This project has received funding from the European Union's Horizon 2021 research and innovation programme under the Marie Sklodowska-Curie grant agreement 956623. MSCA-ITN-ETN—European Training Network. inventWater (Inventive forecasting tools for adapting water quality management to a new climate) Project.
MTHvV acknowledges funding from NWO VI.Vidi.193.019 and the European Union (ERC Starting Grant, B-WEX, Project 101039426)
Supplementary data (0.5 MB DOCX)