

Abstract
Acute myeloid leukemia (AML) is a highly aggressive type of cancer caused by the uncontrolled proliferation of undifferentiated myeloblasts, affecting the bone marrow and blood. Systemic chemotherapy is considered the primary treatment strategy; unfortunately, healthy cells are also affected to a large extent, leading to severe side effects of this treatment. Targeted drug therapies are becoming increasingly popular in modern medicine, as they bypass normal tissues and cells. Two-dimensional MoS2-based nanomaterials have attracted attention in the biomedical field as promising agents for cancer diagnosis and therapy. Cancer cells typically (over)express distinctive cytoplasmic membrane-anchored or -spanning protein-based structures (e.g., receptors, enzymes) that distinguish them from healthy, non-cancerous cells. Targeting cancer cells via tumor-specific markers using MoS2-based nanocarriers loaded with labels or drugs can significantly improve specificity and reduce side effects of such treatment. SKM-1 is an established AML cell line that has been employed in various bio-research applications. However, to date, it has not been used as the subject of studies on selective cancer targeting by inorganic nanomaterials. Here, we demonstrate an efficient targeting of AML cells using MoS2 nanoflakes prepared by a facile exfoliation route and functionalized with anti-CD33 antibody that binds to CD33 receptors expressed by SKM-1 cells. Microscopic analyses by confocal laser scanning microscopy supplemented by label-free confocal Raman microscopy proved that (anti-CD33)-MoS2 conjugates were present on the cell surface and within SKM-1 cells, presumably having been internalized via CD33-mediated endocytosis. Furthermore, the cellular uptake of SKM-1 specific (anti-CD33)-MoS2 conjugates assessed by flow cytometry analysis was significantly higher compared with the cellular uptake of SKM-1 nonspecific (anti-GPC3)-MoS2 conjugates. Our results indicate the importance of appropriate functionalization of MoS2 nanomaterials by tumor-recognizing elements that significantly increase their specificity and hence suggest the utilization of MoS2-based nanomaterials in the diagnosis and therapy of AML.
Export citation and abstract BibTeX RIS
1. Introduction
Acute myeloid leukemia (AML) is a heterogeneous hematologic malignancy characterized by an accumulation of immature myeloblasts exhibiting poor differentiation and uncontrolled clonal proliferation in the bone marrow and peripheral blood [1, 2]. It is the most common leukemia in adults and is manifested with a low incidence rate and a relatively high 5 years survival rate in children and adults less than 45 years old; however, the incidence rate increases and 5 years survival rate decreases rapidly for people older than 60 years and the mortality rate reaches about 90% [3].
The conventional treatment approaches for AML are based on chemotherapy, targeted therapy drugs, radiation therapy or hematopoietic stem cell transplantation (HSCT). The standard induction chemotherapy regimen consists of a combination of cytarabine and anthracycline (especially daunorubicin) administered for 7 and 3 d, respectively. The aim of the '7 + 3' regime is to achieve a complete remission (CR); however, the results are not always satisfactory, as CR is achieved in 40%–60% of people older than 60 years and in 60%–80% of younger adults, while a post-remission therapy may be required to ensure a continuous remission [4–7]. Cytarabine and daunorubicin combined at a molar ratio 5:1, encapsulated in a liposome with a composition suitable for the uptake preferentially by leukemia cells, called CPX-351, is an alternative providing better results [8–10]. Radiotherapy is usually applied as a supplementary therapy to suppress AML that has spread outside of the bone marrow and blood and can be used in a preparation phase for HSCT [11, 12]. However, the outcome of an allogeneic HSCT is not consistently favorable, with nearly 40% of patients suffer a relapse with a poor prognosis [13]. In recent years, new drugs targeting specific proteins in leukemia cells have been approved for the therapy of AML (reviewed in [14]). Although they provide new options in the treatment of AML, administration of these drugs may be accompanied by several severe adverse effects, e.g. pulmonary problems [15], posterior reversible encephalopathy [16], Guillain–Barré syndrome [17], tumor lysis syndrome [18], neutropenia [18], hepatotoxicity [19], differentiation syndrome [16, 17, 20] or a prolonged QT interval [16, 17, 20, 21].
In addition to traditional or novel drugs for treatment of AML, use of nanomaterials represents another therapy approach, as nanosized drug delivery systems (DDSs) may help to circumvent shortcomings of standard procedures, such as low target selectivity, limited water solubility of therapeutic agents, poor cellular uptake that may lead to the development of drug resistance in cancer cells, inability to deal with metastases and systemic toxicity causing many adverse effects. Furthermore, nanocarriers can be suitably modified to cross biological barriers and are remarkable for their high specific surface area, providing a platform for loading a huge amount of a therapeutic drug and are likely to avoid kidney clearance. That ensures longer retention of DDSs in the blood while simultaneously reducing the possibility of a nonselective effect of the drug in the bloodstream, resulting in lower systemic toxicity and a higher tolerated dose [22–28]. The only nanomedicine approved for the treatment of AML is the aforementioned CPX-351. Other formulations exploiting passive or active targeting of AML cells are in clinical trials or under preclinical investigation (reviewed in [29]).
Transition metal dichalcogenides (TMDCs) are layered materials that have been intensively studied and utilized to produce a variety of nanomaterials in recent years. TMDC nanomaterials are remarkable for their unique physicochemical properties that differ from their bulk counterparts, leading to an increased interest in their potential applications in various areas such as electronics, photonics, energy storage, catalysis, sensing and nanomedicine [22, 30–34]. A great attention among all known TMDCs was paid to molybdenum disulfide (MoS2) [22]. It is available as a molybdenite ore [35] and crystalline MoS2 can be converted into MoS2 nanomaterials by mechanical [36] or laser thinning [37] and exfoliation techniques [38–41], while various precursors containing molybdenum and sulfur can be applied in synthetic techniques to acquire nanomaterials of desired size and shape [42–47].
Despite being relatively chemically stable, several strategies have been developed to functionalize MoS2 nanomaterials through coordination chemistry, direct covalent bonding of C and S atoms or physisorption and chemisorption, providing opportunities to modify the properties of MoS2 nanomaterials to suit the application at hand [48, 49]. In terms of their use in nanomedicine, it is necessary to increase the colloidal stability and biocompatibility of MoS2 nanomaterials while providing the platform for adsorption or covalent binding of various diagnostic or therapeutic agents [50–52].
MoS2-based nanocomposites have been employed in photothermal therapy due to their effective light-to-heat conversion [53], emerging as a promising tool in cancer treatment alone or in combination with other approaches such as DDS-based chemotherapy [52], gene therapy [54] or photodynamic therapy [55]. Owing to their exceptional physicochemical and optical properties, MoS2-based nanocomposites have also been utilized as cancer diagnosis agents and tested for use in different imaging modalities, e.g. magnetic resonance imaging [56], x-ray computed tomography [57], positron emission tomography [58] and photoacoustic imaging [59].
One of the available AML biological models is a SKM-1 cell line. SKM-1 cells were originally isolated from the peripheral blood of a 76 years old Japanese man who suffered from myelodysplastic syndrome (MDS) leading to AML. These cells show karyotype abnormalities, possess two mutations in TP53 gene and express various specific antigens such as CD4, CD13, CD33 and HLA-DR [60, 61]. SKM-1 cells have not been a widely employed as a AML-MDS biological model in research. Nevertheless, the range of research areas in which they have been exploited includes induction of cell death [62, 63], proliferation [64] and cell cycle [65, 66], differentiation [67, 68], gene expression [69] and its epigenetic regulation [70] or drug resistance [71], usually as a response to a particular substance [72] or nanoconjugates [73, 74].
In this work, we constructed a conjugate consisting of a MoS2 nanoflake prepared by liquid-phase exfoliation (LPE) and functionalized by the biotin–avidin system with an antibody that can specifically bind to CD33 receptors expressed on the surface of SKM-1 cells. To our knowledge, this is the first time the SKM-1 cell line is involved in a study of tumor-selective conjugates based on inorganic nanomaterials. Previously, we demonstrated that the biotin–avidin complex can serve as a highly functional noncovalent binding moiety between monoclonal antibodies and nanomaterials of different sizes and properties (MoS2 [75], graphene–oxide [76]). This novel approach is now being further applied for tumor-specific targeting within an in vitro AML biological model. Cell viability in response to MoS2-based conjugates is assessed and the efficiency of their internalization via CD33 receptors is examined. Labeled and label-free confocal optical imaging is used to monitor cellular uptake of the conjugate and for subcellular localization studies.
2. Materials and methods
2.1. Preparation of MoS2 nanoflakes
MoS2 nanoflakes were prepared by the LPE method. Crystalline MoS2 powder (99% metals basis, fisher size 3.10 µm; Alfa Aesar, USA) was used as the starting material. MoS2 powder was mixed with 45% (v/v) ethanol (Merck, grade: ACS, ISO, Reag Ph Eur) in ultrapure water to achieve a suspension with a concentration of 1 mg ml−1. The suspension was subsequently sonicated using an ultrasonic bath (Bandelin Sonorex RK 510 H, 35 kHz) cooled at 10 °C for 48 h. After sonication, the mixture was centrifuged (Sigma 3-30KS, Sigma Laborzentrifugen GmbH, Germany) at 41 415 × g and 20 °C for 1 h [77]. The supernatant containing few-layer MoS2 nanoflakes with a lateral size around 14 nm and thickness of 3.4 nm (see supplementary data (SD), figure S1 (available online at stacks.iop.org/BMM/16/055009/mmedia)) was collected and used for the functionalization process. The final concentration of MoS2 nanoflakes in the colloidal solution was approximately 0.1 mg ml−1.
2.2. Functionalization of MoS2 nanoflakes
The functionalization process was designed in the following way. Based on the average defect density on the order of 1013 cm−2 in exfoliated MoS2 nanosheets [78], average lateral size and thickness of MoS2 nanoflakes, we calculated a theoretical number of lipoic acid and biotin conjugated polyethylene glycol (LA-PEG-biotin) molecules that could fill the defects. During functionalization, a considerable surplus of LA-PEG-biotin was used and free LA-PEG-biotin molecules were removed by dialysis. Then avidin and biotinylated anti-CD33 or anti-GPC3 antibodies were added in a molecular ratio of 1:2. That means that theoretically, one avidin should bind one biotin molecule of PEG and two biotin molecules of biotinylated antibodies. However, it is possible that avidin molecules can bind several biotin molecules from PEG of the same nanoconjugate or another nanoconjugates as well as none or several biotinylated antibodies.
A solution of MoS2 nanoflakes prepared according to the previously described procedure was completely evaporated in a vacuum desiccator. After drying, the remaining solid phase (MoS2 nanoflakes) was sonicated in ultrapure water (sonication bath cooled to 10 °C) for 1 h. The solution of MoS2 nanoflakes in water had a concentration of approximately 0.2 mg ml−1 and a Zeta potential of −34.8 ± 1.3 mV (see SD, figure S4). In the next step, LA-PEG-biotin (average molecular weight 2000 Da, Nanocs, USA) was added to reach the concentration of 0.4 mg ml−1 in the solution. The solution was stirred at 320 rpm for 2 h at room temperature. Free LA-PEG-biotin molecules were removed by dialysis (Spectra/Por 2 Dialysis Tubing, membrane molecular weight cut-off 12–14 kDa, Repligen, USA) at 4 °C for 1–3 d.
The solution containing MoS2-LA-PEG-biotin conjugates was mixed with biotinylated anti-CD33 (Thermo Fischer Scientific, MA, USA) or anti-GPC3 antibody (Bioss, MA, USA) at the concentration of 0.2 µg ml−1 and stirred at 320 rpm for 30 min at room temperature. While stirring, unlabeled avidin (Merck Millipore, Germany) or avidin labeled with Alexa Fluor 488 dye (Thermo Fisher Scientific, MA, USA) was added to the mixture to reach a concentration of 40 ng ml−1, depending on the purpose of subsequent use, and stirring was continued at 320 rpm for 1 h at room temperature. When finished, free molecules of avidin and anti-CD33 or anti-GPC3 antibody were removed by dialysis (Spectra/Por Biotech CE Tubing, membrane molecular weight cut-off 1000 kDa, Repligen, USA) at 4 °C for 1–3 d. For the conjugates used for flow cytometry, quadruplicate amounts of anti-CD33 or anti-GPC3 antibody and avidin labeled with Alexa Fluor 488 dye was used as described above in the functionalization process. A schematic representation of a MoS2 nanoconjugate is shown in figure 1. The lateral size and thickness of the MoS2 nanoconjugates were assessed to be 62 ± 14 nm and 8 ± 3 nm, respectively (see SD, figure S2). The concentration of MoS2 nanoconjugates in the final product after the last dialysis was determined to be approximately 0.02 mg ml−1 (see SD, section S2). The reduction in concentration is caused by several factors. After transferring the nanoflakes into pure water as well as during the dialysis process, precipitation could be observed to some extent. The freshly prepared MoS2 nanoconjugates had a Zeta potential of −45 ± 0.9 mV (see SD, figure S4). Further information on the polydispersity and colloidal stability of MoS2 nanoflakes and functionalized MoS2 nanoconjugates is mentioned in SD (sections S1 and S3).
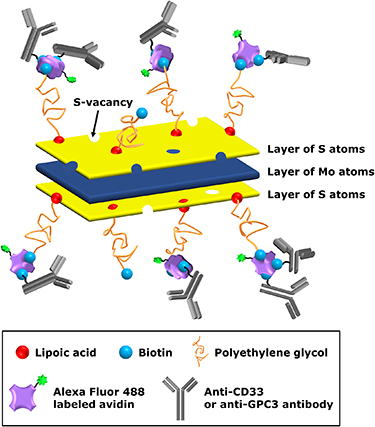
Figure 1. Schematic representation of a MoS2 nanoconjugate.
Download figure:
Standard image High-resolution image2.3. Cell cultivation
The biological model used in experiments was a SKM-1 cell line kindly provided by the Institute of Molecular Physiology and Genetics, Centre of Biosciences, Slovak Academy of Sciences. Cells were cultivated in a culture dish in RPMI 1640 medium (Biosera, USA) containing L-glutamine, sodium bicarbonate, phenol red, 16% (v/v) fetal bovine serum (FBS; Biosera, USA) and penicillin–streptomycin (Sigma–Aldrich, USA; 100 U of penicillin and 0.1 mg of streptomycin per ml of medium). Cells were maintained in a humidified atmosphere of 5% CO2 at 37 °C (CelCulture CO2 Incubator, ESCO Technologies, USA) and passaged three times per week.
2.4. MTT assay
3-(4,5-dimethylthiazol-2-yl)-2,5-diphenyl tetrazolium bromide (MTT) assay was performed to assess the effect of MoS2 based conjugates on cell viability. Four different concentrations of MoS2 conjugates were used: 2 µg ml−1, 3 µg ml−1, 4 µg ml−1, 5 µg ml−1.
Experiments were carried out in 96-well plates in four independent repeats consisting of four parallel treatments. Each tested well was seeded with 2 × 10⁴ SKM-1 cells in 200 µl of growth medium, while the content of solution of MoS2 conjugates was at a level of 25% (v/v) with FBS content maintained as in the growth medium (16% (v/v)). Apart from the control sample containing cells in a growth medium with a concentration of FBS 16% (v/v), another control sample containing 25% (v/v) of ultrapure water in a growth medium with a concentration of FBS at 16% (v/v) was tested to determine the effect of elevated water content in a cell suspension on the cell viability. Cells were maintained in a humidified atmosphere containing 5% CO2 at 37 °C for 24 h.
After 24 h, plates were subsequently centrifuged (Centrifuge 5430R, Eppendorf, Germany) at 600 × g for 10 min at 20 °C. The old medium was discarded and replaced by a fresh serum-free growth medium (200 µl per well). Afterwards, MTT reagent (5 mg ml−1 in PBS pH = 7.4, Sigma–Aldrich, USA) was added to each well (10 µl per well) and cells were incubated for 2.5 h at 37 °C and mild shaking (250 rpm) in the dark. Plates were then centrifuged at 900 × g for 10 min, the old medium was discarded, and formazan crystals were dissolved in 150 µl of DMSO (pa grade; Centralchem, Slovakia) per well. The absorbance of formazan solutions was measured at 570 nm (Hybrid Multi-Mode Reader Synergy H1, BioTek, USA) and 150 µl of pure DMSO was used as a blank. Although MoS2 conjugates were present in samples during absorbance readings, we assume it did not affect the viability results by a large margin since MoS2 nanoflakes absorb light poorly at the wavelength of 570 nm compared to lower wavelengths [79, 80]. Moreover, no other component of MoS2 nanoconjugates effectively absorbs light at 570 nm. Furthermore, flow cytometry analysis proved that after 24 h of incubation, MoS2 nanoconjugates (5 µg ml−1) likely contribute to light scattering (see SD, figures S8 (i)3–(l)3). Nonetheless, light scattering, although not quantified, could lead to a slight underestimation of calculated viability values, since the scattered light was not detected during absorbance readings.
2.5. Cell preparation for microscopic analysis
The efficiency of CD33 receptor-mediated internalization of MoS2 conjugates was determined by confocal laser scanning microscopy (CLSM) and label-free confocal Raman microscopy (CRM). For both microscopy methods, cells were cultivated in a six-well plate in a humidified atmosphere of 5% CO2 at 37 °C. The cell suspension contained: 1 × 10⁶ of cells, 3 ml of culture medium and 1 ml of MoS2 conjugate solution (approximately 5 µg ml−1). In the control sample for CLSM, MoS2 conjugate solution was replaced by 1 ml of growth medium. Cells were cultivated in such a setup for 4, 12 and 24 h. After the set time elapsed, cell suspension was centrifuged at 300 × g for 5 min at room temperature. Supernatant was discarded, cells were washed with RPMI 1640 without phenol red and centrifuged again at 300 × g for 5 min at room temperature. Supernatant was removed, and cells were fixed with 2% (w/v) paraformaldehyde (Centralchem, Slovakia) in PBS (pH = 7.4, prepared from NaCl, KCl, KH2PO4, Na2HPO4 · 12H2O purchased from Mikrochem, Slovakia) for 10 min in the dark and subsequently centrifuged at 400 × g for 5 min at room temperature. Supernatant was discarded, cells were washed with PBS (pH = 7.4) and centrifuged at 400 × g for 5 min at room temperature. Remaining pellet was suspended in 100 µl of PBS, and cells were stained by Hoechst 33342 (Thermo Fisher Scientific, USA) dye for analysis by CLSM.
2.5.1. CLSM
The cell suspensions were analyzed on an inverted raster CLSM microscope (Nikon Ti-E AR1, Japan) using an oil immersion objective (Plan Apochromat λ Ph3 DM, NA = 1.4, 60×; Nikon, Japan), 405 nm and 488 nm excitation laser lines. The images were acquired and further analyzed by NIS-Elements software.
2.5.2. CRM
CRM (Alpha300 R+, WITec, Ulm, Germany) was applied to image fixed cells using an oil immersion objective (C Plan-Apochromat, NA = 1.4, 63×, Zeiss, Germany). Samples were excited at a laser wavelength and optical power of 532 nm and 2.5 mW, respectively (Spectra-Physics Excelsior 532-60). Raman spectra were acquired through a 50 µm diameter multimode optical fiber, which also serves as a confocal pinhole. The spectrometer used (UHTS 300, WITec, Ulm, Germany) was equipped with a 600 gr mm−1 grating (blazed at 500 nm) and coupled to an EMCCD camera (Newton DU970N-BV-353, Andor, Belfast, UK). The probing volume is limited to approximately 230 nm and 1000 nm in lateral and transversal directions, respectively. The measured data were collected and further analyzed by WITec Project Plus software.
The bright-field mode was first used to obtain an optical image that served to define the scanning area (denoted by a red square in figure 4(a)) for spectral measurements. In the 1st step of hyperspectral data analysis, cosmic ray removal was applied. Then, principal component analysis (PCA) was employed to reduce the dimensionality and lower the hyperspectral data noise. In the final step, k-means clustering was used to identify the chemically similar zones within the scanned area and the corresponding Raman spectra were gathered ultimately.
2.6. Flow cytometry
The accumulation of MoS2 conjugates in SKM-1 cells was tested by flow cytometry. Cells were cultivated in 24 well plates, 1.25 × 10⁵ cells were seeded in 0.5 ml of growth medium per well. The solution of MoS2 conjugates constituted 25% (v/v) of cell suspension (approximately 5 µg ml−1) while the concentration of FBS was at the level of 16% (v/v). Reference samples had MoS2 conjugate solution replaced with ultrapure water, control samples with growth medium. Cells were cultivated in such setup in a humidified atmosphere of 5% CO2 at 37 °C for 4, 12 and 24 h.
At the end of cultivation time, cell suspensions were centrifuged at 300 × g for 5 min at room temperature. Supernatant was discarded, cells were washed with serum-free RPMI 1640 without phenol red and centrifuged again at 300 × g for 5 min at room temperature. Supernatant was discarded, cell pellet was suspended in 100 µl of serum free RPMI 1640 without phenol red and cells were additionally stained by propidium iodide (Sigma–Aldrich, USA) to determine cell viability. Cells were analyzed using BD Accuri C6 flow cytometer (BD Biosciences, USA) with 488 nm excitation laser, the number of events was set to 2.5 × 10⁴ and the results were recorded and subsequently analyzed using BD CSampler software and BD Accuri C6 software, respectively. Analysis of the gathered data and a calculation of the cellular uptake are mentioned in SD (section S5).
3. Results and discussion
The effect of MoS2 conjugates on the viability of SKM-1 cells was assessed by MTT assay (figure 2). The sample containing cells cultivated exclusively in growth medium with 16% (v/v) of FBS was used as a reference sample (100%). Despite a relatively high content of ultrapure water in a cell suspension (25% (v/v)), only a small decrease in cell viability, 12% ± 3%, was observed in the control sample. It can be concluded that an elevated content of ultrapure water had no adverse effect on cell viability. The viability of cells cultivated in the presence of MoS2 conjugates of different concentrations decreased only marginally compared to the control group. Even in the case of the sample with the highest concentration (5 µg ml−1), cell viability remained above 70%, meaning that MoS2 conjugates had only a minimal negative effect on cell proliferation. Hence, according to the preliminary cell viability studies, MoS2 conjugates posed minor harm to cells over a 1 d period and could be safely used in subsequent experiments. In addition, our previous study of MoS2-based conjugates did not reveal a significant decrease in cell viability below 100% for JIMT-1 breast carcinoma and MRC-5 fibroblast cell lines, even after 48 h of incubation [75]. In this paper, MoS2 nanoparticles with a larger lateral size distribution were used (10–120 nm, average lateral size around 77 nm), directly functionalized in 100% ultrapure water.
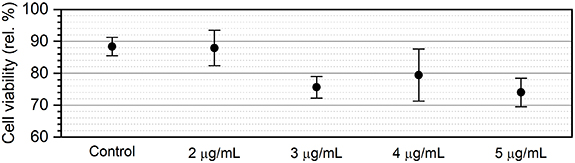
Figure 2. Viability of SKM-1 cells after 24 h cultivation evaluated by MTT assay. Control: SKM-1 cells cultivated in RPMI 1640 medium containing 25% (v/v) of ultrapure water and 16% (v/v) of FBS. Other samples refer to the concentrations of MoS2 conjugates in a cell suspension containing 16% (v/v) of FBS and 25% (v/v) of the MoS2 conjugates solution. Results are shown as the mean of four independent measurements ± standard deviation.
Download figure:
Standard image High-resolution imageCancer cells usually generate high amounts of reactive oxygen species, particularly hydrogen peroxide (H2O2) [81]. Furthermore, SKM-1 cells express myeloperoxidase, an enzyme used as one of the markers for the diagnosis of AML [82] that utilizes H2O2 and chlorides (Cl−) for the formation of hypochlorous acid (HClO) [83], a strong oxidizer. Kurapati et al [84] studied in vitro degradation of pristine and acetamide functionalized MoS2 nanosheets by H2O2 alone or by myeloperoxidase in the presence of H2O2 and sodium chloride (NaCl) and tested the effect of water-soluble degradation products on the viability of HeLa (cervical epithelial carcinoma) and RAW 264.7 (macrophage) cells. They found that the functionalization helps to slow down the degradation rate of MoS2 nanosheets in both cases, decreasing the instantaneous concentration of toxic Mo-containing compounds, leading to better viability of the two cell lines. These results indicate that an appropriate dose of suitably functionalized MoS2 nanoflakes should be degraded in a controlled manner in SKM-1 cells with minimal cell damage, suggesting the use of MoS2 conjugates in the diagnosis or treatment of AML. To date, the only studies on the interaction of SKM-1 cells with inorganic nanomaterials were reported by Wang et al [85] and Xia et al [74]. Both groups used Fe3O4 magnetic nanoparticles as drug delivery agents. The former study addressed an induction of apoptosis of SKM-1 cells by a copolymer of Fe3O4 magnetic nanoparticles and artesunate, and its results demonstrate that the copolymer was more effective than artesunate alone. The latter study reported the effect of a copolymer of Fe3O4 magnetic nanoparticles and 2-methoxyestradiol on cell-cycle progression and induction of apoptosis of SKM-1 cells. Xia et al found that their copolymer induced the cell cycle arrest predominantly in G2/M phase and apoptosis more effectively than 2-methoxyestradiol only. However, neither letter referred to SKM-1 specific targeting by the respective nanomaterials since seemingly none of their components bound specifically to SKM-1 cells. On the other hand, our MoS2-based nanoconjugate was tailored to target SKM-1 cells (and AML cells in general), as evidenced and discussed below.
The cellular uptake of MoS2 conjugates by SKM-1 cells was determined qualitatively by CLSM. Different layers of the cells cultivated with MoS2 conjugates and analyzed by CLSM are shown in figure 3, for 4 h, 12 h and 24 h cultivation. The green fluorescence, corresponding to avidin labeled with Alexa Fluor 488 as a part of the MoS2 conjugate, can be noticed on the cell surface or even in the intracellular space. MoS2 conjugates are present in every scanned layer, which means they are unevenly distributed within cells, on the cell surface or in the intracellular space. We can also confirm that the conjugates are accumulating in cells with increasing cultivation time. SKM-1 cells cultivated in growth medium only, serving as a control, can be seen in figure S5 (SD). The Z-stacks, comprising of in-plane scans separated vertically by 8 µm and providing further evidence of the distribution of MoS2 conjugates within cells, are shown in figure S6 (SD).
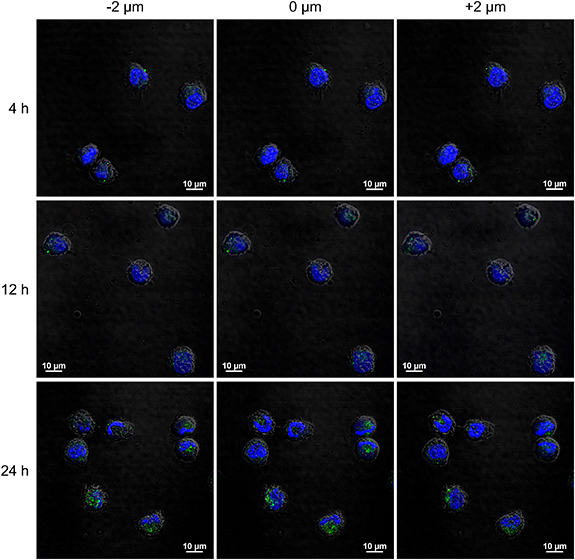
Figure 3. Comparison of different layers of SKM-1 cells scanned by CLSM at different Z-scan levels. Blue fluorescence corresponds to Hoechst 33342 dye, green fluorescence corresponds to Alexa Fluor 488 dye linked to avidin as the part of MoS2 conjugates.
Download figure:
Standard image High-resolution imageThe cellular uptake was further analyzed by CRM. Figure 4 shows a bright-field image of a SKM-1 cell after 24 h cultivation with MoS2 conjugates (a), a false-color image as a result of PCA and cluster analysis (b), and corresponding Raman spectra of MoS2 conjugate and cellular compartments (c). The Raman bands common to each cell compartment as well as extracellular space are from vibrations of water molecules, i.e. O–H bending (1635 rel cm−1) [86], symmetric and asymmetric O–H stretching (3248 rel cm−1, 3388 rel cm−1) modes [87]. Except for the extracellular space, the high wavenumber region of the other Raman spectra contains Raman bands as the result of vibrations of biomolecules [88], namely symmetric and asymmetric CH2 stretching modes (2847 rel cm−1, 2878 rel cm−1, 2893 rel cm−1) and symmetric CH3 stretching mode (2930 rel cm−1) in lipids and proteins [87, 89–91]. In the Raman spectrum of MoS2 conjugates, there are two major bands corresponding to  (372 rel cm−1) and
  (397 rel cm−1) vibrational modes of MoS2. The
  mode arises from the in-plane vibrations of S atoms in the opposite direction to Mo atoms and the
  mode results from the out-of-plane opposite vibrations of S atoms in the MoS2 monolayer lattice [92]. The Raman bands associated with C–H bending (1332 rel cm−1), CH2 related vibration (1461 rel cm−1) and indole-ring stretching (1569 rel cm−1) of tryptophan are typical for biotin–avidin complex [93–95]. The fingerprint region of Raman spectra of cellular compartments exhibits a large number of various bands arising from vibrations of biomolecules [88], i.e. tryptophan ring breathing mode (742 rel cm−1) [95], phenylalanine symmetric ring breathing mode (998 rel cm−1) [96], skeletal C–C, C–N stretching modes (1120 rel cm−1) in lipids and proteins [96], vibrational modes (1245 rel cm−1, 1300 rel cm−1, 1310 rel cm−1, 1330 rel cm−1) associated with several different vibrations of nucleobase molecules in nucleic acids [96–98], amide III in proteins [89, 96] and CH2 twisting mode in lipids [96, 99], CH2 scissors mode (1446 rel cm−1) in lipids and proteins [96, 99], ring stretching of C–N and bending of C–H and N–H modes (1481 rel cm−1) in adenine and guanine [97–100], pyrimidine ring vibrational mode (1578 rel cm−1) of adenine and guanine [96, 97, 100], amide I in proteins and lipid C=C stretching mode (1655 rel cm−1) [89, 96, 99]. By employing CRM, we were able to localize the conjugates with regard to different cell parts. It is evident from the result of the cluster analysis that the conjugates are bifurcated into the cell membrane or entirely internalized within the intracellular matrix (figure 4(b)). In these areas, increased organelles activity can be noticed. Bright-field images overlaid with MoS2 conjugate clusters for 4 h and 12 h of cultivation, respectively, are shown in figure S14 (SD).
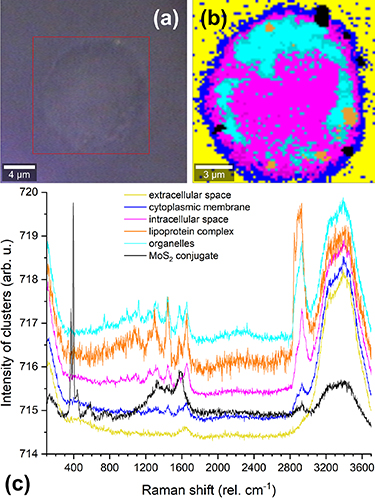
Figure 4. CRM analysis of a selected SKM-1 cell after 24 h cultivation. (a) Bright-field microscopy image; (b) false-color image of the scanned area; (c) the corresponding Raman spectra of cellular compartments extracted by PCA and cluster analysis, Raman spectra are offset for more clarity. The intensity of MoS2 conjugates cluster was scaled to facilitate comparison in a single graph.
Download figure:
Standard image High-resolution imageFigure 5 represents the CRM false-color images obtained at different Z-scan levels of the same cell. Cellular uptake of MoS2 conjugates can be confirmed by varying cross-sectional area across the adjacent levels of the Z-scan. With regard to the lateral and spatial resolution of our CRM technique, the conjugates appear to be a maximum of around 2 × 4 µm2 in size, although smaller conjugates have also been observed. This suggests that the conjugates aggregate to some extent in the extracellular space before binding to CD33 receptors or tend to accumulate in the intracellular space when internalized. Regarding the internalization mechanism, to our knowledge, phagocytosis has not been reported for SKM-1 cells. According to the study by Rejman et al [101] with non-phagocytic melanoma cell line B16-F10, particles up to 200 nm are internalized via clathrin-mediated endocytosis. In contrast, particles with a size of at least 200 nm but less than 1 µm are processed by caveolae-mediated endocytosis. According to these findings, both mechanisms can occur as receptor-specific endocytosis, so we assume that CD33-mediated endocytosis represents the main internalization mechanism responsible for specificity, especially for MoS2 nanoconjugates or their aggregates smaller than 1 µm. However, nanoparticles adsorbed at the cellular membrane can likely enter cells via clathrin- and caveolae-dependent endocytosis in a receptor-independent manner [101, 102], providing a route for a nonspecific cellular uptake of MoS2 nanoconjugates or even their small aggregates. Furthermore, cancer cells may employ receptor-independent macropinocytosis as a means to massively uptake nutrients needed for their growth [103]. The size of macropinocytic vesicles can vary from 0.2 µm to 5 µm [102] and considering the size of our MoS2 conjugates (or aggregates), this mechanism may allow aggregates of SKM-1 specific and nonspecific MoS2 conjugates to be internalized. Altogether, the previously described mechanisms of the nonspecific cellular uptake of MoS2 conjugates are probably the reason that SKM-1 nonspecific (anti-GPC3)-MoS2 conjugates were also internalized (see text below); in particular, the occurrence of these uptake mechanisms is rather unpredictable and, compared to cell specific targeting, does not provide controlled conditions that are otherwise necessary e.g. for regulated drug delivery and release.
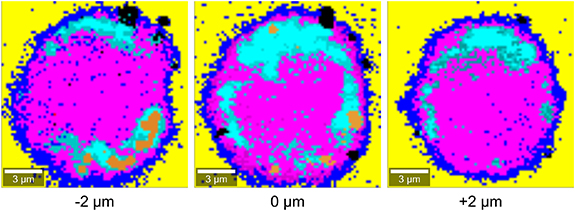
Figure 5. A selected SKM-1 cell imaged by CRM at different Z-scan levels indicated at the bottom of the images.
Download figure:
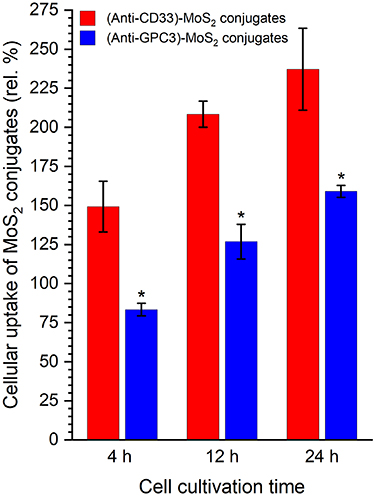
Standard image High-resolution imageTo determine the cellular uptake efficiency and specificity, flow cytometry was employed. The cellular uptake results for 4 h, 12 h and 24 h of cultivation are shown in figure 6. The relative cellular uptake increases considerably with cell cultivation time for cell-specific (anti-CD33)-MoS2 conjugates and also for nonspecific (anti-GPC3)-MoS2 conjugates. Cells were apparently active throughout the cultivation period while MoS2 conjugates continuously accumulated in them. However, the difference between the relative cellular uptake of specific and nonspecific conjugates by SKM-1 cells is highly significant. Moreover, it takes about six times longer (24 h vs 4 h) for nonspecific MoS2 conjugates to reach the cellular uptake level of specific MoS2 conjugates. This provides evidence that functionalization of MoS2 nanoplatforms with cell receptor-specific anti-CD33 antibody increases the specificity of MoS2 conjugates since GPC3 is a receptor normally absent or expressed at low levels in adult tissues (reviewed in [104]), and has been reported to be overexpressed in various pediatric or adult malignancies [105]. However, to our knowledge, its expression in leukemic cells has not been reported. The rapid increase of the cellular uptake during the 1st 4 h of cell cultivation, reaching a value of about 2/3 of the cellular uptake at 24 h, suggests a high binding rate of (anti-CD33)-MoS2 conjugates to CD33 receptors and presumably their internalization via CD33-mediated endocytosis. Similarly, Chandran et al [106] investigated the uptake of anti-CD33 antibody conjugated gold nanocluster-based nanomedicine by KG1a (AML) cells. They found that after 2 h, approximately 60.2% of cells showed an elevated uptake of CD33 specific Au-nanomedicine, in contrast to 18.3% nonspecific uptake. Li et al [107] investigated the uptake of anti-CD33 single-chain variable fragment-modified lipid nanoparticles by Kasumi-1 (AML, high CD33 expression) and K562 (chronic myeloid leukemia, low CD33 expression) cells. After 4 h, they observed a noticeable difference in cellular uptake as the nanoparticles were present in a large amount within Kasumi-1 cells compared to K562 cells. These findings support our hypothesis that CD33 is a suitable AML-specific marker that can be readily targeted, and thus our MoS2 conjugate functionalized with anti-CD33 antibody may be potentially appropriate for the application in AML therapy and diagnosis.
Figure 6. Relative cellular uptake of MoS2 conjugates by SKM-1 cells. Results are shown as the mean of four independent measurements ± standard deviation. The independent measurements correspond to histograms in figure S9 and S12 (SD). Statistical significance was assessed by two-way analysis of variance followed by Dunn–Sidak correction test; asterisk indicates p < 0.001.
Download figure:
Standard image High-resolution image
4. Conclusion
Two-dimensional MoS2 nanoplatforms prepared by LPE method and functionalized with bifunctional PEG and SKM-1 cell receptor-specific anti-CD33 antibody via the biotin–avidin complex were successfully synthesized and tested for cell tolerance. By employing CLSM and label-free CRM, we have demonstrated that such MoS2 conjugates can bind to cell surface and be internalized into the intracellular space of SKM-1 cells. Flow cytometry analysis provided evidence that CD33 receptor-specific antibody functionalized MoS2 conjugates are more specific for SKM-1 cells than SKM-1 cell-nonspecific anti-GPC3 antibody functionalized MoS2 conjugates. The results of our study suggest that appropriately functionalized MoS2 nanoplatforms can potentially serve as a specific DDS for the diagnosis or therapy of AML.
Acknowledgments
This work was supported by the Slovak Research and Development Agency, Project Nos. APVV-15-0641, APVV-19-0365, and by The Agency of the Ministry of Education, Science, Research and Sport of the Slovak Republic for the Structural Funds of EU with the Operational Programme Research and Innovation ITMS project code 26230120006. This work was performed during the implementation of the project Building-up Centre for advanced materials application of the Slovak Academy of Sciences, ITMS project code 313021T081 supported by the Integrated Infrastructure Operational Programme funded by the ERDF.
Data availability statement
All data that support the findings of this study are included within the article (and any supplementary files).
Conflicts of interest
There are no conflicts to declare.