
Abstract
The progress in tissue regeneration is strongly dependent on the development of biocompatible materials with properties resembling those of a native tissue. Also, the application of noninvasive methods of delivering the scaffold into the tissue defect is of great importance. In this study we present a group of biopolymer-based materials as potential injectable scaffolds. In contrast to other studies involving collagen neutralization or additional incubation of gel in genipin solution, we propose collagen and collagen–chitosan gels crosslinked in situ with genipin. Since some parameters of the cells should be considered in the microscale, the steady-state fluorescence anisotropy was applied to study the microenvironment of the gels. To our knowledge we are the first to report on microrheological properties, such as gel time and microviscosity, for this group of hydrogels. Rapid gelation at physiological temperatures found makes these materials of special interest in applications requiring gel injectability. Physico-chemical investigation showed the influence of the crosslinking agent concentration and chitosan addition on the crosslinking degree, swelling ratio, gel microviscosity, and the degradation rate. Strong correlation was revealed between the surface wettability and the viability of cultured mesenchymal stem cells. Cytotoxicity studies indicated that the collagen–chitosan hydrogels showed the best biocompatibility.
Export citation and abstract BibTeX RIS
1. Introduction
Tissue engineering is a very promising and quickly developing field of biomedicine with a great potential in providing tools for the regeneration of injured tissues [1–3]. That is why it has received a great deal of interest among researchers from many different disciplines such as material science, chemistry, biology, and medicine [4]. Creating a scaffold that would meet all the rigorous criteria for maintaining cell growth is very challenging. The choice of the material for tissue repair matrix is essential for the success of the therapy. Many different materials have been tested for scaffold application. Among groups of materials used most often for this purpose are ceramics, composites, polymers, carbon fibers, and nanomaterials [5]. Proper fabrication methods enable obtaining scaffolds of different shapes, forms, and parameters. Tissue supporting matrix should exhibit high porosity and appropriate mechanical and physicochemical properties, but first of all it should show sufficient biocompatibility and support cell adhesion, proliferation, and migration [6].
Polymers are a group of materials widely used for the preparation of tissue engineering matrices. Scaffolds are successfully produced from natural [7, 8] as well as synthetic polymers [9, 10]. Among polymers of natural origin collagen is broadly applied in this field [11]. It is known as the most abundant protein and a major component of mammalian connective tissue found in skin, cartilage, ligaments, tendons, fasciae, and bones [12] since it provides tensile strength and structural integrity to the tissues [13]. There are several types of collagen in the body. Type I collagen is the most important type of collagen in bones because it can be mineralized. 90% of collagen in the body occurs in a fibrillar form.
Collagen-based matrices are produced mainly in the form of hydrogels. Soluble collagen obtained by the extraction from animal tissues remains monomeric in the acidic media and at low temperatures. Increasing the temperature and/or pH leads to the self-assembly of collagen monomers and the formation of a gel [14]. However, the collagen hydrogels produced by the thermal gelation are stabilized by weak physical interactions therefore they lack desired mechanical properties [15]. Another method of obtaining collagen hydrogels is chemical crosslinking achieved by the formation of the strong covalent bonds between the functional polymeric groups. For this purpose crosslinkers such as glutaraldehyde, formaldehyde, and carbodiimide are often used [16–18]. Crosslinking is also a method of strengthening collagen-based materials. Adding other components and the preparation of the composite materials is also a good way to improve the mechanical properties of collagen. That is why constructs based on collagen and other biocompatible materials like polysaccharides, other proteins, and synthetic polymers are gaining more and more interest [19, 20].
Injectable materials are very promising tools in the regenerative medicine and tissue engineering field due to the possibility of applying noninvasive methods of their delivery to the injured site [21–24]. Hydrogels are widely used as injectable materials because they may undergo in situ gelation. A wide range of the hydrogels has been developed for specific applications, e.g., water-soluble chitosan derivatives (CH-GA/PA), i.e., chitosan-graft-glycolic acid (GA) and phloretic acid (PA), demonstrated high potential as an injectable biomaterial for cartilage tissue engineering [25]. For spinal cord injury soluble collagen gel incorporating genipin was proposed. The gel has been shown to support mesenchymal stem cells (MSCs) proliferation [26]. The other advantages of the injectable hydrogels are the ability to undergo rapid gelation in physiological temperature and pH and to conform to the shape of the defect. This way the necessity to fabricate preformed scaffolds for individual patients may be avoided [27, 28]. The great advantage of those materials is also the possibility of being seeded with cells prior to injection [29].
Genipin-crosslinked collagen–chitosan (CCG) materials have been already studied, e.g. for the preparation of vascular grafts [30] (also with the addition of elastin [31, 32]). These hydrogels were tested as solid membrane-like scaffolds for tissue engineering. CCGs were also studied for cartilage [33, 34] and skin tissue engineering [35]. We have also obtained chitosan-based genipin crosslinked membranes containing collagen for the preparation of membranes for corneal epithelium culturing [36].
In this study we investigated collagen materials reinforced with chitosan as hydrogels crosslinked in situ with genipin for the application as injectable scaffolds. None of the previous reports has addressed this approach. Their gel forming ability in physiological conditions (temperature, pH) and gelation time were assessed. Steady-state fluorescence anisotropy measurements were used to characterize the properties of the hydrogels in microscale such as gel time and microviscosity. Scanning electron microscopy was applied to investigate the microstructure of the prepared materials. The influence of the concentration of the crosslinking agent and the addition of chitosan, a second biopolymer, on the physicochemical properties (crosslinking degree (CD), swellability, degradability) of the collagen materials were analyzed and compared to those of the physical collagen gel. The effect of the surface wettability on the viability of the MSCs was also studied. Preliminary biological evaluation in terms of the cell viability was performed.
2. Materials and methods
2.1. Materials
Collagen type I rat tail (3.9 mg ml−1 solution, BD Biosciences), genipin (Challenge Bioproducts Co., 98%), chitosan (low molecular weight, Aldrich), Minimum Essential Medium Eagle (MEM) 10× (Sigma-Aldrich), collagenase type I (Sigma-Aldrich), ninhydrin (Sigma-Aldrich), glycine (Sigma-Aldrich), cresyl violet (Sigma-Aldrich), NaOH (Lach-Ner, p.a.) were used as received. Water was distilled twice and deionized using Simplicity Millipore Water Purification System.
2.2. Apparatus
UV-Vis absorption spectra were measured using a HP 8452A diode-array spectrophotometer in 1 cm optical path quartz cuvettes. Fluorescence digital imaging was performed using a Nikon Eclipse TE 2000 fluorescence microscope. Imaging of hydrogel microstructure was performed using a Hitachi S-4700 cold field emission scanning electron microscope equipped with a Noran Vantage energy dispersion spectrometer. Samples prepared on the glass slides were frozen in liquid nitrogen and then lyophilized. Finally, the thin film of carbon was deposited on the sample by sputtering. Contact angle was measured using Surftens Universal instrument (OEG GmbH, Frankfurt, Germany). For each material five measurements were carried out and the average was calculated.
2.3. Preparation of the hydrogels
2.3.1. Physically crosslinked collagen hydrogel
Collagen physical hydrogel (Colphg) was prepared as previously described [37] by mixing 400 µl of collagen stock solution with 50 µl MEM (used as neutralization indicator) and adding 1 M NaOH dropwise till collagen neutralization (about 9–14 µl). Mixtures were then incubated at 37 °C till gelation occurred.
2.3.2. Chemically crosslinked collagen hydrogels
Chemical hydrogels (Colgp) were obtained by adding 100 µl of 1–20 mM genipin solution in pH 7.4 PBS buffer to 400 µl of the stock collagen solution and then incubating the formulation at 37 °C till a hydrogel was formed. Hydrogels obtained using collagen solution and 1, 2, 3, 5, 8, 10, and 20 mM genipin solution (named Colgp1, Colgp2, Colgp3, Colgp5, Colgp8, Colgp10, and Colgp20, respectively) were obtained.
2.3.3. Chemically crosslinked collagen/chitosan hydrogels
280–380 µl of the stock collagen solution and 25–400 µl of 2 wt% chitosan solution in 1% acetic acid were mixed, 68–100 µl of 20 mM genipin solution was added, and the mixtures were vortexed and incubated at 37 °C till gel formation. The collagen/chitosan weight ratios in the hydrogels prepared were 75:25 (ColCh1), 50:50 (ColCh2), 25:75 (ColCh3), and 0:100 (Ch4).
2.4. Characterization of the hydrogel crosslinking
The occurrence of the crosslinking of collagen and collagen–chitosan hydrogels with genipin was confirmed with the appearance of a characteristic red fluorescence visible under a fluorescence microscope. The degree of crosslinking (DC) for all hydrogels prepared, defined as the ratio of the number of reacted amino groups in the crosslinked samples to the number of free amino groups in the corresponding uncrosslinked samples, was determined using a ninhydrin assay [38]. Briefly, the obtained hydrogels (see section 2.3.) were heated with 5 ml of 10% ninhydrin water/ethanol solution (1:1 v:v) at 100 °C for 20 min. The samples were cooled down and their absorbance was measured at 570 nm. Glycine solutions of various concentrations were used as standards.
2.5. Swelling properties of the hydrogels
Collagen and collagen–chitosan hydrogels were immersed in deionized water for 24 h at the physiological temperature (37 °C). Swollen gels were removed from the swelling medium and weighed. Then the gels were dried by lyophilization and weighed again. The swelling ratio, SR, was calculated according to the following equation:

where WS is the weight of the swollen hydrogel and WD is the dry weight of the polymer (after lyophilization).
2.6. Determination of the gel time of the hydrogels
The progress of the gelation process was followed using steady-state fluorescence anisotropy measurements and cresyl violet was used as a fluorescent rotational probe. 10 µl of 5.1 ×10⁻⁴ M aqueous solution of the dye was added to 0.5 ml of the sol formulation and mixed. The dye concentration in the gel was kept below 10−5 M in order to avoid aggregation. Ice cold sol formulations were transferred into cuvettes and thermostated at 37 °C during the anisotropy measurement which lasted for about 15 min.
Steady-state fluorescence emission spectra were measured using an SLM-AMINCO 8100 Instruments spectrofluorimeter in 1 cm optical path cuvettes. The excitation and emission wavelengths were λexc = 584 nm and λem = 626 nm, respectively. The spectra were corrected for the wavelength dependence of the detector response by using an internal correction function provided by the manufacturer. The steady state anisotropy, r, was calculated according to the equation:

where I is the fluorescence intensity, and two subscripts refer in turn to the settings of the excitation and emission polarizers; v and h denote the vertical and horizontal orientation, respectively. G is an instrumental correction factor, which takes into account the sensitivity of the monochromator to the polarization of light. G-factor can be determined according to equation:

G-factors were measured individually for each sample and automatically corrected anisotropy values were obtained. The anisotropy measurements were repeated thrice and the average value was calculated.
2.7. Microviscosity of the hydrogels
Microviscosity of the hydrogels was determined based on the fluorescence anisotropy measurements. The hydrogels were prepared in the cuvettes 15 min, 1 h and 24 h before the measurement. The measurements were repeated thrice and the average anisotropy value was calculated.
2.8. Hydrogel degradation studies
Collagen sols (Colphg, Colgp1-Colgp20), collagen–chitosan blends (ColCh1-ColCh3), and chitosan sol (Ch4) were pipetted into 0.5 ml test tubes and allowed to form gels for 24 h at 37 °C. The gels were transferred from the tubes into 48-well plates and then exposed to collagenase type I (0.2%, 0.33 ml, 163 U mg−1) in 1× PBS with 0.36 mM CaCl2 on a shaker (37 °C, 150 rpm). As the control samples, the gels of the same volumes and compositions were exposed to PBS without collagenase. After 2 and 24 h collagenase solution was removed and the gels were washed consecutively for 20 min with PBS and for 30 min with deionized water while shaking. The samples were lyophilized overnight and weighed. The weight of the dry gels was compared with the weight of the dry control gels; data are reported as a relative weight of the remaining substance (wt%). For each gel the experiment was repeated thrice and the results are presented as the averages. In order to relate the degradation rate of the studied gels with the in vivo degradation process the collagenase I concentration (0.2 wt%, 163 U mg−1) used in the experiments was higher than that characteristic of an inflammation process [26].
2.9. Cytotoxicity testing
2.9.1. Preparation of the cell culture scaffolds
First, a 48-well plate containing studied materials was prepared. Briefly, selected samples (Colphg, Colgp10, Colgp20, ColCh1, ColCh2, ColCh3, Ch4) in the sol state (n = 3) were transferred into the well plate and kept at 37 °C until the gelling process occurred. After that, all the wells were filled with 70 vol% ethanol for sterilization and left for 30 min. Then ethanol was removed from the plates and they were rinsed thrice with PBS pH = 7.4 and dried under a laminar flow. Such prepared wells were filled with the cell culture medium containing 89 vol% of MEM, 10 vol% of serum and 1 vol% of antibiotics: penicillin and streptomycin [12].
2.9.2. Cell isolation and culture on hydrogel scaffolds
MSCs derived from the bone marrow of adult donors were seeded in the plate at the density of 104 cells per cm2 on the studied materials prepared in the wells. Then, the plate was placed in the incubator which maintained optimal cell culture conditions (37 °C, 5% CO2). The experiment lasted seven days. The culture medium was replaced every 2–3 days.
2.9.3. Cell viability assay (MTS test)
On the day 7 of the cell culture the cell viability was studied using the MTS test. Briefly, cells were washed with PBS pH = 7.4 and into each well 200 µl of a solution was added prepared as a 1:10 (vol/vol) dilution of the reagent containing the MTS tetrazolium salt, 3-(4, 5-dimethylthiazol-2-yl)-5-(3-carboxymethoxyphenyl)-2-(4-sulfophenyl)-2H-tetrazolium inner salt, and the electron-coupling reagent, phenazine ethosulfate, in phenol red-free alpha-MEM (Invitrogen). Cells were then incubated for 30 min at 37 °C in a humidified 5% CO2 atmosphere. Next, the media from each well were transferred separately to 96-well plates, and their absorbance was measured at 490 nm. As a control, the cells seeded on the tissue culture polystyrene were used.
2.10. Statistical analysis
Experiments were repeated three times and results expressed as an mean ± standard deviation. Statistical significance was calculated using analysis of variance (ANOVA). A comparison between two means was analyzed using Tukey's test with statistical significance level set at p < 0.05.
3. Results and discussion
3.1. Hydrogel fabrication
Four different types of hydrogels were prepared, i.e., physically crosslinked collagen, chemically crosslinked collagen, chemically crosslinked collagen/chitosan, and chemically crosslinked chitosan gels. Physically crosslinked collagen hydrogels were obtained by the neutralization of the collagen solution followed by an incubation at 37 °C, which resulted in the self-organization of the collagen macromolecules and gelation. The neutralization point was determined by the color change from yellow to violet of MEM Eagle added to the sol as a pH indicator. Chemically crosslinked hydrogels were formed by crosslinking of collagen macromolecules with genipin. The preliminary experiments have shown that the best gelling parameters can be achieved when the genipin solution at the concentrations in the range 1–20 mM was used and the collagen stock solution to genipin solution volume ratios were 1: 0.25 or 1: 0.5. When this volume ratio was higher than 1:0.25 (e.g., 1: 0.125; 1: 0.0652; 1: 0.025) the gel was not formed. Thus, during further experiments the collagen hydrogels were prepared in the presence of genipin solution at concentrations of 1–20 mM and the collagen/genipin volume ratio of 1: 0.25 was chosen.
Additionally, collagen–chitosan hydrogels crosslinked with genipin were obtained. Three different materials of that kind were prepared with the collagen/chitosan weight ratios of 75:25 (ColCh1), 50:50 (ColCh2), and 25:75 (ColCh3). Additionally, a chitosan gel (Ch4) was obtained. The color of the gels ranged from greenish at the beginning of the gelation process to dark blue at the end.
3.2. Hydrogel crosslinking characterization
As already mentioned, collagen has a lot of remarkable advantages as a material for biomedical applications, however, it shows poor mechanical properties [39, 40]. This problem is usually solved by crosslinking this material with various agents [41–43]. In this study we propose improving the mechanical properties of collagen by crosslinking it with genipin in the presence and in the absence of chitosan. Genipin was chosen as a crosslinking agent because it is a naturally occurring and nontoxic compound. Moreover, it reacts with biopolymers containing the primary amino groups [44, 45], therefore it crosslinks both collagen and chitosan. It was observed that genipin generates change in color as well as the appearance of fluorescence in a reaction with above-mentioned biopolymers [46–48]. The results of the studies [49, 50] suggest that genipin may form intramolecular and intermolecular crosslinks with the linked cyclic structures of nitrogen substituted genipin attached to collagen. Due to this genipin modification of collagen strong autofluorescence within hydrogels with emission maximum dependent on the excitation wavelength was observed. It was also demonstrated previously [51] that crosslinking of chitosan with genipin results in the appearance of characteristic fluorescence emission with the maximum at 470 nm resulting most likely from the formation of a large conjugated π–π* system. We have used these findings for the visualization of the genipin-induced crosslinking of collagen and collagen–chitosan gels. Figure 1 shows the image of the collagen hydrogel (Colgp20) observed under the fluorescence microscope.
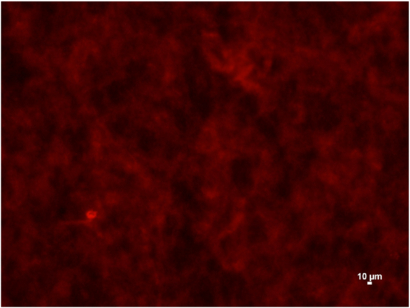
Figure 1. Fluorescence microscope image of the Colgp20 hydrogel.
Download figure:
Standard image High-resolution imageIn order to determine the CD of all the hydrogels studied the ninhydrin test was applied. Ninhydrin is quite often used for colorimetric determination of amino acids. It reacts with the free alpha amino groups present in collagen with the formation of colored products [52]. The value of the absorbance at 570 nm is proportional to the concentration of the free amino groups in the sample. It is known that these groups are involved in the crosslinking process. Thus, the lower is the value of the optical density (OD) at 570 nm, the higher is the CD. Figure 2 shows the values of the OD at 570 nm for collagen crosslinked with different amounts of genipin (figure 2(A)) and for collagen–chitosan hydrogels crosslinked with the genipin solution of the concentration 20 mM and different collagen:chitosan ratios (figure 2(B)). As expected, the values are decreasing with increasing genipin concentration in the hydrogel (figure 2(A)). In the case of collagen–chitosan hydrogels OD values are increasing with chitosan content (figure 2(B)). This tendency can be explained taking into account the higher abundance of amino groups in chitosan main chains than in those of collagen [53].
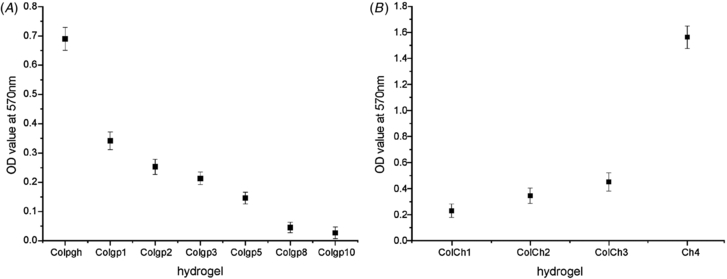
Figure 2. Optical density at λ = 570 nm (A) for collagen gels crosslinked with various amounts of genipin and (B) for collagen–chitosan and chitosan gels after the ninhydrin test.
Download figure:
Standard image High-resolution imageBased on these measurements and calibration curve obtained using glycine as a standard, the CD was determined.
The CD of collagen-based hydrogels ranged from 57.2 to 100% (table 1) when they were crosslinked with genipin at the concentrations ranging from 1 to 10 mM, respectively. The results indicate that under these experimental conditions by adjusting the concentration of genipin the collagen gels with tunable CD can be prepared.
Table 1. Values of crosslinking degree for collagen hydrogels.
| Hydrogel | Crosslinking degree, CD (% ±SD) | Concentration of genipin (mM) |
|---|---|---|
| Colgp1 | 57.2 ± 2.9 | 1.0 |
| Colgp2 | 69.7 ± 3.5 | 2.0 |
| Colgp3 | 75.2 ± 3.8 | 3.0 |
| Colgp5 | 84.7 ± 4.3 | 5.0 |
| Colgp8 | 98.9 ± 5.0 | 8.0 |
| Colgp10 | 100.0 ± 5.2 | 10.0 |
In the case of collagen–chitosan materials the CD increases strongly with the increase of collagen content in the system (table 2). That indicates that collagen amino groups are primarily involved in the crosslinking process. Thus, by changing the collagen: chitosan ratio one can prepare the gels of required CD.
Table 2. Crosslinking degree of collagen–chitosan and chitosan hydrogels.
| Hydrogel | Crosslinking degree, CD (%±SD) | Ratio of collagen: chitosan (w/w) |
|---|---|---|
| ColCh1 | 89.1 ± 4.5 | 75:25 |
| ColCh2 | 82.1 ± 4.2 | 50:50 |
| ColCh3 | 78.2 ± 3.9 | 25:75 |
| Ch4 | 17.9 ± 0.9 | 0:100 |
3.3. Microstructure and morphology of the hydrogels
Scanning electron microscopy studies were carried out to reveal the microstructure of the hydrogel materials. It was observed that physical collagen gels form fibrous open porous structure (figures 3(A) and (B)). The chemically crosslinked collagen gels (figures 3(C) and (D)) exhibit very dense fibrous network. That finding reflects the difference in the density of crosslinking which is much higher in the chemically crosslinked material.

Figure 3. Scanning electron microphotographs of ((A), (B)) physically crosslinked collagen hydrogel (Colphg), ((C), (D)) chemically crosslinked collagen gel (Colgp20), (E) chemically crosslinked chitosan gel (Ch4) and (F) chemically crosslinked collagen–chitosan hydrogel ColCh2.
Download figure:
Standard image High-resolution imageConsiderably different microstructure can be observed in the case of the chemically crosslinked chitosan hydrogel Ch4 (figure 3(E)). The structure is also porous but one can see that there are no fibers present. On the other hand, collagen–chitosan materials (ColCh1–ColCh3) have a network structure which is open and not as dense as that of Colgp hydrogels crosslinked with genipin (figure 3(F)).
3.4. Swelling of the hydrogels
Swelling of the hydrogel materials was tested by their immersion in water for 24 h. The swelling ratios of the collagen and collagen–chitosan hydrogels were determined and the results are shown in figures 4(A) and (B), respectively. For all materials the degree of swelling is high. The highest swelling was observed for physically crosslinked collagen hydrogel. For chemically crosslinked collagen hydrogels swelling decreases with an increase in the CD.
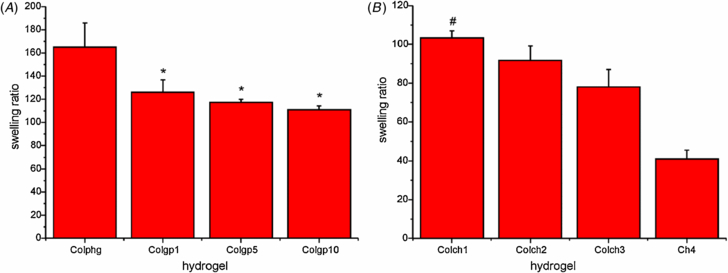
Figure 4. Swelling ratio of the collagen (A), collagen–chitosan (ColCh) and chitosan (Ch4) hydrogels (B) after 24 h of immersion in water. * indicate statistical significance when compared with Colphg (p < 0.05) and # indicate statistical significance when compared with Ch4 (p < 0.05)
Download figure:
Standard image High-resolution imageInterestingly, in the case of collagen–chitosan hydrogels the swelling ratios decrease with the decrease in the collagen content. The values of swelling range from 103.3 ± 3.7 for material with lowest chitosan content to 40.9 ± 4.5 for chitosan hydrogel. The higher content of chitosan in the sample results in a more compact structure that shows reduced swelling capacity.
3.5. Determination of the gel time using steady-state fluorescence anisotropy measurements
Gel time is one of the crucial parameters characterizing hydrogels, especially in the case of injectable materials. Rapid gelation of a formulation (occurring under mild conditions, i.e. at the physiological temperature and pH) that is injected into a defective tissue is very desirable because it prevents the undesired process of spreading the mixture to the surrounding tissues.
Fluorescence anisotropy of chromophores is known to be a convenient tool for studying the microviscosity of the environment in the microheterogeneous systems [54, 55]. Steady-state fluorescence anisotropy, 〈r〉, is a measure of the fluorescence depolarization that is due to the rotation of the dye molecule during its excited-state lifetime. The method is based on the idea that the rotation of the probe is influenced by the local friction exerted by the environment. Thus, the direct information on the microviscosity of the molecular environment surrounding the dye can be obtained. The faster the molecule rotates the more isotropic the fluorescence emission becomes and the lower values of 〈r〉 are obtained, which corresponds to low local friction, or microviscosity, of the environment [56, 57].
In our studies the fluorescence anisotropy values 〈r〉 reflect the changes in the viscosity of the microenvironment that surrounds cresyl violet, a luminescent probe, induced by the gelation of studied sol mixtures. The results of the measurement carried out for ColCh3 hydrogel formation during 15 min of incubation in 37 °C are presented in figure 5 as an example. At the very beginning of the experiment the 〈r〉 values are low indicating that the probe rotates freely. After about 7 min a sudden increase in the 〈r〉 values can be observed which suggests that the rotation of the cresyl violet molecule becomes restricted. The growing trend of the anisotropy values is observed until the plateau is reached at the end of the experiment (after about 15 min). These changes result from the phase transition of the formulation from sol to gel state due to the crosslinking reaction. Similar results were obtained for other studied hydrogels.
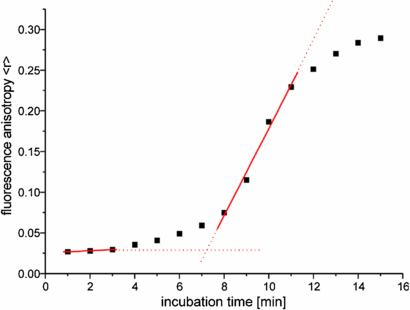
Figure 5. Changes in the fluorescence anisotropy, 〈r〉, of cresyl violet for ColCh3 during 15 min of incubation with genipin in 37 °C. The excitation and emission wavelengths were λexc = 584 nm and λem = 626 nm, respectively.
Download figure:
Standard image High-resolution imageWe propose that the gel time (the time after which the sudden increase in anisotropy values occurs) for a given system can be determined from the above dependencies as a cross point of the straight lines fitted to the two parts of the curves representing the dependence of 〈r〉 on the incubation time. In the case of collagen hydrogel materials the gel time was found to be about 2–3 min and for collagen–chitosan gels the gel time is in the range of 3–7 min. The gel time of the group of prepared hydrogels (table 3) is of the order of a few minutes which may indicate that these materials can be considered as promising candidates for injectable gels.
Table 3. Gel time for collagen, collagen/chitosan, and chitosan hydrogels.
| Hydrogel | Gel time (min) | Concentration of genipin (mM) |
|---|---|---|
| Colgp1 | 2 ± 0.5 | 1.0 |
| Colgp2 | 2 ± 0.5 | 2.0 |
| Colgp3 | 3 ± 0.5 | 3.0 |
| Colgp5 | 3 ± 0.5 | 5.0 |
| Colgp8 | 3 ± 0.5 | 8.0 |
| Colgp10 | 3 ± 0.5 | 10.0 |
| Colgp20 | 3 ± 0.5 | 20.0 |
| ColCh1 | 3 ± 0.5 | 20.0 |
| ColCh2 | 4 ± 0.5 | 20.0 |
| ColCh3 | 7 ± 0.5 | 20.0 |
| Ch4 | 4 ± 0.5 | 20.0 |
It should be mentioned that due to the homogeneous distribution of cresyl violet molecules within the sol material and the formation of rather dense hydrogels (with small pore sizes) they sensed the changes of microviscosity on gelation. Thus, we could successfully determine the gel time based on the anisotropy-time dependence at the physiological temperature. This is not always the case in other gel forming systems. For example, in the studies on titania gel formation the anisotropy values for cresyl violet used as a molecular probe did not exhibit sudden increase on gelation at low temperature due to the fact that the probe remained inside of large cavities (400–600 Å) filled with a solvent [56]. Therefore, the fluorescence probe in this system experienced the bulk-like viscosity.
3.6. Determination of the microviscosity of the hydrogels
Using the determined fluorescence anisotropy values and the Perrin equation the microviscosity of the samples was calculated [54]:

where r0 and r are intrinsic and measured anisotropies of the probe, respectively, T is temperature in Kelvin scale, kB is the Boltzmann constant, V is the rotational volume of the probe, τ is the fluorescence lifetime, and η is the local viscosity. The values of τ, r0, and V used in the calculations were 1.8 ns, 0.355, and 332 Å3, respectively, as found from the literature [56, 58, 59].
For the chemically crosslinked collagen hydrogels the microviscosity measured after 1 and 24 h of maturation at 37 °C increases with a growing genipin concentration (figure 6). In the case of the microviscosity values measured after shorter gelation time (1 h) are of the order of 0.30 cP for Colgp1 and 0.39 cP for Colgp5. Then, a significant increase in the microviscosity can be noticed for the samples obtained in the presence of higher genipin content reaching a value of 1.44 cP for Colgp20. For the samples obtained after 24 h of gelation the values of microviscosity are in the range of 0.76 - 2.8 cP. As expected, the microviscosity determined for the hydrogels obtained after a longer maturation time (24 h) were higher in comparison to those determined for the samples with shorter gelation time (1 h), although the same dependence on the genipin concentration is preserved. These differences reflect the fact that the completion of the crosslinking process requires more than 1 h, which is in agreement with the observation described earlier in the literature [26].
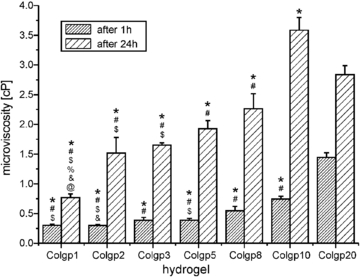
Figure 6. Microviscosity values for collagen hydrogels after 1 and 24 h of gelation. @ indicate statistical significance when compared with Colgp2 (p < 0.05), & indicate statistical significance when compared with Colgp3 (p < 0.05),% indicate statistical significance when compared with Colgp5 (p < 0.05), $ indicate statistical significance when compared with Colgp8 (p < 0.05), # indicate statistical significance when compared with Colgp10 (p < 0.05), and * indicate statistical significance when compared with Colgp20 (p < 0.05).
Download figure:
Standard image High-resolution imageImportantly, even a short time of gelation results in a considerable increase of the microviscosity of the systems. The comparison of the microviscosity of genipin-crosslinked collagen (Colgp) and collagen–chitosan (ColCh) hydrogels in the initial step of gelation (after 15 min) is presented in figure 7. The microviscosity of genipin-crosslinked collagen gels (Colgp) after 15 min exhibits the same trend as in the case of longer maturation times (1 and 24 h) rising from 0.24 to 0.43 cP from Colgp1 to Colgp20, respectively.
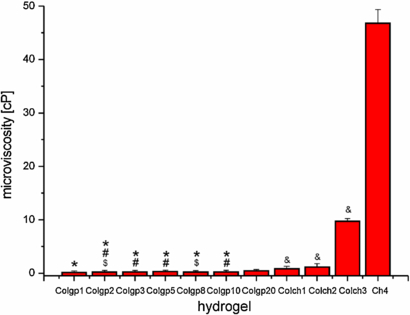
Figure 7. Microviscosity values for genipin crosslinked collagen (Colgp), collagen–chitosan (ColCh), and chitosan (Ch4) hydrogels after 15 min of gelation time. # indicate statistical significance when compared with Colgp1 (p < 0.05), $ indicate statistical significance when compared with Colgp5 (p < 0.05), and * indicate statistical significance when compared with Colgp20 (p < 0.05). & indicate statistical significance when compared with Colch1, Colch2, and Colch3 (p < 0.05).
Download figure:
Standard image High-resolution imageGenipin-crosslinked collagen–chitosan hydrogels (ColCh) are much more viscous than the rest of the hydrogels studied. The values of microviscosity increase with the increase in the content of chitosan, which reflects the greater density of crosslinks along the chitosan chain. For ColCh1–ColCh3 the values ranged from 0.82 to 9.71 cP. The addition of chitosan to the collagen gels led to almost 2-fold increase in microviscosity value from 0.43 cP (Colgp20) to 0.82 cP (ColCh1). The microviscosity grows rapidly with increasing chitosan content reaching the value of 46.7 cP for the hydrogel based on chitosan only (Ch4). These observations clearly indicate that hydrogel becomes more rigid on addition of chitosan. Thus, the addition of that natural polymer can significantly influence the mechanical properties of the collagen hydrogels.
3.7. Hydrogel surface hydrophobicity
Considering the possible practical application of hydrogels as scaffolds for tissue engineering one should determine their surface properties. Hydrophobicity (wettability) of the surface is one of the most important parameters of a cell culture substrate as it determines the ability of the cells to adhere to its surface.
The surface wettability of the hydrogels was determined using contact angle measurements. The obtained results have shown that the contact angle values for various hydrogels change in a very wide range, i.e., from 56° to 105° (table 4).
Table 4. Contact angle values for collagen, collagen–chitosan, and chitosan hydrogels.
| Hydrogel | Contact angle (°) |
|---|---|
| Colphg | 56 ± 4 |
| Colgp10 | 86 ± 6 |
| Colgp20 | 105 ± 2 |
| ColCh1 | 85 ± 3 |
| ColCh2 | 93 ± 5 |
| ColCh3 | 88 ± 2 |
| Ch4 | 61 ± 4 |
The hydrogels prepared from physically crosslinked collagen (Colphg) or genipin-crosslinked chitosan (Ch4) were the most hydrophilic, while the strongly genipin-crosslinked collagen (Colgp20) was the most hydrophobic. The properties of the majority of the samples ensure satisfactory adhesion and proliferation of the majority of living cells.
3.8. Hydrogel degradation studies
The effect of the amount of added genipin and the correlation between the degree of hydrogel crosslinking and their degradability were then studied. The degree of degradation of collagen hydrogels expressed as the weight of the degraded material relative to its initial weight (%) after 2 h of exposure to 0.2% collagenase I is presented in figure 8. After 2 h of incubation with collagenase the physical collagen hydrogel (Colphg) and collagen gels crosslinked with lowest genipin concentrations (Colgp1 and Colgp2) were completely degraded. For Colgp3 more than 35% of weight loss can be observed. For the gels Colgp5–Colgp10 less than 10% of the hydrogel weight is degraded. Interestingly, the gel crosslinked with highest amount of genipin (Colgp20) shows a lower degradation resistance than less crosslinked samples (Colgp5–Colgp10).
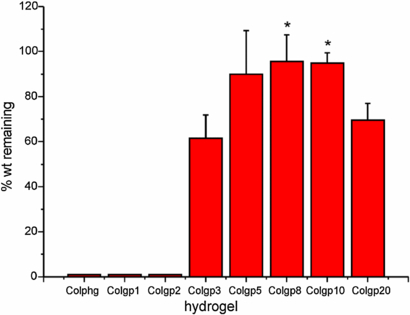
Figure 8. The weight fraction (%) of the collagen hydrogel samples remaining after 2 h of exposure to collagenase I. *indicate statistical significance when compared with Colgp3 (p < 0.05).
Download figure:
Standard image High-resolution imageIncreased degradation time (20 h) led to a greater loss of the hydrogel weight. Complete degradation could be observed for Colgp3. The results also indicate that collagen hydrogels from the group Colgp5–Colgp20 show similar level of stability and much slower degradation rate than the rest of collagen gels. The observed behavior is closely related to the high DC of these materials resulting in their higher microviscosities.
As expected, collagenase affected collagen–chitosan hydrogels to much lower extent than in the case of collagen-only hydrogels. After 2 h of incubation with collagenase the degree of degradation for ColCh samples ranged from 8.7 to 17.3% with increasing tendency for the hydrogels with higher collagen content (figure 9). Prolonged degradation time (20 h) led to further weight loss and the same trend was preserved. Thus, the addition of a controlled amount of chitosan can be used to obtain hydrogel of required degradability.
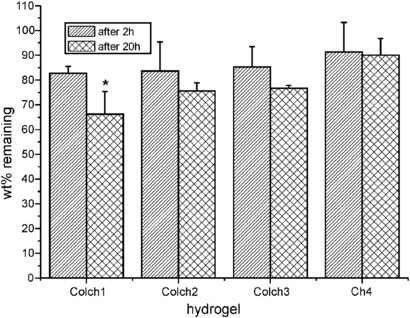
Figure 9. Weight fraction (%) of the collagen–chitosan and chitosan hydrogels remaining after 2 and 20 h of exposure to collagenase. * indicate statistical significance when compared with Ch4 (p < 0.05).
Download figure:
Standard image High-resolution image3.9. Cytotoxicity
To determine the usefulness of the hydrogels developed within these studies for biomedical applications their cytotoxicity was studied. The MTS tests were carried out to determine the relative viability of MSCs seeded on prepared materials. The experiment was carried out on the day 7 of the cell culture. The idea of this method is based on the fact that a yellow MTS reagent, a tetrazolium derivative, is reduced in the mitochondria of living cells only, which is accompanied with the formation of formazan, a purple compound. The concentration of the purple colored product can be quantified by measuring its absorbance at λ = 492 nm. Thus, the measured absorbance is directly proportional to the number of living cells in the culture. The results of the MTS tests are shown in figure 10.

Figure 10. Viability of cells cultured on the surface of the selected hydrogels. @ indicate statistical significance when compared with Colch1 (p < 0.05),% indicate statistical significance when compared with Colch2 (p < 0.05), & indicate statistical significance when compared with Colch3 (p < 0.05), $ indicate statistical significance when compared with Ch4 (p < 0.05), # indicate statistical significance when compared with Colgp10 (p < 0.05), and * indicate statistical significance when compared with Colgp20 (p < 0.05).
Download figure:
Standard image High-resolution image
Preliminary results indicate that collagen–chitosan hydrogels show the lowest cytotoxicity. Genipin-crosslinked collagen gels Colgp10 and Colgp20 show higher cell viability than both a physically crosslinked collagen gel (Colphg) and a chitosan gel (Ch4).
There is a strong correlation between the data on the cell viability and contact angle measurements. Here, exactly the same trend can be easily noticed, i.e., materials with higher contact angle values show also higher cell viability. These results confirmed that cells used in the experiment proliferate preferably on surfaces with intermediate wettability than on those with highly hydrophobic or hydrophilic nature.
4. Conclusions
Collagen and collagen–chitosan hydrogels crosslinked with genipin under physiological temperature (37 °C) were successfully obtained. The gelation process is fast—it occurs within a few minutes as revealed using steady-state anisotropy measurements. The gel time for collagen sols is shorter than that for the collagen–chitosan materials. The ability of these materials to undergo in situ crosslinking, rapid solidification, and gelation under mild conditions (physiological temperature and pH) suggest that they are promising candidates for injectable systems.
The hydrogels obtained show different microstructures. Genipin-crosslinked collagen hydrogel has a fibrous structure which is getting denser with increasing crosslinking degree. Chitosan gel displays open porous structure with fibrous network in the case of the hydrogels containing added collagen. Physicochemical properties of the hydrogels such as crosslinking degree, swelling ratio, and microviscosity can be tuned by changing chitosan and genipin concentration in the sample. By changing the hydrogel composition and crosslinking degree one can also optimize its biodegradability.
Preliminary cell viability tests have shown that the collagen–chitosan hydrogels are good supports for the mesenchymal cell proliferation. Genipin-crosslinked hydrogel prepared from the collagen/chitosan (50:50 w/w) seems to be the most promising material for the scaffold preparation.
Acknowledgments
The project operated within the Foundation for Polish Science Team Programme co-financed by the EU European Regional Development Fund, PolyMed, TEAM/2008–2/6. The research was carried out with the equipment purchased thanks to the financial support of the European Regional Development Fund in the framework of the Polish Innovation Economy Operational Program (contract no. POIG.02.01.00-12-023/08).