

Abstract
This paper presents the bending behaviour of the porcupine quill and bioinspired Voronoi sandwich panels, aiming to explore the effect of geometrical design on the bending performance of the inspired structures. Through the x-ray micro-computed tomography, the internal morphology of the quill is explored. The longitudinal cross-section of the porcupine quill revealed a functionally graded design in the foam structure. Based on this observation, Voronoi sandwich panels are designed by incorporating the Voronoi seed distribution strategy and gradient transition design configurations. Porcupine-inspired sandwich panels with various core designs are fabricated via material jetting technique and tested under three-point bending condition. Results show that the sample failed at the bottom face panels for uniform sandwich panels, whereas graded samples failed in the core panel. The bending behaviour developed via simulation software shows a good agreement with the experimental results. The parametric study provides insights into structural designs for engineering applications, particularly in the aerospace and automobile industries.
Export citation and abstract BibTeX RIS

Original content from this work may be used under the terms of the Creative Commons Attribution 4.0 license. Any further distribution of this work must maintain attribution to the author(s) and the title of the work, journal citation and DOI.
1. Introduction
A porcupine is equipped with thousands of sharp quills covering its body. The quills detach easily when the porcupine is attacked and will soon be replaced with new ones. The lightweight biomaterial has a fascinating structure that triggers the curiosity of researchers to explore its features [1–7]. The keratinous-based material comprises a thick shell, foam and stiffeners, as revealed in recent work using x-ray micro-computed tomography (µ-CT) [8]. While the mechanical performance of the porcupine quill has been reported in the literature, the deformation mode mainly covers compression and tensile properties [4–6, 9]. Flexural properties of similar natural materials, such as hedgehog spines, have been explored [10, 11]. Researchers found that the longitudinal stiffeners of the hedgehog spines contribute to buckling resistance [11, 12]. Porcupine quill-inspired cellular structures have been explored numerically [7]. However, the bending behaviour of the porcupine quills has yet to receive sufficient attention to date.
Conventional production of sandwich panels involves several stages, from individual face and core panel fabrication to the adhesive bonding of the components [13]. Mechanical loading on the conventional sandwich panels often resulted in delamination [14, 15]. Moreover, designs are constrained by limited sandwich core configurations. With the advancement of additive manufacturing (AM), the fabrication of complex architecture which was once challenging to be accomplished is now possible.
Among the various AM technology, fused deposition modelling (FDM) is frequently employed in fabricating sandwich structures as this 3D printing technique is cost-efficient and user-friendly. Aiming to produce structures with high stiffness and weight ratio, sandwich panels are designed with low-density cores and thin skins [14]. Inspired by nature, various complex cores can be fabricated using FDM, including honeycomb, auxetic and a range of triply periodic minimal surface cellular [16–23]. Li et al [17] employed functionally graded design to design gyroid structures with varying densities. Their results show that the graded beam is stiffer than the uniform beam. Hedayati et al [20] introduced sandwich panels with replaceable truncated cube unit cells. By arranging the unit cells with varying struts radii, they found that the graded configuration has better energy absorption capacity than the sandwich panel with uniform struts radii. Due to the layer-by-layer deposition of the molten material, interlaminar gaps are formed in FDM parts. The gaps cause anisotropic behaviour and inconsistency in FDM printed parts [24, 25]. Numerical simulation of 3D printed parts fabricated with FDM is often found to be overpredicted due to the defects caused by the nature of this technology [14, 16].
Material jetting, known for its multi-material and high-resolution polymeric 3D printing, can overcome the challenges faced in FDM 3D printing. This technology is operated by depositing liquid photopolymer layer-by-layer, subsequently cured with ultraviolet light [26, 27]. Several aspects of this technology have been investigated, from dimensional accuracy and build orientations to printing capabilities [28–32]. While the parts performances have been reported in the literature, the findings mainly explore the tensile and compression behaviour [26, 32–37]. The flexural behaviour of the acrylic photopolymer samples fabricated via material jetting is less explored.
Herein, through the investigation of porcupine quill, the foam morphology is explored using x-ray micro-computed tomography. In order to understand the effect of geometrical design on the bending performance of bioinspired structures, Voronoi sandwich panels are designed and fabricated using material jetting technology. Three-point bending test is performed and validated by numerical simulations. Lastly, parametric studies investigate the effect of geometrical variation on the resulting bending stiffness. The findings allow designers and engineers to structurally tailor the desired mechanical performance of lightweight sandwich panels in the aerospace and automobile industries.
2. Three-point bending of porcupine quills
2.1. Materials
African porcupine quills (Hystrix cristata) were purchased, as illustrated in figure 1(a). Samples were classified into five groups based on their lengths, ranging from 5 cm to 25 cm. All quills were carefully examined for defects and cleaned with ethanol to remove debris.
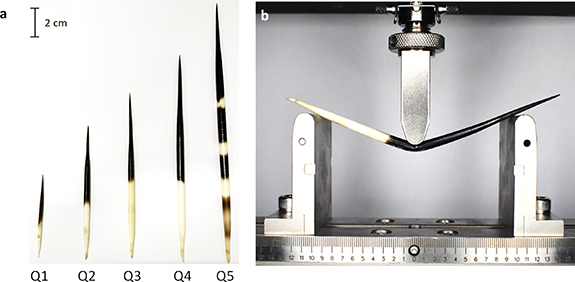
Figure 1. (a) Porcupine quill samples with different lengths. (b) Experimental setup of three-point bending of porcupine quill.
Download figure:
Standard image High-resolution image2.2. Mechanical performance of porcupine quills
The effect of environmental conditions on porcupine quills was studied. In the first scenario, under dry conditions, a three-point bending test was conducted on the samples as received. In the second scenario, samples were kept in the temperature and humidifier chamber (model number: ESPEC SH-222) at room temperature with 75% relative humidity (RH) for 48 h before testing [10]. Mass before and after removal from the humidity chamber was recorded, showing an approximately 2% increase in mass. In addition, the length and diameter were measured for dry samples (table 1) and hydrated samples (table 2) before mechanical testing.
Table 1. Length, diameter and mass of the dry samples and the respective standard deviations.
| Sample | Length (mm) | Diameter (mm) | Mass (g) |
|---|---|---|---|
| Q1-Dry | 65.40 ± 0.636 | 2.56 ± 0.177 | 0.06 ± 0.007 |
| Q2-Dry | 97.27 ± 1.426 | 4.35 ± 0.123 | 0.32 ± 0.024 |
| Q3-Dry | 135.33 ± 1.850 | 4.89 ± 0.521 | 0.65 ± 0.082 |
| Q4-Dry | 171.67 ± 2.867 | 5.54 ± 0.307 | 1.05 ± 0.162 |
| Q5-Dry | 215.00 ± 4.082 | 6.52 ± 0.039 | 1.63 ± 0.155 |
Table 2. Length, diameter, mass before and after hydration, mass change of hydrated samples and the respective standard deviation.
| Sample | Length (mm) | Diameter (mm) | Mass before (g) | Mass after (g) | Mass change (%) |
|---|---|---|---|---|---|
| Q1-RH | 58.86 ± 1.460 | 2.51 ± 0.297 | 0.059 ± 0.013 | 0.060 ± 0.014 | 1.87 ± 0.009 |
| Q2-RH | 94.09 ± 2.760 | 4.13 ± 0.183 | 0.262 ± 0.015 | 0.267 ± 0.016 | 2.18 ± 0.055 |
| Q3-RH | 135.05 ± 0.886 | 4.87 ± 0.236 | 0.554 ± 0.090 | 0.567 ± 0.092 | 2.36 ± 0.021 |
| Q4-RH | 164.40 ± 1.813 | 5.47 ± 0.105 | 0.905 ± 0.037 | 0.925 ± 0.037 | 2.25 ± 0.001 |
| Q5-RH | 208.00 ± 1.633 | 6.63 ± 0.610 | 1.621 ± 0.149 | 1.656 ± 0.153 | 2.20 ± 0.031 |
Three-point bending test was conducted for all porcupine quill samples at a constant rate of 1 mm min−1 using the Instron 5900 with a 30 kN load cell (figure 1(b)). Three samples were tested for each permutation.
2.3. Mechanical performances of porcupine quill
A detailed keratin composition is presented in the work of Bragulla and Homberger [38]. Human hair [39, 40], sheep horn [41] and porcupine quill [3, 5] are keratinous materials. It is known that humidity affects the mechanical performance of keratin [41–44]. However, the mechanism driving this effect is not clearly explored. According to Huang et al [45], in the investigation of the hydration effect of keratin, they found that keratin cells consist of keratin fibres and intermediate filaments arranged in a lamellar structure. Huang and co-workers described that water molecules interacted with the keratin via diffusion. With the presence of α-helix crystalline and amorphous matrix, the hydrogen bonds are prone to break, subsequently decreasing the stiffness and energy absorption of the material under mechanical loading. This process changes the property of the stiff and rigid dry keratin to a weak matrix susceptible to large deformation.
With the understanding of the effect of water on keratinous material via water molecules diffusion, an assumption is made that the exact mechanism applies to porcupine quill exposed to 75% RH. A comparison of bending stiffness between the dry and 75% RH is shown in figure 2(a). The bending stiffness of dry quills is higher than the hydrated quills for Q2, Q3 and Q4, while Q1 shows an opposite trend. The bending stiffness of the hydrated Q1 sample is slightly higher than the dry sample, which could be attributed to the geometrical variation of the natural materials. As Q1 is the smallest sample, a slight difference in the total surface area of the sample could affect the hydration process.
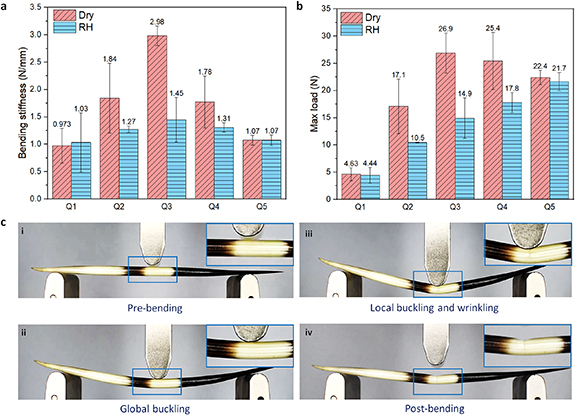
Figure 2. Bending stiffness and maximum load of porcupine quill under (a) dry and (b) 75% RH condition with error bars depict the respective standard deviation. (c) Bending of porcupine quill.
Download figure:
Standard image High-resolution imageOn the other hand, there is a negligible difference in bending stiffness between the dry and hydrated Q5 samples. This observation is similar to the study by Erik et al on the parameters influencing the mechanical properties of human hair [40]. They found that increasing hair diameter increases the force at break. However, the trend changes from 70 µm onwards. No clear explanation is provided for this finding. Despite Danilatos and Feughelman [46] suggesting strain and humidity leads to the weakening of keratin, the influence of water on the mechanical behaviour of keratin may be limited. Two potential influencing parameters, including the geometry of the samples and the duration of the hydration process, apply to our current study. Q5 is the thickest and longest sample in the experiment. The hydration process may take longer with the largest surface area and widest diameter. However, for the sake of simplicity, all samples were kept in the humidity chamber for the same duration. The effect of hydration on the thicker samples may be imperceptible, resulting in similar bending stiffness. Further study is required to investigate the geometrical influence on the mechanical performance of hydrated keratinous materials.
The maximum load of the samples is presented in figure 2(b). All dry samples withstand a higher maximum load than the hydrated samples. This can be related to the hydration process that weakens the matrix within the porcupine quill structures, as discussed above. By observing the discrepancy between the two groups, it is worth noting that the difference in maximum load is slight with a small sample (Q1) due to a small surface area exposed to hydration. The difference between the dry and hydrated samples increases with sample size (Q2 and Q3). This could potentially correlate to the dimension of porcupine quills, such as the peak length, diameter or shell thickness which is prone to hydration weakening. On the other hand, dry and hydrated Q4 and Q5 samples exhibited a lower difference in bending stiffness and maximum load compared to Q2 and Q3. Due to the length and larger diameter in Q4 and Q5, the hydration effect is less prominent in larger samples.
The bending loading of the porcupine quill (Q3) is shown in figure 2(c). The quill is placed horizontally on the three-point bending fixture, with the indenter at the middle section of the sample. Force is applied through the indenter, leading to global buckling (figure 2(c, ii)). The test is terminated when local buckling and wrinkling occur. The indented region is buckled with pre-buckling ovalisation, followed by inward folding on the compression side of the quill. No crack is observed on the quill's compression or extension side. This is mainly due to the low-density foam core having sufficient space for the shell to deform inwards. All the deformed samples are partially recovered when removed from the test fixture (figure 2(c, iv))). This recovery process is mainly due to the viscoelastic behaviour of the keratinous material [47].
2.4. Micro-CT
Micro-CT was conducted to investigate the internal morphology of the porcupine quill. The porcupine quill was cut into 5 mm lengths to scan using the Bruker SKYSCAN 1275. The scan parameters employed in this experiment were a tilt angle increment of 0.2° for a 360° rotation to obtain 1800 projections at a resolution of 8 µm. Thirty kilovolt acceleration voltage and a current of 100 µA were used. The image stacks were reconstructed by SkyScan volumetric NRecon reconstruction software, followed by CTan (CT-Analyser) software for analysis.
2.5. Visual inspection of porcupine quill internal morphology
The internal structure of the porcupine quill is inspected. The structure consists of an outer shell, stiffeners and foam. The shell is dense and thick. From the X–Y plane shown in figure 3(a), the stiffeners are the anchor-like structures that grow from the shell and extend radially towards the centre. The thickness of the anchor reduces from the shell to the core and eventually merges with the surrounding foam cells. Viewing from the Z–Y and X–Z planes, the foam structure is constructed in a hierarchical and functional graded manner. The density decreases from the shell to the core, whereas the foam cell size increases towards the centre of the quill. This finding inspired the design of the graded sandwich structures. Graded structures are designed based on the Z–Y plane, where the gradient transition from high dense to low dense and back to high dense sandwich structure, with the upper and lower face panels resembling the porcupine quill's shell.

Figure 3. Triaxial cross-section of a porcupine quill: (a) before and (b) after bending test. (b) (i) Isotropic view and (ii) cross-section view of porcupine quill after the mechanical test.
Download figure:
Standard image High-resolution imageAfter the bending test, the deformed region of the sample is cut and scanned with the micro-CT. Figure 3(b) shows the cross-section views of a porcupine quill. The dented region depicts the contact area of the sample and the indenter during the test. On the compression side, the shell and stiffeners are deformed (figure 3(b, ii)), but no visible crack is observed. Similarly, no obvious deformation is found on the tensile side of the sample. The stress required to deform the thin foam wall is insufficient to cause failure around the thick shell. Despite being stretched, the sample is restored to the initial condition upon removal from the test stage. The recovery of the quill after mechanical loading is mainly attributed to the viscoelastic behaviour of the keratin-based material [27, 48]. Moreover, the porous architecture allows the rearrangement of the foam and stiffeners during mechanical loading. With the combination of the material behaviour and the quill structure, only wrinkling of the deformed region is found.
3. Bioinspired Voronoi sandwich structures
3.1. Design of Voronoi sandwich structures
Upon investigation of the internal morphology of the porcupine quill using micro-CT, the longitudinal cross-section is analysed using Matlab image processing tool. Matlab scripts are developed to convert the greyscale image (figure 4(i)) to a binary image (figure 4(ii)). Voronoi tessellation is generated via the computational geometry using the divide-and-conquer approach [49], as seen in the overlay image (figure 4(iii)). Figure 4(iv) shows the Voronoi tessellation obtained. High-density Voronoi is found near the top and bottom of the shell, whereas the centre region has low density. Bioinspired sandwich panels are designed following this observation. The top and bottom face panels represent the porcupine quill shell, whereas the core panel is designed with varying configurations, adopting a functionally graded design strategy found in nature.

Figure 4. Longitudinal cross-section of porcupine quill: (i) grayscale image, (ii) binary image, (iii) overlay Voronoi tessellation on binary image, (iv) Voronoi tessellation with varied density.
Download figure:
Standard image High-resolution imageThe intricate 3D foam structure is translated into a 2D sandwich panel to simplify the design and reduce computational costs. Inspired by the graded foam cells observed through the Voronoi tessellation, six core permutations were generated. A Voronoi diagram is generated by partitioning a region based on the number of seeds. With the random seed distribution method, seeds may not be homogeneously distributed throughout the plane. This will result in an area with dense cells on one side and less dense on the other. To avoid this issue, Voronoi sandwich structures were designed based on random controlled seed distribution. Despite having varying configurations, the sandwich panels are controlled by the number of seeds, relative density and mass.
Two hundred seeds were first created with equidistance in rows and columns (figure 5(a, i)). Based on the coordinates of the uniform seeds within a constrained radius, random seeds were generated as indicated in the dash circle in figure 5(a, ii). This ensures every seed is located in each unit distance on the plane. The random (R1) and random graded (RG1, RG2) seeds with the x and y coordinates are generated from equations (1) and (2) respectively [50]:


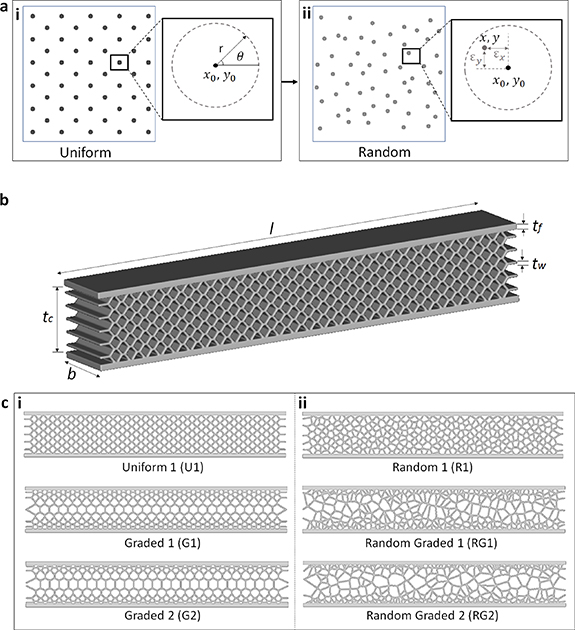
Figure 5. (a) Illustration of random seeds distribution within a constrained radius. (b) Illustration of the bioinspired sandwich panels with respective dimensions. (c) Front view of six designs (U1, R1, UG1, RG1, UG2 and RG2).
Download figure:
Standard image High-resolution imagewhere  and
and  are the initial coordinates of the seeds, while
  and
and  are the displacement from the original coordinates.
On top of the orientation of the regular and random seeds, three gradient transitions were considered, from non-graded (U1 and R1), to first-degree gradient (G1 and RG1) and second-degree gradient (G2 and RG2). All six designs are illustrated in figure 5(c).
3.2. Sample fabrication
Samples were fabricated via the material jetting 3D printer, Stratasys J750. VeroMagentaV was selected as the print material with a glossy surface finish for better visual details. Support material (SUP 706) was manually removed, cleaned with water, and air-dried. The sample size was designed with reference to the ASTM C393 [51]. The schematic diagram of the sample is shown in figure 5(b) while the geometry is presented in table 3.
Table 3. Geometry of the bioinspired sandwich panel.
| Sample geometry | Dimension (mm) |
|---|---|
| Length, l | 70 |
| Width, b | 10 |
| Face thickness, tf | 1 |
| Core thickness, tc | 10 |
| Wall thickness, tw | 0.5 |
3.3. Three-point bending tests
Three-point bending tests were conducted on the 3D-printed Voronoi sandwich structures. Instron 5900R universal testing machine with a 30 kN load cell was employed. The sample was placed on two roller supports of the bending fixture with a span length, Ls of 50 mm. Force was applied centrally with a 10 mm diameter indenter at a displacement rate of 1 mm min−1 until failure. Three samples were repeated for each permutation.
4. Results and discussion
4.1. Experimental results
Figure 6(a) presents the load-displacement curves, while figure 6(b) illustrates the specific energy absorption and maximum load of the sandwich panels with different core types. The specific energy absorption is obtained from the area under the load–displacement curve divided by the mass of the respective samples [52]. RG1 exhibited the highest flexural strength and maximum load. R1, RG1 and G1 samples have a marginal difference in bending stiffness. Compared with the designs of different gradient transitions, G2 and RG2 have significantly lower bending stiffness and strength than the non-graded (U1 and R1), G1 and RG1 samples. The large spacing between the unit cells in G2 and RG2 cores lowers the energy absorption capability. Meanwhile, the orientation of the unit cells also affects the resulting mechanical performance. Random configuration cores (R1, RG1 and RG2) have higher bending stiffness, specific energy absorption and maximum load than their regular configuration counterparts (U1, G1 and G2). This observation is also reported by Zhao et al [53], where a 3D-graded irregular structure has better impact resistance than a regular structure. Meanwhile, graded structures have shown a promising mechanical performance over the non-graded structures [23]. Overall, first-degree graded structures perform better than non-graded and second-degree graded structures.
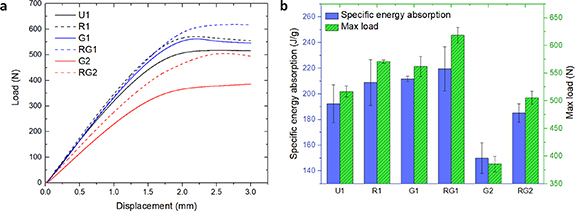
Figure 6. (a) Load-displacement curve, (b) specific energy absorption and maximum load of Voronoi sandwich structures: U1, R1, G1, RG1, G2 and RG2.
Download figure:
Standard image High-resolution image4.2. Semi-analytical model
A semi-theoretical analysis is conducted based on the theory proposed by Zenkert [54]. The equivalent flexural rigidity of a sandwich panel is shown in equation (3),
where  and
and  are the elastic modulus of face and core panel. The first and second terms represent the bending stiffness of the faces and the core about their centroid, whereas the third term describes the bending stiffness of the faces about the centroid of the sandwich beam. The equivalent shear rigidity is shown in equation (4) as follows:
where  is the shear modulus of the core as given in equation (5),
In this section, the three-point bending of the core-only numerical model is performed by applying the material properties of the base material, as shown in table 5. The elastic modulus of the core is calculated by extracting the slope of the reaction force, subsequently obtaining the shear modulus of the core panel.
The total deflection is the summation of bending and shear, which is given by:
where P is the load.
By substituting equations (3) and (4) to equation (6), the bending stiffness is given by:
The semi-analytical model combines the bulk material property obtained through experimental data and numerical simulation of the core material. The flexural rigidity and shear rigidity are calculated based on equations (3) and (4) respectively as tabulated in table 4.
Table 4. The flexural rigidity and shear rigidity of the core materials.
| Core structure | Flexural rigidity (N mm2) | Shear rigidity (N) |
|---|---|---|
| Uniform 1 | 2067 000 | 5477.54 |
| Random 1 | 2088 844 | 6929.35 |
| Graded 1 | 2076 250 | 6092.31 |
| Random graded 1 | 2067 917 | 5538.46 |
| Graded 2 | 2063 558 | 5248.76 |
| Random graded 2 | 2065 781 | 5396.54 |
5. Numerical simulation and parametric study
This section presents the numerical simulation of the three-point bending of Voronoi sandwich panels. A parametric study is conducted to investigate the geometrical influence on bending stiffness by comparing the numerical and experimental results.
5.1. Material properties
A tensile test was conducted to obtain the mechanical properties of VeroMagentaV for numerical simulation. The specimen was designed according to ASTM D638 standard [55] with a length (LO) of 63.5 mm, width (WO) of 11 mm, and thickness (T) of 3.2 mm. The gauge is 18 mm, with a width (W) of 6 mm and a radius at the boundary (R) of 12.7 mm. The schematic diagram of the tensile specimen is shown in figure 7(a). The tensile test was conducted on the Instron 5900R universal testing machine with a 30 kN load cell at 1 mm min−1. Three samples were repeated, and the stress–strain curve is shown in figure 7(a). The average mechanical properties are summarised in table 5.
Table 5. Mechanical properties of the 3D printed tensile sample.
| Elastic modulus (GPa) | Yield strength (MPa) | Poisson's ratio | |
|---|---|---|---|
| Properties | 1.96 | 57.5 | 0.3 |

Figure 7. (a) Experimental and simulation stress–strain curves of tensile sample. (b) Mesh convergence analysis.
Download figure:
Standard image High-resolution image5.2. Numerical model
The finite element model simulating the three-point bending of Voronoi sandwich panels is built via the commercial software package ABAQUS/Standard. A simple 2D plane of the Voronoi sandwich panel is developed for simplicity and to reduce computational costs. From the 3D printable stereolithography file, the 3D model is converted into slices via AutoCAD Netfabb software. One slicing file is then extracted from the stack, imported into SolidWorks, and exported as STEP files compatible with the Abaqus software.
The model is built on a 2D plane with a plane stress thickness of 10 mm. Two 10 mm rigid rollers are placed at the bottom of the sample as the span pole, while another roller is placed on top of the sample as the indenter. The top roller is assigned a displacement boundary condition. A normal contact behaviour with a hard contact formulation and a tangential behaviour of friction coefficient 0.3 is defined. A mesh convergence analysis was conducted as shown in figure 7(b). The numerical model is discretised with 57 989 quadrilateral four-node bilinear plane stress element, CPS4R, with an element size of 0.1 mm. Based on the mechanical properties as tabulated in table 5, an elastic-perfectly plastic model is used to represent the 3D printing material, VeroMagentaV. Following a mesh convergence analysis as shown in figure 7(b), the sandwich panels are discretised with 57 989 quadrilateral four-node bilinear plane stress element, CPS4R, with an element size of 0.1 mm.
5.3. Numerical and experimental results
The comparison between the experiment and simulation results of the three-point bending of Voronoi sandwich structures is shown in figure 8. In figure 8(a), R1 has higher bending stiffness and maximum load than U1. Structural randomness allows the load to be transferred at varying capacities as opposed to the regular U1 structure with an identical load-bearing limit through each unit cell. Meanwhile, graded structures possess a range of energy absorption capacity depending on the cell sizes [56]. The mechanical performance of G1 and RG1 are similar, with RG1 having a slightly higher maximum load than G1 (figure 8(b)). Among all six permutations, G2 and RG2 exhibited the lowest bending stiffness. As mentioned in section 3.1, the abrupt change in gradient affected the overall behaviour of the G2 and RG2, resulting in a lower energy absorption capacity.

Figure 8. Experimental and numerical simulation of three-point bending of sandwich panels: (a) U1 and R1, (b) G1 and RG1, (c) G2 and RG2.
Download figure:
Standard image High-resolution imageFigure 9 displays the deformation of sandwich panels by experiment and simulation. At 2 mm deflection, no crack is observed in all the sandwich panels. Numerical simulations captured well the deformation modes in the experiments. High-stress regions are observed at the top and bottom faces of U1 and R1. Upon failure, U1 and R1 experienced a bottom face crack, followed by crack propagation towards the core. Similar stress concentration is found on the top and bottom face panels of G1 and RG1, with the local buckling observed in the centre of the core panels. High density near the face panels contributes to the localised strengthening and ability to withstand large deformation. The central region of the core has a lower density and is susceptible to deformation. The failure mode observed in the experiment after failure is mainly core shear and crack for G1 and RG1. G2 and RG2 experienced localised buckling at 2 mm deflection. Unlike the first four sandwich panels, stress concentration is mainly found on the top and core panels. The core exhibited buckling, followed by core shear and crack at the end of the experiment.
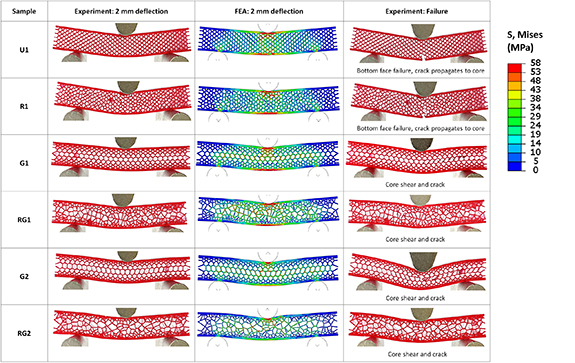
Figure 9. Flexural deformation of Voronoi sandwich panels.
Download figure:
Standard image High-resolution imageRegular core configurations (U1, G1, G2) exhibited symmetrical deformation with respect to the indenter. Conversely, due to structural irregularity, the stress distribution is non-symmetry for R1, RG1 and RG2. While the finite element models do not consider the deformation of the sandwich panels after failure, the stress-concentrated regions depict the potential crack initiation sites that align with the experiment upon failure.
Experimental and semi-analytical results are verified with numerical analysis, as summarised in table 6. For most samples, numerical simulation has the highest bending stiffness prediction, followed by experimental and semi-analytical results, except for G2 and RG2, which ranked from semi-analytical, numerical, and experimental results. The difference could be related to the relatively large gradient transition, which changes the mechanical behaviour of G2 and RG2 samples. Overall, there is a good concurrence between the results.
Table 6. Bending stiffness obtained from experimental, semi-analytical and numerical results.
| Samples | Experiment (N mm−1) | Semi-analytical (N mm−1) | Numerical (N mm−1) |
|---|---|---|---|
| U1 | 317.30 | 282.33 | 359.86 |
| R1 | 339.90 | 327.80 | 381.92 |
| G1 | 336.04 | 302.48 | 353.80 |
| RG1 | 330.00 | 284.39 | 352.88 |
| G2 | 231.00 | 274.46 | 250.57 |
| RG2 | 273.00 | 279.57 | 287.07 |
5.4. Geometrical effect on sandwich structural response
In this section, a parametric study is conducted by varying the cell wall and face panel thickness. The cell wall ranges from 0.3 mm to 0.6 mm with an increment of 0.1 mm for each variation while the thickness of the face panel ranges from 0.6 mm to 1.0 mm, with an increment of 0.2 mm for each permutation. Three structures are considered: the uniform (U1), random uniform (R1) and graded 1 (G1).
Figures 10(a)–(c) illustrate the effect of face thickness with a varied core wall thickness. Generally, the figures show that bending stiffness increases with increasing wall thickness, which is consistent with the literature [54, 57, 58]. For all permutations, the bending stiffness is increased between 19% and 25% for 0.8 mm and 35% to 41% for 1.0 mm compared to the 0.6 mm face thickness. The stress contour of the sandwich panels with varying face thicknesses is presented in figure 10(d). Due to the structural homogeneity, each cell of the uniform core behaves isotropically during the mechanical deformation [59]. Stress is concentrated on the face panels experiencing tensile and compression loading. Symmetrical deformation along the direction of indentation is observed on the uniform structure.

Figure 10. Bending stiffness of Voronoi sandwich structures at different wall thickness of the core, tw: face thickness (a) tf = 0.6 mm, (b) tf = 0.8 mm, and (c) tf = 1.0 mm. (d) Parametric study on the effect of face thickness (tf = 0.6 mm, 0.8 mm, 1.0 mm) with a wall thickness of the core, tw = 0.5 mm.
Download figure:
Standard image High-resolution imageThe centre face panels experienced the highest stress for all random and graded-1 structures. It is worth noting that the stress exerted on the centre region of the face panels reduces with increasing thickness, as depicted in the reduced red region from tf = 0.6 mm to tf = 1.0 mm. For both random and graded-1 structures, each unit cell has varying load bearing capacity due to the varying struts length. The random structure possesses the risk of localised stress concentration if the Voronoi seed is not distributed evenly throughout the space. However, this issue can be avoided if the constrained radius seed distribution method is implemented, as explained in section 3.1. The irregular seed distribution caused a change in mechanical behaviour [60]. Graded structures have varied strut lengths across the horizontal plane. Each level of the gradient is exposed to a different stress level. In comparison to uniform structures, graded structures have better bending resistance. The results are correlated to the findings in the literature [61]. The parametric study shows that geometrical non-linearity contributes to the resulting stress distribution, with random as the best-performing design, followed by graded and uniform configurations.
Following the exploration of face thickness, an investigation of wall thickness of the core is performed. Figure 11 shows the stress contour of the uniform, random and graded 1 Voronoi sandwich panels with 0.8 mm face and varying wall thickness of the core. With 0.3 mm wall thickness, stress is concentrated at the upper panel for all three sandwich structures. Although stress is distributed throughout the core and the bottom panel, high-stress concentration at the top panel is prone to failure. In contrast to the previous section, where the expansion of the stress contour can be observed with increasing face panels, a thicker cell wall reduces the stress distribution. This could be attributed to the increased strut stiffness leading to the decreasing efficiency in load distribution. On the contrary, the overall structure exhibited compliance behaviour with the thin cell wall. The parametric study serves as a design reference to tailor the desired mechanical performance of the Voronoi sandwich panels.

Figure 11. Parametric study on the effect of core thickness (tw = 0.3 mm, 0.4 mm, 0.5 mm, 0.6 mm) with 0.8 mm face thickness for uniform, random and graded-1 sandwich panels.
Download figure:
Standard image High-resolution image
6. Conclusions
Three-point bending of dry and hydrated porcupine quill was investigated. Inspired by the internal morphology of the porcupine quill, the flexural behaviour of the bioinspired Voronoi sandwich structures was explored. Several findings were drawn as follows:
- The mechanical properties of the dry samples were better than the hydrated samples. However, our findings revealed that there might be a geometrical influence in the relationship between the humidity and mechanical performance of keratinous material.
- Key features, including functional gradient and unit randomness, were observed from the micro-CT analysis. Samples were designed based on graded and constrained-randomised design strategies and 3D printed for the three-point bending test.
- In comparison with the uniform and randomised structures, the latter has higher bending stiffness and maximum load. Among the two graded designs, G1 was found to have higher mechanical performance than G2. The gradient transition has a significant effect on the resulting mechanical properties.
- A 2D finite element model of the three-point bending test was developed. Experimental, analytical and numerical results were compared and showed good agreement.
- According to the parametric study, high stress accumulated on the samples with thin face panels, making them unable to distribute load across the structures. In contrast, the stress distribution was improved with a higher face and wall thickness of the core. The parametric study allows structural designers to produce biomimetic structures with tunable mechanical properties of sandwich panels for desired performance.
Acknowledgments
The authors acknowledge the facilities, the scientific and technical assistance of the RMIT Centre of Additive Manufacturing (RCAM) and the RMIT Microscopy and Microanalysis Facilities (RMMF). Author also acknowledges the support from RMIT Vice-Chancellor's PhD scholarship. Authors would like to convey their sincere appreciation to the late distinguished Professor Adrian Mouritz for his tremendous support.
Data availability statement
The data cannot be made publicly available upon publication because they contain commercially sensitive information. The data that support the findings of this study are available upon reasonable request from the authors.
Ethical statement
The quills used in this research were purchased from Africa. According to the seller, the quills were sourced from porcupines that experienced natural death. No live porcupines were sacrificed to conduct this study.