


Abstract
The present work presents a 2D and 3D modeling of the neutral gas flow in the sub-divertor region of the W7-X. The investigations have been done using the DIVGAS code. The complex 2D and 3D geometries of the divertor components in the sub-divertor region have been considered and the Standard and High-Iota magnetic configurations have been numerically simulated. The main objective of this study is to investigate the dynamics of neutral particles in the sub-divertor region including the effects due to geometry and toroidal and poloidal leakages located at the divertor targets and baffles on the achieved pumping efficiency. A sensitivity analysis has been performed for the effect of various geometrical and flow parameters on the pumping performance, under different plasma scenarios. The considered incoming fluxes in the sub-divertor range between 1020 to 1022 (H2 s−1). The main conclusions, which can be extracted from the present numerical analysis could be summarized as follows; a large fraction of incoming neutral particle flux i.e. >70% on the low iota side and >40% for the high iota side is leaked back to the main divertor region, while higher incoming neutral fluxes facilitate the increase of the pumped flux as well as the decrease of the outflux. It has been estimated that a small fraction ∼3%–4% of the incoming neutral flux is being pumped via the turbo-molecular pumps. The closure of the toroidal leakages as well as the inclination of the pumping gap panel by 9o facilitate the increase of the pumped flux, but considering the all the engineering constraints, the latter option seems to be more easy to be implemented. For low incoming neutral fluxes (∼1020 H2 s−1) and for the case of AEH section, free molecular flow conditions are estimated and therefore neutral-neutral collisions could be neglected. For higher incoming neutral fluxes and for both AEH and AEP sections neutral-neutral collisions play a significant role in the flow establishment. A comparison with available experimental measurements of the neutral pressure in the sub-divertor has been performed for Standard and High-Iota plasma discharges. The 3D DIVGAS simulations predict qualitatively the experimental data with relative deviation between 25 and 63%. All the above numerical findings will actively support the optimization of the W7-X particle exhaust, in view of the experimental campaign OP2.
Export citation and abstract BibTeX RIS

Original content from this work may be used under the terms of the Creative Commons Attribution 4.0 license. Any further distribution of this work must maintain attribution to the author(s) and the title of the work, journal citation and DOI.
1. Introduction
The Wendelstein 7-X (W7-X) is an advanced stellarator device to provide the proof of principle that the stellarator (HELIAS) concept can meet the requirements of a future fusion reactor by demonstration of high-performance, steady-state operation. The improvement of the neutral gas exhaust and the achieved pumping efficiency, which is essential for density control in long pulse operations, is the main driver of this analysis. It should be demonstrated that the efficient high gas exhaust, which depends strongly on the individual component design and overall configuration of the divertor and sub-divertor components (targets, baffles, closure plates), can be met by optimization of the current setup. It is therefore essential to support the design activities as well as the plasma simulations by extended modeling of the neutral gas dynamics in the sub-divertor area.
A first attempt to model the particle exhaust of W7-X using the 3D standalone EIRENE neutral particle code was performed in [1], in which a simplified model was applied and the neutral particle balance in the sub-divertor area was provided. More recently, in [2], EMC3-EIRENE simulations have been performed for modeling detached plasma scenarios without considering the sub-divertor area, while in [3], an experimental approach to estimate the particle balance in the sub-divertor area is described. In all these studies, the influence of the sub-divertor neutral gas dynamics in the divertor plasma conditions is not taken into account and therefore the importance and the need of the present work are very well justified.
Within the above framework, the present work mainly focuses on the modeling of the neutral single gas flow of hydrogen molecules in the sub-divertor region of the W7-X (i.e. no plasma impurities are considered). The introduced geometry reflects the operational phase OP 1.2b. The particle based flow analysis for the sub-divertor region has been investigated by using the DIVGAS code. The DIVGAS code has been developed at Karlsruhe Institute of Technology (KIT) and is based on the Direct Simulation Monte Carlo (DSMC) method [4]. The aim of this code is to investigate and reliably describe the flow conditions in the particle exhaust of a fusion device by considering the neutral-neutral collisions, which in the case of high densities play an important role in the flow field establishment. In addition, DIVGAS takes into account all the physics and engineering aspects of plasma‐wall interactions (i.e. volumetric and surface recombination) in the divertor area, which influence the generation of neutral particles at the targets and consequently the overall flow behavior of the particle exhaust, including the attached vacuum system. Currently, within EUROfusion, the DIVGAS code, represents the most effective numerical tool for modeling the particle exhaust system for tokamak fusion devices. For validation purposes, the DIVGAS code has already been implemented to model the neutral gas flow in the JET sub-divertor [5, 6]. Moreover, DIVGAS has been applied for simulating the particle exhaust of ITER [7], JT60SA [8], EU-DEMO [9–15] and recently DTT [16] tokamaks.
The gas flow in the sub-divertor volume of a tokamak or a stellarator depending on the upstream plasma conditions may cover a wide range of the Knudsen number starting from near viscous flow conditions close to the interface with the plasma until the case of free molecular flow (i.e. collisionless flow) close to the vacuum pumps. Consequently, the use of a reliable as well as robust numerical tool, which is able to describe accurately all the aforementioned flow regimes, is fully justified.
The core of the present work consists of the simulation of the 2D and 3D complex sub-divertor region of the W7-X including, additional sub-divertor components, which increase the geometry complexity and influence the flow conditions, namely the turbo-molecular pumps (TMPs), the support structure of the target modules and the related poloidal and toroidal closures. Furthermore, the study is focused on the effect of the leakages as well as further flow and geometrical parameters on the achieved pumping efficiency. Finally, a sensitivity analysis of the effect of various geometrical and flow parameters on the pumping performance, under different plasma and pumping scenarios is performed.
This work, which is focused on large scale simulations, is being performed for the first time and acts as of a door opener for future design and optimization of stellarator related particle exhaust systems. Without this work, the realistic 3D flow effects, which dominate the flow behavior and hence the pumping efficiency of a stellarator cannot be thoroughly investigated.
The present paper is organized as follows. The particle exhaust system of W7-X including the vacuum system as well as the description of the sub-divertor geometry, are presented in section 2, the applied numerical method as well as the imposed boundary conditions are described in section 3, followed by the obtained numerical results for the 2D and 3D configurations in section 4. Finally, the conclusions of this study are discussed in section 5.
2. W7-X vacuum system and sub-divertor geometry
The plasma vessel vacuum system of W7-X is located behind the 10 test divertor units (TDUs). Each unit is divided to the 'Low-Iota' (AEH) and 'High-Iota' (AEP) sections, as depicted in figure 1, these sections correspond to the sides of the divertor on which the strike lines are located for the Low Iota and High Iota magnetic configurations. AEH and AEP are the pumping ports located behind the low iota and high iota sides of the divertor respectively. For the standard magnetic configurations the strike lines are along the low iota side as well. Each divertor unit is equipped with three TMPs; two TMPs are located at the AEH section and one TMP is located at the AEP section (see figure 1). The nominal pumping speed at the inlet of each TMP is equal to 3.73 m3 s−1. The effective pumping speed at the cross-sections CSAEH and CSAEP (see figure 1), based on Monte Carlo simulations has been estimated to be 3.20 m3 s−1 and 1.46 m3 s−1 in the AEH and in the AEP section respectively [1]. Both values are used as input parameters in the present DIVGAS simulations. Based on the assumption of a Maxwellian distribution function for the gas particles at the cross-sections CSAEH and CSAEP as well as collisionless conditions, the following expression, which relates the capture coefficient ξ and the effective pumping speed  at the cross-section can be applied

Figure 1. W7-X plasma vessel pumping ports at the AEH and AEP sections in one of the ten divertor units.
Download figure:
Standard image High-resolution imagewhere A is the area of the corresponding cross-section (i.e. CSAEH and CSAEP), namely A= πd2/4 with d = 0.4 m the diameter of both cross-sections, kB the Boltzmann constant,  is the molecular mass (kg) and TVV= 303 K the temperature of the vacuum vessel. In principle, the capture coefficient ξ is the probability of a particle to be pumped and takes values between 0 ⩽ ξ ⩽ 1. The capture coefficient indicates the efficiency of the vacuum pump. In all the present simulations, ξ is an input parameter. The corresponding values of capture coefficient ξ, which are deduced by using the aforementioned values of the actual effective pumping speed
  at the cross-sections CSAEH and CSAEP, are as follows: for the AEH section ξ = 0.06 and for the AEP section ξ = 0.0264.
The present 2D and 3D DIVGAS geometries of the AEH and AEP sections have been extracted from the corresponding detailed 3D CATIA models. The 2D configurations, have been extracted by taking corresponding slices in the AEH and AEP sections (as shown in figure 2). For both 2D and 3D configuration considered here, the resulting simplified model geometries, are shown in figures 3 and 4 respectively. The two sections AEH and AEP are studied separately due to the fact that during the Operation Phase 1.2b, the two volumes were separated with a metallic plate. More specifically, the 2D and 3D models of the AEH and AEP sections include the baffles and targets, the corresponding supporting structures (see figures 3 and 4(b), (d)), the pumping gap panel found only in the AEH section (see figures 3(a) and (b)), the vacuum vessel, the pumping gap and the corresponding pumping surfaces CSAEH and CSAEP. Additionally, the toroidal and poloidal leakages between the baffle and target tiles as well as the baffles and the vacuum vessel, through which the neutrals can penetrate the plasma area are considered. In figures 3 and 4 the numbering/naming of each toroidal and poloidal leakage considered here, are highlighted. These leakages correspond to the gaps between the installed components i.e. divertor targets modules, baffles, toroidal and poloidal divertor closers. In the case of the 2D configurations, 10 and 13 poloidal leakages in the AEH and AEP sections have been identified, respectively (see figure 3). The individual poloidal length for each case is given in table 1. In the case of 3D configurations 13 and 9 poloidal and toroidal leakages in the AEH and AEP sections have been identified, respectively (see figure 4), while their individual area is given in table 2. It is noted that in both 2D and 3D configurations simplification assumptions have been introduced, regarding the leakage representation. For instance, all the leakages, which are located at the targets have been replaced by one leakage, whose poloidal length (in 2D) or area (in 3D) is the sum of all the individual leakages at the corresponding target. This idea allows to extract a simplified model, which includes the geometrical effects originated by the leakages and additionally does not require special attention to the mesh generation/adaptation, which consequently increases the computational cost.

Figure 2. Cutting positions for the extraction of the corresponding 2D geometry of the AEH and AEP sections.
Download figure:
Standard image High-resolution image
Figure 3. 2D simplified geometry of the (a) AEH and (b) AEP sections including the pumping gap, the horizontal and vertical targets, the baffles, the pumping port and the considered poloidal leakages.
Download figure:
Standard image High-resolution image
Figure 4. 3D simplified models of the (a) AEH section including the considered poloidal and toroidal leakages, (b) AEH section highlighting the position of the pumping gap panel and the supporting structures, (c) AEP section including the considered poloidal and toroidal leakages and (d) AEP section highlighting the supporting structures.
Download figure:
Standard image High-resolution imageTable 1. Poloidal length of each individual leakage/opening considered in the AEH and AEP sections, based on the 2D assumption.
| Leakage/opening in AEH section | A (m) | Leakage/opening in AEP section | A (m) |
|---|---|---|---|
| #1 | 1.00 × 10⁻² | #1 | 1.00 × 10⁻² |
| #2 | 6.53 × 10⁻³ | #2 | 6.34 × 10⁻³ |
| #3 | 1.23 × 10⁻³ | #3 | 1.54 × 10⁻³ |
| #4 | 1.02 × 10⁻³ | #4 | 1.52 × 10⁻³ |
| #5 | 1.91 × 10⁻³ | #5 | 1.55 × 10⁻³ |
| #6 | 1.50 × 10⁻³ | #6 | 1.50 × 10⁻³ |
| #7 | 1.50 × 10⁻² | #7 | 4.90 × 10⁻³ |
| #8 | 1.58 × 10⁻³ | #8 | 4.68 × 10⁻³ |
| #9 | 3.00 × 10⁻³ | #9 | 1.02 × 10⁻³ |
| #10 | 1.00 × 10⁻² | #10 | 1.20 × 10⁻³ |
| — | — | #11 | 1.15 × 10⁻³ |
| — | — | #12 | 1.52 × 10⁻³ |
| — | — | #13 | 1.00 × 10⁻² |
| Pumping gap | 7.83 × 10⁻² | Pumping gap | 3.68 × 10⁻² |
| Pumping surface (CSAEH) | 0.4 | Pumping surface (CSAEP) | 0.4 |
Table 2. Area of each individual leakage/opening considered in the AEH and AEP sections.
| Leakage/opening in AEH section | A (m2) | Leakage/opening in AEP section | A (m2) |
|---|---|---|---|
| I | 1.97 × 10⁻³ | J | 3.02 × 10⁻³ |
| D1 | 5.79 × 10⁻³ | J1 | 3.83 × 10⁻³ |
| D2 | 5.71 × 10⁻³ | J2 | 4.11 × 10⁻³ |
| D3 | 5.41 × 10⁻³ | J3 | 3.58 × 10⁻³ |
| H1 | 1.1 × 10⁻³ | J4 | 3.39 × 10⁻³ |
| H2 | 7.81 × 10⁻³ | J5 | 4.78 × 10⁻³ |
| H3 | 7.44 × 10⁻³ | C | 1.44 × 10⁻² |
| H4 | 7.14 × 10⁻³ | E | 1.25 × 10⁻² |
| H5 | 6.21 × 10⁻³ | F | 5.59 × 10⁻³ |
| C | 1.03 × 10⁻² | — | — |
| E | 1.09 × 10⁻² | — | — |
| F | 3.77 × 10⁻³ | — | — |
| G | 3.47 × 10⁻³ | — | — |
| Pumping gap | 1.53 × 10⁻¹ | Pumping gap | 4.50 × 10⁻² |
| Pumping surface (CSAEH) | 1.24 × 10⁻¹ | Pumping surface (CSAEP) | 1.24 × 10⁻¹ |
3. Numerical model of W7-X sub-divertor and boundary conditions
In the present study, the flow behavior in the W7-X particle exhaust system is described by the integro-differential Boltzmann equation (BE), which is used to determine the distribution of particles in physical and molecular velocity space, as well as in time. The most well-known and commonly applied numerical method, which is able to reproduce the solution of the BE, is the DSMC method. The stochastic DSMC method, is a numerical technique for simulation of rarefied gas flows, in which the mean free path of the molecules is of the same order (or greater) of a representative physical length scale. In the DSMC method, simulation molecules, which represent a large number of real molecules, are used. Simulation molecules are moved through a simulation of physical space in a realistic manner that is directly coupled to physical time such that unsteady flow characteristics can be modeled. Intermolecular collisions and molecule-surface collisions are calculated using probabilistic, phenomenological models. The DSMC method has been applied successfully to simulate classical fundamental heat and mass transfer problems [17–20] and additionally has been successfully validated against corresponding experimental results [17, 20]. In addition, it is noted that, in [21], it has been proved that the DSMC solution is equivalent to solving the BE itself for an adequate large number of model particles.
The detailed description of the DSMC method is omitted, but the reader may consult publication [4] for further details. In brief, in the 2D as well as in the 3D simulations molecular hydrogen, with molecular diameter equal to d = 2.92 × 10⁻¹⁰ m is modeled.
In the present work, the effective collision scheme called No-Time-Counter (NTC) supplemented by the hard sphere (HS) intermolecular potential model, proposed by Bird [4], as well as an optimum value of time step Δt = 0.1 μs, have been applied. The average number of model particles in each simulation ranges between 5–7 × 10⁷ and 1–2 × 10⁸ for the 2D and 3D simulations respectively. Those numbers assure that the statistical scattering of macroscopic quantities along the computational domain is less than 5%. In order to achieve the aforementioned convergence criterion, a time averaging of macroscopic quantities over 6–9 × 10⁶ time steps has been performed. The code uses a Cartesian hierarchical grid. The DIVGAS code uses a 'ray-trace' method to move particles through the grid one cell at a time, by determining particle intersections with cell-faces. If a surface mesh 'cuts' through a flow field cell, the portion of the volume cell accessible by the DSMC particles is reduced. This flow volume is calculated for each intersected cell in order to be used during the neutral gas-surface collisions, as it is typically encountered in the DSMC method. In addition, in the case that the intersecting surfaces are divided into two or more sub-volumes the corresponding calculation of the volume is performed. In the present simulations, the polygon hidden line removal algorithm proposed by Weiler and Atherton algorithm [22] is applied. The number of grid cells is equal to 2 × 10⁶ and 107 for the 2D and 3D simulations respectively. The applied grid was chosen such that the cell size is smaller than the one third of the local mean free path. This work was performed on a HPC with 256 CPUs and 1536 CPUs for the 2D and 3D simulations respectively. The typical time for reaching steady state conditions was 3–5 d and almost 30 d for the 2D and 3D simulations respectively. It is noted that the number of particles per cell remains constant by varying the grid cell number. For all simulated cases, the particle balance of the total incoming and outgoing particles in the flow domain is fully satisfied. In general, the particle balance in the sub-divertor area is described by the following expression
in which Γin is the incoming neutral flux to the sub-divertor from the plasma side, Γpump is the pumped flux, Γoutflux is the neutral flux through the pumping gap directed towards the plasma side, while Γleakage,i is the flux through the individual toroidal and poloidal leakages directed towards the plasma side as well.
The imposed boundary conditions assume that molecular hydrogen enters the sub-divertor area through the pumping gap with a given particle flux Γin and reference temperature T0 = 600 K. The particle fluxes Γoutflux, Γpump and  would be estimated as an outcome of the DIVGAS simulation. By assuming Maxwellian distribution of incoming neutrals with zero bulk velocity, the following expression, which relates the incoming flux Γin with the reference neutral density n0, imposed at the pumping gap, can be applied
where A is the area (in m2) of the surface, from which neutrals are injected in the sub-divertor i.e. pumping gap. Here, the incoming flux Γin consists of an open input parameter and ranges between 1020 and 1022 (H2 s−1), mimicking low to high plasma density scenarios. Moreover, this incoming neutral flux range ensures that the gas collisionality in the sub-divertor area covers the whole Knudsen range, namely from free molecular to viscous flow regime. In table 3, the assumed incoming fluxes, the corresponding number density n0 at the pumping gap as well as the estimated pumping gap area A, based on the 3D CAD files, are provided. It is noted that in the present work the atomic and molecular processes in the gas phase as well as on the stationary walls have not been taken into account. Within the gas-surface interaction process, hydrogen molecules, when impacting a surface, are re-emitted following a Maxwellian distribution function, based on the surface temperature. It is noted that the target and baffle temperature equals to TTB = 400 K (see figures 3(a) and (b)). Finally, it is assumed that the particles leaving the sub-divertor volume through the target modules, undergo immediate ionization and are deleted from the computational domain. Moreover, deletion of particles is performed in the case of particles escaping the sub-divertor through the toroidal leakages (leakages F and only partly through C and E of figure 4(a)). In this case, the neutral particles are going back to the main chamber and they can also be considered as 'lost' particles.
Table 3. Reference number density n0, which is imposed at the pumping gap, through which neutrals penetrate the sub-divertor, for the AEH and AEP sections.
| n0 (m−3) | ||
|---|---|---|
| Γin (s−1) | AEH section (A = 0.1535 m2) | AEP section (A = 0.045 m2) |
| 1020 | 1.037 × 10¹⁸ | 3.535 × 10¹⁸ |
| 1021 | 1.037 × 10¹⁹ | 3.535 × 10¹⁹ |
| 1022 | 1.037 × 10²⁰ | 3.535 × 10²⁰ |
4. Results and discussion
The numerical results obtained from the DIVGAS calculations for both 2D and 3D simplified sub-divertor configurations are presented and discussed in detail. For both configurations, a parametric analysis by varying various flow as well as geometrical parameters is performed. The main goal is to quantify their influence on the overall particle balance in the sub-divertor area. The main factors, which are considered to have a significant impact on the overall particle balance are; (i) the capture coefficient ξ, (ii) the temperature ΤΤΒ of the targets and baffles, (iii) the existence of the pumping gap panel, (iv) the closure of the poloidal/toroidal leakages and (v) the incoming neutral particle flux Γin. Moreover, the present analysis aims to quantify macroscopic quantities of practical interest, as for instance the pressure, the local mean free path and the velocity streamlines. Finally, an attempt to perform a comparison between available experimental and numerical results is performed.
4.1. Numerical results for the 2D 'Low-Iota' and 'High-Iota' sections
In this section, a parametric study devoted to the simplified 2D configurations is presented. The main rationale for initially adopting a 2D approximation is the reduction of the computational effort needed to complete the wide parametric scan.
4.1.1. Influence of the incoming neutral particle flux.
In figures 5(a) and (b), the percentage of total incoming particle flux Γin, which goes through each of the individual leakages and openings, in terms of the incoming particle flux Γin, for the case of AEH and AEP respectively, is presented. The case of the capture coefficient equal to ξ = 0.1 is considered. It is seen, that in both AEH and AEP sections, as Γin increases the pumped flux denoted as 'Pump' increases, while the neutral outflux, namely the neutral flux which goes back to the plasma side through the pumping gap, denoted as 'Outflux', decreases. More specifically, in the AEH section two orders of magnitude increase in Γin results in a factor of ×1.1 decrease of outflux and a factor of ×1.4 increase in the pumped flux. The same behavior is observed at the AEP section, the corresponding values are a factor of ×1.3 decrease in outflux and a factor of ×1.2 increase in pumped flux. Qualitatively, the general conclusion, which can be extracted is that for low incoming neutral fluxes the flow regime in the sub-divertor is free molecular and therefore the interaction of particles with the stationary walls, as for instance the pumping gap panel, is more significant compared to the case of higher fluxes, in which the dominant phenomenon is the intermolecular collisions. This conclusion will be quantitatively justified in the following section 4.2.3.

Figure 5. Percentage of total incoming particle flux Γin, which flows through each of the individual leakages and openings, in terms of the incoming particle flux Γin, in the case of (a) AEH and (b) AEP sections and ξ = 0.1.
Download figure:
Standard image High-resolution image4.1.2. Influence of the capture coefficient.
In figures 6(a) and (b), the percentage of the total incoming particle flux Γin, which flows through each of the individual leakages and openings, in terms of the capture coefficient ξ, for the case of AEH and AEP sections respectively, is presented. For both cases, the incoming neutral flux Γin was chosen to be equal to 1020 (H2 s−1). For both configurations, it is seen, that as the capture coefficient ξ increases, the neutral pumped flux, increases in a non-linear manner. Similarly, the neutral flux, through the individual leakages as well as the neutral outflux, decrease as ξ increases.

Figure 6. Percentage of total incoming particle flux Γin, which flows through each of the individual leakages and openings, in terms of the capture coefficient ξ, in the case of (a) AEH and (b) AEP sections. The incoming particle flux is equal to Γin = 1020 (H2 s−1).
Download figure:
Standard image High-resolution imageMoreover, in figure 6(a), it is observed that in both sections neutral outflux is always higher than the corresponding pumped flux. Indicatively, for ξ = 0.06, 75% of Γin is directed back to the plasma (i.e. outflux), while the pumped flux is 8.4% of Γin. The remaining percentage of Γin is distributed along the poloidal leakages. In the AEP section (see figure 6(b)), the above behavior is observed only in the case of small values of ξ, namely for ξ = 0.0264 and 0.1. In the case where ξ equals to 0.3 and 0.5, the pumped flux becomes larger than the outflux. By comparing both sections, it is deduced that in the AEH section the percentage of incoming neutral flux, which returns to the plasma chamber (i.e. outflux) is always higher than the one of the AEP section. The main reason is the existence of the pumping gap panel, which interacts with the incoming neutrals and forces them to move backward and towards the plasma side. It is noted that in the section 4.1.4 a more detailed assessment on the influence of the pumping gap panel on the overall particle balance will be performed. In addition, the pumped flux in the AEP section is higher than the one of the AEH section and indicatively in the case of ξ = 0.1, the AEP pumped flux is approximately five times higher than the one of AEH assuming the same incoming flux Γin. Concluding, the capture coefficient ξ has a strong influence on the pumped flux as well as on the outflux, in both AEH and AEP sections. Nevertheless, the value of ξ is limited by engineering constrains, namely the nominal pumping speed of the installed vacuum pump as well as the additional conductance of the connecting pipes.
4.1.3. Influence of the temperature at the targets and baffles.
In figure 7, the percentage of the total incoming particle flux Γin, which goes through each of the individual leakages and openings, for the case of AEH section and for various target and baffle surface temperatures, is presented. The incoming neutral flux Γin is equal to 1020 (H2/s) and the capture coefficient is equal to ξ = 0.1. It is clearly seen that by increasing the surface temperature of the targets and baffles from 400 K to 1000 K, there is almost no influence on the particle flux through the individual leakages and openings. The same conclusion could be extracted for the case of the AEP section (not presented here). The main explanation of this effect is based on the behavior of the product of the gas velocity  times the local number density
  , namely
  , which defines the neutral flux through a leakage. By increasing the surface temperature, indeed the velocity of the gas increases, but the reduction of the local number density (due to the assumption that particles crossing a leakage are immediately ionized and removed from the computational domain) compensates the velocity increase and leads to an almost constant value of the product
  . Consequently, it can be deduced that the surface temperature has a weak influence on the overall particle balance in the sub-divertor volume.

Figure 7. Percentage of total incoming particle flux Γin, which flows through each of the individual leakages and openings, in the case of AEH section, for ξ = 0.1 and various values of target and baffle surface temperatures. The incoming particle flux is equal to Γin = 1020 (H2/s).
Download figure:
Standard image High-resolution image4.1.4. Influence of the pumping gap panel.
In figure 8, the percentage of the total incoming particle flux Γin, which goes through each of the individual leakages and openings, for the case of AEH section and for the case with and without pumping gap panel as well as the case with inclined panel, is presented. The pumping gap panel is inclined by 9° towards the vacuum vessel (maximum inclination angle to avoid collision with the vacuum vessel). The incoming neutral flux Γin is kept equal to 1020 (H2 s−1) and the capture coefficient is equal to ξ = 0.1. It is seen that by completely removing the pumping gap panel (assumed as a limit case) a decrease in the outflux by a factor of ×1.12 is achieved, while the pumped flux is increased by a factor of ×1.33, compared to the case with the pumping gap panel. This is in line with what was mentioned earlier in the section 4.2.1, where it is stated that the existence of the pumping gap panel pushes back the incoming neutral particles in the plasma side through the pumping gap. Furthermore, it is noted that the role of pumping gap panel is to protect the vacuum vessel from plasma radiation and high heat loads due to neutral particles. Therefore, its existence is crucial and instead of completely removing it, it is recommended to tilt it by a given angle. In the case of an inclined pumping gap panel by 9° towards the vacuum vessel, the corresponding decrease in the outflux is by a factor of ×1.08, while a factor of ×1.26 increase in the pumped flux is observed.

Figure 8. Percentage of total incoming particle flux Γin, which flows through each of the individual leakages and openings, in the case of AEH section, for ξ = 0.1 and the cases with and without pumping gap panel as well as an inclined pumping gap panel by 9°. The incoming particle flux is equal to Γin = 1020 (H2/s).
Download figure:
Standard image High-resolution imageIn figure 9, the same quantity is plotted, considering now a 40% smaller (symmetrically towards both directions) in size pumping gap panel, allowing for wider range of inclination angles to be achieved. In this case, the inclination angle ranges between 0° and 27° (direction towards the vacuum vessel). It is seen that by increasing the inclination angle the outflux decreases, while the pumped flux increases. It is noted that the case with 27° inclination angle has the same quantitative behavior in terms of outflux and pumped flux as in the case without the pumping gap panel. Finally, it is expected that in the case of higher incoming fluxes, the influence of the pumping gap panel is expected to be weak. The main reason is that by increasing the incoming neutral flux the average Knudsen number decreases and the gas-surface interaction is not any more the dominant characteristic of the flow. Instead, the neutral-neutral collisions is the main factor, which influence the gas flow behavior.

Figure 9. Percentage of total incoming particle flux Γin, which flows through each of the individual leakages and openings, in the case of AEH section, for ξ = 0.1 assuming 40% smaller pumping gap panel and various inclination angles. The incoming particle flux is equal to Γin = 1020 (H2/s).
Download figure:
Standard image High-resolution image4.1.5. Influence of the closure of the poloidal leakages.
In figure 10, the percentage of total incoming particle flux Γin, which flows through each of the individual leakages and openings, for the case of AEH section, for ξ = 0.1 and assuming the following cases: (i) all leakages are closed, (ii) only #1 and #10 (being one of the largest) leakages are closed and (iii) all leakages are open, is presented. The incoming neutral flux Γin is kept equal to 1020 (H2/s) and the capture coefficient is equal to ξ = 0.1. It is clearly seen, that by closing all the leakages (limit case) an increase in the pumped flux and in the neutral outflux by a factor of ×1.6 and ×1.1 respectively, is observed compared to the case with all leakages open. In the case that only leakages #1 and #10 are closed then compared with the case with all the leakages open, an increase in the pumped flux and in the neutral outflux by a factor of ×1.2 and ×1.04 respectively, is observed. Qualitatively, the main conclusion is that in general the closure of the leakages facilitates the increase of the pumped flux and consequently the pumping efficiency of the sub-divertor, but additionally a significant increase in the neutral outflux should be expected. In reality, the limit case, where all leakages are closed, is difficult to be implemented due to engineering constraints, therefore it is recommended to focus only on the closure of the leakages #1 and #10, which as mentioned before, the estimated increase of the pumped flux is more pronounced compared to the increase of the outflux.

Figure 10. Percentage of total incoming particle flux Γin, which flows through each of the individual leakages and openings, in the case of AEH section, for ξ = 0.1 and assuming all leakages are closed, only #1 and #10 leakages are closed and all leakages are open. The incoming particle flux is equal to Γin = 1020 (H2/s).
Download figure:
Standard image High-resolution image4.2. Numerical results for the 3D 'Low-Iota' and 'High-Iota' sections
In this Section, the 3D effects, which describe in a more realistic manner the flow behavior in the W7-X sub-divertor are taken into account by modeling the corresponding 3D models. It is noted that for these cases, except from the estimation of the overall particle balance, the outcome of each simulation includes the macroscopic quantities of practical interest, as for instance the neutral gas pressure, the velocity streamlines and the local mean free path.
4.2.1. Influence of the incoming neutral particle flux.
In figures 11(a) and (b), the percentage of total incoming particle flux Γin, which goes through each of the individual leakages and openings (as presented in figures 4(a) and (c)), in terms of the incoming particle flux Γin, for the case of AEH and AEP respectively, is presented. It is seen, that in both AEH and AEP sections as Γin increases the pumped flux increases, while the neutral outflux decreases. Moreover, for both sections the pumped flux is a small fraction of the incoming flux Γin compared to the total flux through the leakages. By comparing the values of the pumped flux in the 2D and 3D approximations, it is observed that in the former approach the pumped flux is always a higher percentage of Γin than in the latter one. The main reason is the consideration of the toroidal leakages in the 3D model, which cannot be correctly represented in a corresponding 2D model.
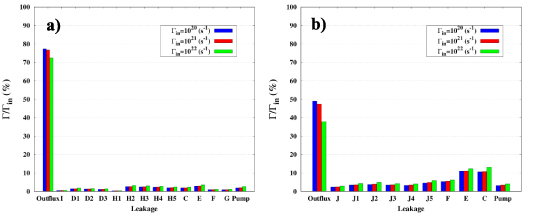
Figure 11. Percentage of total incoming particle flux Γin, which flows through each of the individual poloidal and toroidal leakages and openings, in terms of the incoming particle flux Γin, in the case of (a) AEH section and ξ = 0.06 and (b) AEP section and ξ = 0.0264.
Download figure:
Standard image High-resolution imageFrom quantitative point of view, for the AEH the outflux and the pumped flux range between 72%–77% and 1.9%–2.7% of Γin respectively, while for AEP the outflux and the pumped flux range between 38%–49% and 3%–4% of Γin respectively. It is noted that in both sections the leakages C and E have the highest neutral flux compared to the other leakages, which is explained by the fact that these two leakages have the largest cross-section area (see table 3) compared to the others. Finally, it is noted that in the AEH section two orders of magnitude increase in Γin results to a factor of ×1.1 decrease of outflux and ×1.4 increase in pumped flux. In the AEP section, the corresponding values are ×1.3 decrease of outflux and ×1.3 increase of pumped flux. The qualitative behavior of the outflux and the pumped flux in both AEH and AEP sections is almost identical compared to the 2D approximation, presented in the section 4.1.4. Finally,
4.2.2. Influence of the closure of the toroidal leakages.
In figures 12(a) and (b), the percentage of total incoming particle flux Γin, which goes through each of the individual leakages and openings, for the case of AEH and AEP sections respectively and assuming all leakages closed, only C, E and F toroidal leakages closed and all leakages open, is presented. The incoming neutral flux Γin is equal to 1020 (H2 s−1). It is clearly seen, that by closing all the leakages (limit case) for AEH an increase in the pumped flux and in the outflux by a factor of ×1.9 and ×1.2 respectively is observed. On the other hand, for AEP an increase for both pumped flux and outflux by a factor of ×1.9, is estimated. In the case that only the toroidal leakages C, E and F are closed then compared with the case with all the leakages open, for AEH an increase in the pumped flux and outflux by a factor of ×1.2 and ×1.03 respectively, is observed. Similar factors have been obtained for the 2D configuration presented in section 4.1.5. For AEP, the corresponding increase for both pumped flux and outflux is ×1.35.

Figure 12. Percentage of total incoming particle flux Γin, which flows through each of the individual leakages and openings, in the case of (a) AEH and (b) AEP sections and assuming all leakages are closed, only C, E and F toroidal leakages are closed and all leakages are open. The incoming particle flux is equal to Γin = 1020 (H2 s−1).
Download figure:
Standard image High-resolution imageSummarizing, the quantitative results of the 3D model lead to the same conclusions as in the 2D model, previously presented in section 4.1.5. More specifically, due to the engineering constraints more effort should be made to closing the toroidal leakages, where a more pronounced increase of the pumped flux compared to the increase of the outflux is observed.
4.2.3. Macroscopic quantities—pressure contours, velocity streamlines and mean free path.
This section is devoted to the estimation of the macroscopic parameters in the sub-divertor area, as for instance the pressure, the velocity streamlines as well as the mean free path λ, for both AEH and AEP sections. Due to the complexity of the 3D geometry, four slices in the toroidal direction have been chosen for presenting all the estimated quantities. The position as well as the name of each slice are presented in figures 13(a) and (b). Moreover, it is noted that the mean free path λ has been estimated, based on the expression

Figure 13. (a) AEH and (b) AEP sections have been split to four slices in the toroidal direction, including their corresponding naming.
Download figure:
Standard image High-resolution imagein which n is the local number density and d is the molecular diameter of hydrogen. This expression is valid in the case of a Hard–Sphere intermolecular potential and applied in all the present DIVGAS simulations. To characterize the degree of rarefaction the Knudsen number is introduced and is defined as  . The quantity
  is chosen as a characteristic length of the flow and equals to the square root of the corresponding pumping gap area, namely
  equals to 0.39 for AEH and 0.21 for AEP sections respectively. It is possible to distinguish several regimes of gas flows with respect to the Knudsen number. More specifically, when Kn ⩽ 0.001 the mean free path is much smaller than the characteristic length of the flow and the hydrodynamic Navier–Stokes–Fourier (NSF) equation is applicable. In this case, the flow regime is called viscous or hydrodynamic. When 0.001 < Kn ⩽ 0.1, the slip flow regime is met, in which still the continuum medium approach is valid and the NSF equation is subject to slip boundary conditions. When 0.1 < Kn ⩽ 10, the so-called transitional regime is met, while for Kn > 10 molecules move without any collision between them. This regime is called free-molecular or collisionless.
In figures 14 and 15, the corresponding molecular hydrogen pressure contours overlaid by velocity stream lines as well as the mean free path based on expression (4) are plotted, for each AEH slice and for two values of incoming particle flux Γin, namely 1020 and 1022 (H2 s−1), respectively. Figures 16 and 17 show the analogous results for the AEP configuration.

Figure 14. Pressure contour overlaid by the velocity streamlines (left column) as well as the mean free path λ (right column) for each of the four slices of section AEH (see figure 13 (a)). The incoming particle flux is equal to Γin = 1020 (H2/s).
Download figure:
Standard image High-resolution image
Figure 15. Pressure contour overlaid by the velocity streamlines (left column) as well as the mean free path λ (right column) for each of the four slices of section AEH (see figure 13 (a)). The incoming particle flux is equal to Γin = 1022 (H2/s).
Download figure:
Standard image High-resolution image
Figure 16. Pressure contour overlaid by the velocity streamlines (left column) as well as the mean free path λ (right column) for each of the four slices of section AEP (see figure 13 (b)). The incoming particle flux is equal to Γin = 1020 (H2/s).
Download figure:
Standard image High-resolution image
Figure 17. Pressure contour overlaid by the velocity streamlines (left column) as well as the mean free path λ (right column) for each of the four slices of section AEP (see figure 13 (b)). The incoming particle flux is equal to Γin = 1022 (H2/s).
Download figure:
Standard image High-resolution image
Looking at figure 14, it is seen that as we move along the toroidal (Y) (from slice A1 to A4) direction the pressure distribution seems to be uniform in the largest part of the sub-divertor area. The only exception is the zone area between the pumping gap and the pumping gap panel, in which higher neutral pressure compared to the rest of the volume is observed. Regarding the mean free path λ, it is seen that mean free path in poloidal (Z) direction is smaller close to the pumping gap and then increases as we move further in the sub-divertor volume. On the other hand, moving toroidally (from slice A1 to A4), the mean free path close to the pumping gap vicinity decreases. In the rest of the sub-divertor volume no significant variations of mean free path are observed.
An indicative estimation of the average Knudsen number could be performed in the case of slice A3, in which the average value of mean free path is ∼4 m. In this case, the estimated average Knudsen number equals to ∼10, thus for Γin = 1020 (H2 s−1), free molecular flow regime could be assumed.
Looking at figure 15 qualitatively, the pressure distribution in the toroidal (Y) direction does not have large deviations and is almost uniform. In the poloidal direction, as in the previous case, higher neutral pressure compared to the rest of the volume is observed in the zone area between the pumping gap and the pumping gap panel. Quantitatively, the pressure in general increases compared to the case with Γin = 1020 (H2 s−1). Moreover, in Slices A1 and A3 some vortices are observed between the pumping gap panel and the vacuum vessel. The mean free path qualitatively has the same behavior as before, in the poloidal direction while in the toroidal direction (Y) strong variations are observed. Quantitatively, a decrease of λ is observed compared to the case with Γin = 1020 (H2 s−1) and by performing the same estimation of the average Knudsen number for slice A3, it is deduced that the average value of mean free path is 0.03 m. In this case, the estimated Knudsen number equals to ∼0.07, thus for Γin = 1022 (H2 s−1), slip flow conditions could be assumed. In this case the neutral-neutral collisions play a significant role in the establishment of the flow field. The same estimation of the Knudsen number has been performed in the case of Γin = 1021 (H2 s−1) (corresponding contours are not presented here) at the same slice A3. In this case, the average mean free path equals to 0.4 m, therefore the estimated Knudsen number is ∼1, thus transition flow regime could be assumed.
Looking at figure 16, it is observed that qualitatively for the case of Γin = 1020 (H2 s−1) the pressure distribution in both toroidal (from slice B1 to B4) and poloidal directions is quite uniform. Quantitatively, the pressure in general is higher compared to the AEH section. As we move in both toroidal and poloidal directions, quantitatively the mean free path does not have a uniform behavior. For slice B2, the average mean free path equals to 1.1 m. Consequently, the estimated Knudsen number is ∼5.2, which points to the transition flow regime.
By increasing the Γin = 1022 (H2 s−1) (see figure 17), quantitatively the pressures remain uniform in both toroidal and poloidal directions, but a significant increase of an order of magnitude is observed compared to the case with Γin = 1020 (H2/s). Here, vortices in one side of the pumping gap are observed in slices B1 to B3, a behavior which is associated with the viscous character of the flow. In the poloidal direction, the mean free path decreases as we move deeper in the sub-divertor, while in the toroidal direction λ has a non-uniform distribution and is decreased by two orders of magnitude compared to the case with Γin = 1020 (H2 s−1). For slice B2, the average mean free path equals to ∼0.01 m. Consequently, the estimated Knudsen number is ∼0.047, thus slip flow regime could be assumed. As before, the same estimation of the Knudsen number has been performed in the case of Γin = 1021 (H2 s−1) (corresponding contours are not presented here) at the same slice B2. In this case, the average mean free path equals to 0.1 m, therefore the estimated Knudsen number is ∼0.47, thus transition flow regime could be assumed.
4.2.4. Comparison with experiments and ANSYS free molecular simulations.
A direct comparison between experimental and the present 3D numerical results has been performed using the experimental data as well as the ANSYS numerical data, reported in [23]. It is noted that the ANSYS simulations are based on the similarity between photons and neutral particles in the absence of collisions. In that specific collisionless case, the ANSYS steady-state thermal package, simulates photon emission and reflection from material components for three dimensional geometries.
Two different plasma discharges of the operational phase OP1.2b are considered, with discharge numbers 20 181 010.08 and 20 180 904.31 respectively. The former discharge corresponds to a Standard plasma configuration, while the latter to a High-Iota plasma configuration. For each case, the measured pressure at the sub-divertor  is provided as well as the related incoming neutral flux Γin, obtained by related EMC3-EIRENE simulations (see tables 2 and 3 of [23]). This information together with the ANSYS simulations, presented in table 5 of [23], have been used in the current work to perform a comparison with the corresponding 3D DIVGAS simulations. The detailed comparison is presented in table 4.
Table 4. Comparison between DIVGAS obtained sub-divertor neutral pressure and experimental values for Standard and High-Iota plasma scenarios.
| Discharge 20 181 010.08 | Discharge 20 180 904.31 | |||
|---|---|---|---|---|
| AEH section | AEP section | AEH section | AEP section | |
| Flow regime | Transition Kn ∼ O(1) | Free molecular Kn ∼ O(10) | Free molecular Kn ∼ O(10) | Transition Kn ∼ O(1) |
| Incoming neutral part flux through the pumping gap Γin (s−1) [23] | 3.23 × 10²⁰ | 2.66 × 10¹⁹ | 1.15 × 10²⁰ | 2.78 × 10²⁰ |
Measured pressure  (Pa) [23] (Pa) [23] | 0.014 | 0.0082 | 0.0024 | 0.041 |
Estimated ANSYS pressure  (Pa) [23] (Pa) [23] | Not valid in this flow regime | 0.0041 | 0.0018 | Not valid in this flow regime |
Estimated DIVGAS pressure  (Pa) (Pa) | 0.0093 | 0.0029 | 0.0033 | 0.031 |
By comparing the DIVGAS simulations with ANSYS simulations, valid only in the free molecular range and presented in [23], the obtained relative deviation, defined as  , ranges between 37% and 48%. Based on the fact that the numerical uncertainty of ANSYS simulations is within ∼30% [23] and of the DIVGAS ones is of the order of ∼5% (based on the chosen number of particles, grid cells and time step), the agreement between both numerical approaches is considered to be very good. Moreover, in the case of the Standard plasma configuration, the DIVGAS simulations provide lower pressure values than the ANSYS simulations, for both AEH and AEP sections, while in the High-Iota plasma configuration, the DIVGAS pressure values for both AEH and AEP sections are higher than the corresponding ANSYS ones and still closer to the experimental values.
In general, it is observed that the relative error between experimental measurements and DIVGAS simulations, defined as  , ranges between 24% and 63% for all cases. This comparison is in line with the previous work related to the numerical modeling of the JET sub-divertor, in which ∼50% deviation between DIVGAS and JET experimental results was observed [5]. For all the experimental measurements an uncertainty of 15% is assumed, according to [3, 24]. More specifically, in the case of the Standard plasma configuration the relative deviation between DIVGAS and experimental results in both AEH and AEP sub-divertor sections is higher compared to the case of the High-Iota plasma configuration.
Overall, the present comparison with experiments demonstrates qualitative agreement. In the future and in a more systematic way, this work will be extended to cases with lower Knudsen numbers (i.e. higher incoming neutral fluxes), in which the neutral-neutral collisions dominate the flow behavior and aim to a quantitative comparison with corresponding experimental measurements.
5. Summary and conclusions
In the present work the DIVGAS code has been successfully applied for modeling the 2D and 3D neutral gas flow in the sub-divertor region of the W7-X, for the case of Standard (AEH) and High-Iota (AEP) configurations. The main conclusions, which can be extracted from the above numerical analysis could be summarized as follows; both 2D and 3D simulations show that a large fraction of incoming neutral particle flux i.e. >70% on the low iota (AEH port) side and >40% for the high iota (AEP port) side is leaked back to the main divertor region, the 2D simulations show that higher incoming neutral fluxes facilitate the increase of the pumped flux as well as the decrease of the outflux. The same conclusion is valid for the 3D simulations. More specifically, in the AEH section two orders of magnitude increase in Γin results to a factor of ×1.1 decrease of outflux and ×1.4 increase in pumped flux. In the AEP section, the corresponding values are ×1.3 decrease of outflux and ×1.3 increase of pumped flux.
In both 2D and 3D simulations, the closure of the toroidal leakages facilitates the increase of the pumped flux as well as the neutral outflux towards the plasma. In general, it is recommended that due to the engineering limitations more effort should be made to closing the toroidal leakages, since a pronounced increase of the pumped flux compared to the corresponding increase of the outflux is obtained.
The increase of target and baffle surface temperature has a weak influence on the fluxes in the sub-divertor vicinity and therefore in current and future operational campaigns an increase in plasma power and consequently an increase of the target/baffle surface temperature will not influence the overall particle balance in the sub-divertor.
The inclination of the pumping gap panel has influence on the pumped flux and reduces the neutral outflux towards the plasma. By tilting the pumping gap panel by 9°, in the direction of the vacuum vessel, the outflux can be reduced by a factor of ×1.08, while the pumped flux can be increased by a factor of ×1.26. In general, it is believed that from the engineering point of view, it is easier to adjust accordingly the angle of the pumping gap panel, compared to the closure of the individual leakages, which might be difficult to perform.
From the 3D realistic models, it is deduced that small fraction ∼3%–4% of the incoming neutral flux is being pumped in both AEH and AEP configurations. Therefore, a sub-divertor geometry optimization is necessary considering the inclination of the pumping gap panel to be the easiest modification from engineering as well as pumping efficiency point of view.
The pressure distribution in the toroidal and poloidal direction for both AEH and AEP section is uniform. A non-uniform behavior is observed only in the case of AEH section and in the zone area between pumping gap and pumping gap panel. Formation of vortices are observed in both AEH and AEP sections for the case of high incoming neutral flux (i.e. 1022 H2 s−1) due to viscous characteristics of the flow. For low incoming neutral fluxes (i.e. 1020 H2 s−1) and for the case of AEH section, free molecular flow conditions are expected and therefore neutral-neutral collisions could be neglected. In all the other cases of incoming neutral flux (i.e. 1021 and 1022 H2 s−1) for both AEH and AEP sections, neutral-neutral collisions play a significant role in the sub-divertor area.
A comparison with available experimental measurements of the neutral sub-divertor pressure has been performed for a Standard and High-Iota plasma discharges. The 3D DIVGAS simulations are able to predict qualitatively the experimental results with an obtained relative deviation between simulations and experiments to be 25%–63%.
All the above numerical findings will actively support the optimization of the W7-X particle exhaust, in view of the next experimental campaign OP 2.
Acknowledgments
This work has been carried out within the framework of the EUROfusion Consortium, funded by the European Union via the Euratom Research and Training Programme (Grant Agreement No 101052200—EUROfusion). Views and opinions expressed are however those of the author(s) only and do not necessarily reflect those of the European Union or the European Commission. Neither the European Union nor the European Commission can be held responsible for them. In addition, this work was performed within the 4th and 5th cycles of MARCONI-FUSION HPC (Project DIVGAS-KIT) and also on the HoreKa supercomputer (project RGDsim) funded by the Ministry of Science, Research and the Arts of Baden-Württemberg and by the Federal Ministry of Education and Research. Moreover, we acknowledge support by the KIT-Publication Fund of the Karlsruhe Institute of Technology.