


Abstract
In this work we utilize the recently upgraded Thomson scattering diagnostic to resolve density and temperature plasma profiles after pure deuterium and mixed neon/deuterium shattered pellet injections (SPIs) on DIII-D. This allows us to study individual components of the staggered scheme proposed for disruption mitigation on ITER, consisting of a low-Z material SPI followed by a delayed high-Z SPI. Obtained spatio-temporal density profiles exhibit very different dynamics after dominantly neon and pure deuterium SPIs. The neon SPI causes a fast radiative plasma collapse in a few milliseconds and results in almost flat density profile once the impurity mixes with the plasma during and after the thermal quench (TQ). The deuterium SPI leads to a disruption delayed by ten and more milliseconds, but very limited core fueling can be observed before the disruption. Even during and after the TQ, the edge deuterium density significantly exceeds the core density. 1D transport modeling suggests that this poor core fueling can be explained by strong outward grad-B-induced drift of the injected deuterium. Preliminary simulations show that larger pellet shards and greater injected quantity can be used to improve the penetration of the low-Z material into the core. These results call for optimization and further evaluation of the staggered SPI on ITER.
Export citation and abstract BibTeX RIS

Original content from this work may be used under the terms of the Creative Commons Attribution 4.0 license. Any further distribution of this work must maintain attribution to the author(s) and the title of the work, journal citation and DOI.
1. Introduction
To mitigate consequences of potential major tokamak disruptions in ITER, shattered pellet injection (SPI) was chosen as the primary mitigation technique [1]. This method of massive material injection was pioneered on DIII-D, where it showed greater particle assimilation compared to the massive gas injection (MGI) due to the deeper penetration of solid particles into the plasma and faster material deposition [2, 3]. To support the design of the disruption mitigation system on ITER [4], the SPI is continued to be studied experimentally on DIII-D [5–11], as well as on J-TEXT [12, 13], KSTAR [14–16], HL-2A [17], JET [18, 19], ASDEX Upgrade [20], and also theoretically [21–28]. The main areas of research during past years were the design of SPI systems [12, 20, 29–35], characterization of single [2, 3, 6, 10, 17–19, 24, 27, 36] and multiple injections [8, 14–16, 18, 19, 28], comparison with MGI [2, 3, 13, 21, 37], analysis of SPI interaction with runaway electrons (REs) [5, 7, 9, 25, 26] and effects of magnetohydrodynamic (MHD) activity on SPI [11, 23, 38].
One of important results of these studies was understanding that effective disruption mitigation would require injection of both low-Z and high-Z particles (such as hydrogen or deuterium and neon) [1]. This is because high-Z material significantly increases line radiation from the plasma which helps to dissipate plasma thermal energy during the thermal quench (TQ). Also, plasma cooling tailored by high-Z particles can be used to set the current quench (CQ) rate and keep the electromagnetic loads produced by halo and eddy currents under control. On the other hand, a low-Z injection is beneficial for RE mitigation via collisions since it delivers more particles into the plasma than a high-Z injection owing the increased assimilation (defined as the number of particles mixed with the plasma to the total number of injected particles).
However, it is yet to be decided whether to use a mixed injection, i.e. to inject both low-Z and high-Z materials at the same time, or prefer a staggered scheme, where a high-Z injection follows a low-Z injection with some time delay [39]. It is envisioned, that the staggered approach may improve RE mitigation since an appropriate low-Z injection can dilute the plasma, provide relatively low line radiation of the plasma thermal energy and as a result slowly lower the plasma temperature before it finally collapses which would inhibit the so-called hot-tail RE generation (caused by decoupling of the high-velocity electron population from the bulk if the TQ is sufficiently fast) [24, 28, 40]. The delayed plasma collapse can also provide additional time for penetration of the low-Z material into the plasma as well as less instantaneous dissipation of thermal energy via line radiation. A cartoon of the staggered scheme is shown in figure 1.
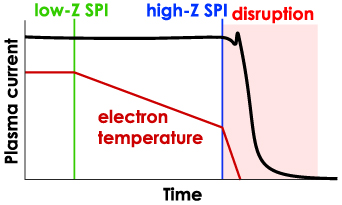
Figure 1. A cartoon of the staggered SPI scheme.
Download figure:
Standard image High-resolution imageNotably, the conclusion of the higher assimilation of the low-Z injection was made using non-local measurements (for example, via measurements of the line-integrated electron density [3] or visible bremsstrahlung radiation [2]). Presently, there is a lack of understanding whether the low-Z injection delivers many particles deep into the plasma, which is crucial for RE mitigation via collisions and assessment whether the staggered scheme would work in ITER as desired. To fill this gap, in this work we present spatially and temporally resolved density and temperature profiles after pure deuterium and mixed neon/deuterium SPIs on DIII-D using recently upgraded Thomson scattering diagnostic and compare them with results of 1D transport modeling. This expands the observations firstly reported in [41] and complements similar studies recently done on LHD for fueling solid pellets [36].
The structure of the remaining paper is as follows. The experimental setup is presented in section 2. The measured density and temperature profiles after SPIs are provided in section 3. The comparison with 1D transport code INDEX is given in section 4. The discussion and summary can be found in sections 5 and 6 respectively.
2. Experiment and diagnostics
DIII-D is a tokamak with a D-shaped cross-section, major radius  m, minor radius a = 0.67 m [42]. It is equipped with two SPI systems, located at toroidal angles 15∘ and 135∘. In this work we analyze only injections at 135∘ since this location is closest to the Thomson scattering spatial points (see figure 2(left)). Poloidally, pellets were injected at the low field side (LFS), at 47∘ above the midplane (see figure 2(right)).
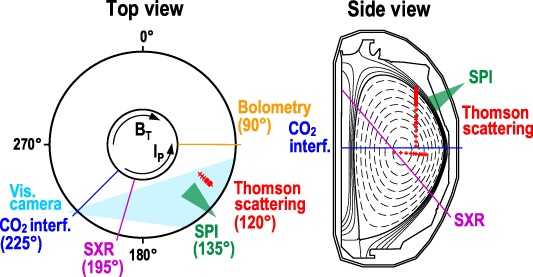
Figure 2. Locations of the SPI and main diagnostics used in the experiment. The poloidal fan of bolometry chords is not shown in the side view.
Download figure:
Standard image High-resolution imageTwo types of shattered pellets were injected in these experiments. One pellet type consisted of a neon and deuterium mixture, with an inner cylinder made of 385 Torr·l of Ne ( atoms) and 304 Torr·l of D2, surrounded by 88 Torr·l of D2 shell (the shell acts like grease easing the pellet launch). Despite the pellet composition is about 50% of Ne and 50% of D2, the disruption dynamics is mostly determined by Ne as it will be seen in section 3 in comparison with pure D2 SPI. The second pellet type consisted of 672 Torr·l of pure D2. Mixed Ne/D2 pellets were injected into lower single null neutral beam heated Super H-mode plasma with plasma current
  MA, toroidal magnetic field
  T, and total plasma stored energy
  MJ (as calculated by EFIT [43]). Pure D2 pellets were injected into upper single null electron cyclotron and neutal beam heated H-mode plasma with
  MA,
MA,  T, and
  MJ. Since the target plasmas are different, the comparison of two SPIs is meant to be qualitative.
A key diagnostic in this experiment was Thomson scattering providing spatially and temporarily resolved density and temperature profiles at the toroidal angle of 120∘. Two groups of Thomson scattering channels were used to obtain these profiles. One group (43 spatial points) measures in the vertical plane, and another group (10 points) measures in the horizontal plane as shown in figure 2. This configuration provides observation of both edge and core plasmas. During a recent upgrade, all Thomson channels were equipped with narrow-band polychromators (installed in parallel to standard wide-band polychromators) which allowed reliable measurements of the electron temperature down to the order of 1 eV. Narrow-band polychromators also increased the system resilience to pollution from strong line radiation caused by massive material injection. However, some spatial points may occasionally have no robust spectral fit, and thus be omitted from profiles. Since there are up to 7 lasers firing in the vertical plane and up to 2 laser firing horizontally, a relative time shift of these lasers can be adjusted to fire them in a so-called bunch mode to span over an arbitrary time window and measure evolution of the density and temperature profiles after SPI in greater detail. Another important recent upgrade of the Thomson scattering was commissioning of an asynchronous trigger (initiating the bunch mode, for example, by the pellet ablation light), which provided a way to reliably catch the post-injection plasma profile's dynamics despite the natural jitter of the pellet arrival time.
The line-integrated electron density  was measured using a midplane radial chord of the CO2-interferometer [44]. A central channel of the soft x-ray diagnostic [45] was used to observe the plasma cooling after injections. The radiated power was reconstructed using an array of bolometers spanning the whole poloidal plasma cross-section. Due to the lack of bolometers' absolute calibration in the considered discharges, only qualitative analysis of the radiated power is possible. A visible camera [46] was used to document the SPI arrival at the plasma edge and observe the penetration of the pellet shards into the plasma. The n = 1 mode amplitude of the radial magnetic field was measured using an array of magnetic probes located at the LFS midplane. The Thomson profiles were mapped to the normalized poloidal flux using EFIT reconstructions made every 0.1 ms.
3. Experimental dynamics of density and temperature profiles after SPI
The injection of mixed Ne/D2 shattered pellet led to the disruption in about 3 ms after the pellet arrival as shown in figure 3(left). It can be seen that the SXR signal increases after the pellet arrival (this is presumably related to formation of non-thermal electrons [9]) but then quickly falls indicating radiative plasma collapse. This abrupt plasma cooling on a sub-ms timescale presents a typical TQ on DIII-D. The total radiated power signal supports the SXR data, with the first radiation flash supposedly associated with increased pellet ablation due to formation of suprathermal electrons around the pellet plume assuming fast enough toroidal transport, while the second flash is typical for dissipation of plasma energy during the TQ. The trace of the line-integrated electron density  exhibits two trends after the pellet arrival: there is slow increase followed by a plateau before the TQ and fast density increase during the TQ. Times of the Thomson scattering measurements, also shown in figure 3(left), clearly demonstrate advantages of the asynchronously triggered bunch mode by covering the time window after the pellet arrival and until the I
 -spike.
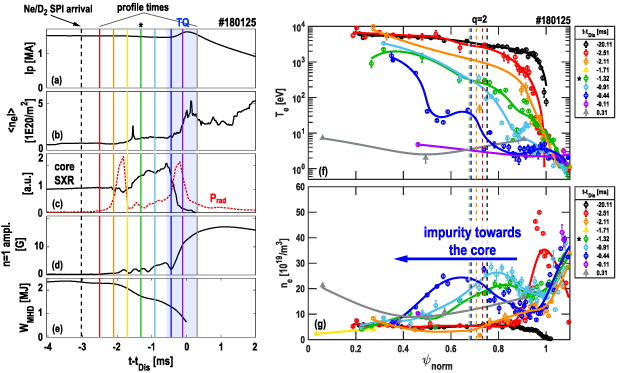
Figure 3. Plasma dynamics after Ne/D2 SPI. (a) Plasma current, (b) line-integrated electron density, (c) core SXR signal, used to observe the plasma cooling, and reconstructed total radiated power by bolometry, (d) n = 1 mode amplitude of the radial magnetic field at the LFS, (e) total plasma stored energy as calculated by EFIT, (f) spatio-temporal evolution of the electron temperature profile, (g) spatio-temporal evolution of the electron density profile.  is the time of the disruption defined as the time of the
  -spike, vertical dashed lines in the profiles' panels show the location of the time-dependent q = 2 surface. The pellet arrival time was determined using fast camera imaging. The pellet pre-shattering speed was 330 m s−1. The profile modeled in section 4 is denoted by
  .
.
Download figure:
Standard image High-resolution imageTemperature and density profiles, presented in figure 3(right), exhibit well resolved plasma cooling and fueling after the SPI and during the TQ. Fast edge cooling (with temperature decreasing from a few keV to a few eV on a ms timescale) and slower core cooling (with temperature dropping from about 6 keV to 2–3 keV) can be seen before the TQ. During the TQ the temperature profile falls to a few eV and becomes almost flat. The density profiles indicate accumulation of the injected material at the plasma edge, outside of the q = 2 surface, and moderate increase, by a factor of 2, of the density in the region of the normalized flux  before the TQ. During and after the TQ the impurity mixes with the plasma core and increases its density by a factor of 2–4 while the density profile almost flattens. The visible camera imaging shows penetration of the pellet shards up to
  0.6–0.7, likely indicating that no unablated fragments travel further and leave the plasma.
The injection of pure D2 shattered pellet, shown in figure 4(left), provides very different plasma dynamics compared to mixed Ne/D2 SPI. The disruption happens much later in this case, in about 15 ms after the pellet arrival. Almost all this period the plasma slowly cools down as indicated by the SXR signal and total plasma stored energy W (decreasing 4-fold). In fact, there is no clear fast and significant decrease of the SXR signal to interpret it as a classical TQ event. Plasma disrupts once n = 1 MHD amplitude reaches about 45 G, which indicates the MHD instability as the cause of the disruption (for comparison, n = 1 is by factor of 3 smaller in the case of mixed Ne/D2 SPI). Such increase of n = 1 signal implies growth of large magnetic islands in the plasma, often observed after massive material injection [47], however, detailed analysis of the tearing modes' structure is out of the scope of this work. An interesting feature is present at the trace of
  , where there is a long period of about 10 ms when the density establishes a plateau. The visible camera imaging shows penetration of pellet shards up to
  0.7–0.8, with significant ablation observed in the scrape-off layer which can be explained by the fraction of small enough shards to fully ablate in the relatively low-temperature scrape-off layer.
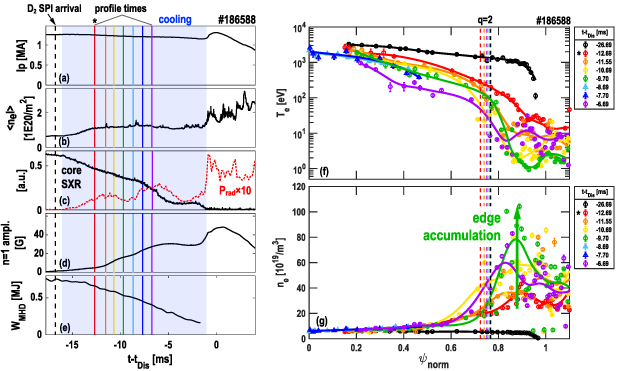
Figure 4. Plasma dynamics after D2 SPI with an early Thomson measurements' window (during and after the TQ). For explanation of separate panels see the caption of figure 3. The pellet pre-shattering speed was 544 m s−1. The profile modeled in section 4 is denoted by  .
.
Download figure:
Standard image High-resolution imageSince the plasma cooling after pure D2 SPI takes a few times longer than after Ne/D2 SPI, the temperature and density profiles show only an early plasma cooling phase in figure 4(right). It can be seen that similar to the mixed SPI injection, only complete edge cooling and moderate core cooling can be seen before the disruption. However, the density profiles exhibit very strong accumulation of deuterium outside of the q = 2 surface (corresponding to  ), by factor of 20 greater compared to the pre-injection profile, and nearly missing penetration of deuterium past q = 2 surface. For example, density profiles obtained in about 1.5 ms after the Ne/D2 SPI arrival (shown in green in figure 3(g)) and in about 10 ms after the D2 SPI arrival (shown in purple in figure 4(g)), show similar density increase by factor of 2–4 in the region
  . This is despite much longer time available for deuterium penetration, higher speed of the deuterium pellet and higher expected delivery speed of lighter deuterium ions.
To better resolve temperature and density profiles closer to the disruption, a similar discharge with pure D2 SPI, but with the Thomson window covering a late plasma cooling phase, was taken, as shown in figure 5. Density profiles, presented in figure 5(g), exhibit an interesting feature of density decreasing over time. Even during and after the I -spike, indicating the end of the TQ, core fueling with deuterium is limited, and no flattening of the density profile can be observed. The visible camera imaging shows penetration of the pellet shards up to
  0.5–0.6. Such plasma dynamics with reduced core fueling is observed in all discharges where D2 SPI leads to MHD-induced disruptions.
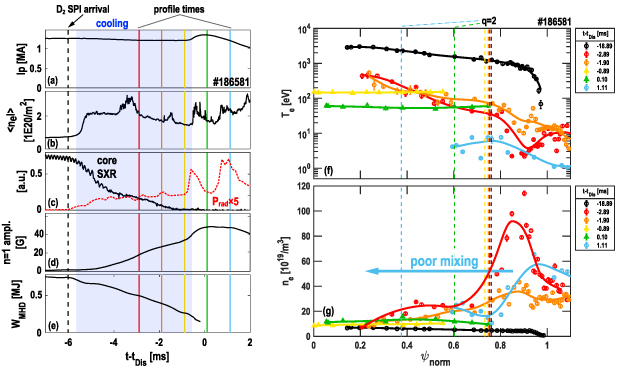
Figure 5. Plasma dynamics after D2 SPI with the late Thomson measurements' window. For explanation of separate panels see the caption of figure 3. The pellet pre-shattering speed was 418 m s−1.
Download figure:
Standard image High-resolution image4. 1D modeling
4.1. Back-averaged SPI model
To interpret the observed evolution of the plasma density profile after pure D2 SPI and explain the relatively poor penetration of deuterium into the plasma core, 1D transport simulations were employed using 1.5D code INDEX [27]. Besides self-consistently solving 1D transport equations in magnetic flux coordinates coupled to 2D Grad-Shafranov equilibrium calculations in the framework of 1.5D (1D+2D) tokamak model [48], INDEX also evaluates the SPI ablation rate based on the Neutral Gas Shielding model [49]. The ablated particles are then included as the surface-averaged neutral source in the particle balance, and the subsequent ionization processes are solved using the rate equations.
To compare INDEX simulations with the experimental profiles, its SPI model was extended to include the effect of outward mass relocation due to the grad-B-induced drift [50–52]. The nature of this drift is following: the magnetic field gradient along the major radius causes the vertical drift of ions and electrons in the opposite directions, and the resultant polarization of the ablation cloud leads to the grad-B-induced drift (also known as E × B drift) of the ablated material in the outward direction.
Our approach to the grad-B-induced drift is not based on first principles but employs simplified considerations following the back-averaged model [53]. In the present model, it is assumed that the atoms ablated from the shards at radius  are deposited uniformly over the exterior plasma volume with
  . In the literature, a similar assumption has also been used to describe the pellet particle deposition in more sophisticated codes such as HPI2 [52]. The back-averaged density increase caused by single shards is then calculated as
 ![$\Delta n_{dep} = \Delta N / [(1+\beta)V_\textrm p(1)-V_\textrm p(\rho^{^{\prime}})]$](https://content.cld.iop.org/journals/0029-5515/64/1/016002/revision2/nfad0905ieqn27.gif) where
where  is the number of atoms ablated from the shard and
  is the interior plasma volume with
  [53]. The extent of the radial drift is determined by factor β. For predictive simulations, it is required to understand the dependence of the radial drift displacement on the pellet and plasma target parameters, such as those studied for non-shattered pellets [54]. However, since a consistent model of the grad-B-induced drift, similar to the one developed in [52] for solid fueling pellets, has not yet been established for shattered pellets, an interpretive approach that scans β to match the experimental profile is taken here as the starting point, with the same β for all ablated shards is assumed in the simulation.
4.2. Comparison with experimental profiles
The updated INDEX code was applied to the pure D2 SPI case (shot #186588, figure 4) with the SPI injection parameters selected in the simulation as follows. The in-vessel injection timing was chosen to produce the SPI arrival time, which was experimentally identified from the visible camera. The shard size distribution was based on the fragmentation model [55, 56] with the number of shards chosen based on sensitivity studies. The average speed is assumed to be 90%–100% of the pre-shattered speed, including a small loss of the forward momentum. The speed dispersion is estimated from the laboratory tests [34] and taken as  with the mass dependence of the shard speed included so that only small shards are distributed in the front and rear of the plume. The information lacking from the experiment but needed for INDEX simulations is the fraction of particles carried as sizable (not as gas or mist) shards and that of the injected mass actually interacting with the plasma. These parameters were set based on the following assumptions that the fraction of the pellet turned into gas during the shattering process is 30% with only 1/3 of this reaching the plasma, while the remaining 2/3 are subtracted from the injected mass as loss. Here, the assimilation of gas or mist has been mimicked using the ablation of tiny fragments of 10−8 m. These particles are included in the simulations separately from the sizable fragments and can increase the density in the scrape-off layer. Use of the visible camera data to estimate the particle source is planned for future work.
The results of simulations for D2 SPI (shot #186588, figure 4) are presented in figures 6(a) and (b) as temperature and density profiles before and after the shards' arrival at the plasma edge. It can be seen that the simulated profiles well reproduce both pre- and post-injection experimental profiles. To obtain such a good agreement, the grad-B-induced drift of the ablation cloud had to take into account. Although the above comparisons between INDEX and the experimental profiles are interpretive to determine the radial extent of the grad-B-induced drift, figures 6(a) and (b) are obtained with β ≈ 4, which suggests that the outward mass relocation may play a role in the density profile and lead to the significant loss of ablated particles. It is roughly estimated that only 10% of the injected quantities are assimilated after pure D2 SPI. An example of the post-injection density profile without the grad-B-induced drift enabled indicates strong overestimation of the core fueling in such simulations as shown in figure 6(c).
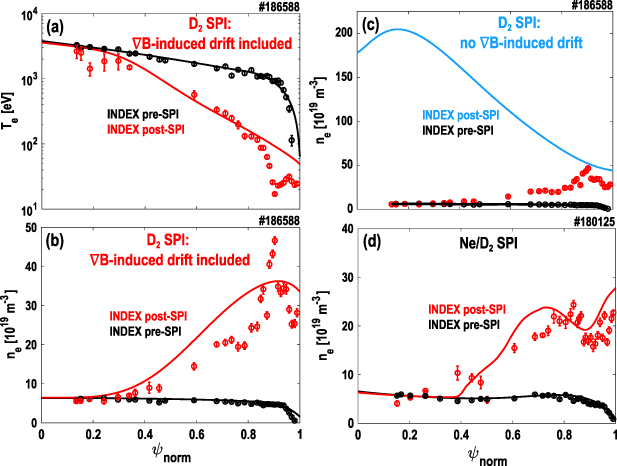
Figure 6. INDEX modeling of plasma profiles before and after SPI: (a) D2 SPI, temperature profile, grad-B-induced drift included, (b) D2 SPI, density profile, grad-B-induced drift included, (c) D2 SPI, density profile, no grad-B-induced drift, (d) Ne/D2 SPI, density profile, grad-B-induced drift is not included but estimated to be insignificant.
Download figure:
Standard image High-resolution imageWe should note that because parameter β was originally introduced to represent the effective plasma volume including the scrape-off layer [53], the above estimate is surprisingly large. This can be partly due to that we overestimated the mass actually interacting with the plasma. The comparison between the ablation rate obtained from the visible camera data [9] and the 1D deposition model suggests that the assimilated quantity is by 2× lower than the injected amount for D2 SPI. In the simulation of figure 4, if we assume that 50% of the injected mass does not interact with the plasma, the factor β to match the experimental profile reduces to 1–2, although still indicating significant particle losses (see figure 8(a)).
Since the INDEX results reasonably match the experimental profiles after D2 SPI, similar simulations were also motivated for the case of the mixed Ne/D2 SPI (shot #180125, figure 3). However, it is noted that analysis of SPI shots with high neon concentration ( %) faces complications other than just enabling/disabling the grad-B-induced drift model. Firstly, neon fragments can significantly perturb the plasma target around the SPI plume via radiative cooling, thus the ablation rate evaluated using the surface-averaging approximation may be less accurate. According to our sensitivity studies, 0.2–0.5× lower ablation than the scaling proposed in [57] leads to a better match with the experimental trend. Secondly, to reproduce the experimental profile, enhanced particle ablation due to formation of non-thermal electrons and pre-TQ MHD instability, both leading to the density peak shifting to the edge [9], were taken into account via increased thermal conductivity. Comparison of simulated and experimental density profiles is shown in figure 6(d). Notably, the reasonable agreement between experimental and simulated profiles is achieved. The thermal transport coefficient required to reproduce the experimental profile is similar to the one reported in [9] (χ ≈ 100 m2 s−1, see figure 8(b)). Although the interplay of effects mentioned above makes it difficult to evaluate their individual role on the drift loss of the mixed Ne/D2 SPI, the SPI assimilation depth has been well captured in the simulated time slice. It is planned for future work to separate individual effects (grad-B-induced drift, non-thermal electrons, pre-TQ MHD instability), as well as to model evolution of the whole post-SPI phase to understand mechanisms of the edge density accumulation.
5. Discussion
The experiment shows that the mixed Ne/D2 SPI acts as expected, causing fast radiative plasma collapse on a timescale of a few ms and mixing of the injected material with the core plasma during and after the TQ. Since the post-injection plasma profiles are also reasonably reproduced in the modeling, we will not focus on the mixed case further in this work. However, the specific composition of such mixed pellets is a matter of future research as they must provide a required CQ rate in ITER.
The pure D2 SPI demonstrated conflicting results. On the one hand, it indeed causes very long plasma cooling on a time scale of 10 ms and a disruption triggered only when MHD n = 1 mode grows large enough (though we should note that the MHD or radiative nature of the disruption would depend on the pellet size), which is favorable for mitigation of the hot-tail RE generation and to soften the thermal loads. On the other hand, it is characterized by relatively poor mixing of the injected material with the core plasma (even during and after the TQ), which is adverse for the collisional suppression of REs as they are expected to be mostly confined at the remaining/restored flux surfaces in the core. This makes questionable applicability of pure D2 SPI as the first stage of the staggered injection approach on ITER.
The interpretive modeling using 1D transport code INDEX provided the results reasonably matching the experimental density and temperature profiles after pure D2 SPI when the grad-B-induced drift was taken into account. Presently, this drift is considered as the dominant mechanism explaining observation of the post-injection density increase corresponding to only 10% of the injected quantity which implies strong outward transport. The plasma temperature appears to be sufficiently high to rule out the non-thermal electron generation in the background plasma and thus the enhanced ablation. Strong diffusive transport would lead to the inward flux, unless there is a very steep density gradient at the inner radius causing strong outward flux which was not observed in the experiment.
According to the modeling of the pellet ablation cloud for solid fueling pellets using different neon fractions [58], poor mixing of pure deuterium SPI is caused by relatively low radiation of the deuterium ablation cloud (or plasmoid) compared to the mixed pellets. This leads to the heating of the plasmoid by the surrounding plasma, increased plasmoid pressure and strong outward grad-B-induced drift as the derivative of the drift speed is proportional to the density and temperature of the plasmoid. The same mechanism seems to be plausible for the shattered pellets, but presently it cannot be verified due to the lack of relevant experimental data and established models.
To understand whether there is room to improve assimilation of pure D2 SPI, INDEX was also used as a predictive tool. In the scan of the pellet shard size it was found that bigger shards increase the core fueling as shown in figure 7(a). Since the shard size is unknown in the experiment, it was chosen as 0.52 mm (on average, with the total number of shards  ) to be close to the experimental profiles (here and below we aim to study trends rather than match the experimental profiles as much as possible). Increasing the shard size from 0.52 mm to 0.60 mm improved the mixing throughout the profile excluding the very core with
  This trend can be explained by the fact that larger shards have more time to fully ablate thus penetrate deeper in the core. However, this is only a trend, and overall core fueling efficiency remains relatively poor.
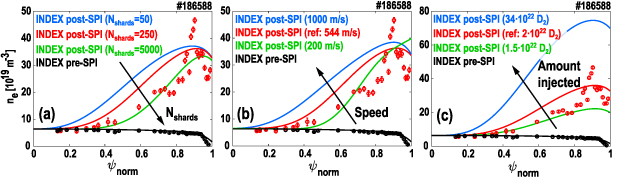
Figure 7. INDEX modeling of (a) the shard size effect (the size of shards depends on the number of shards, with  corresponding to the average shard diameter of 0.60 mm,
  –0.52 mm, and
  –0.24 mm), (b) the mean speed of shards effect, (c) the amount of injected material effect.
Download figure:
Standard image High-resolution image
Figure 8. Parameter sensitivity scan of INDEX simulations on (a) factor β, assuming 50% of the mass does not interact with the plasma and is lost during the shattering process or in other way, (b) thermal transport coefficient χ, indicating the results consistent with the ones reported in [9].
Download figure:
Standard image High-resolution image
Similar study for the different pellet speed suggests that greater speed is favorable for the increased penetration in the core as presented in figure 7(b). A pellet with the post-shattering mean speed reduced to 200 m s−1 decreases the core density while increases it at the edge compared to the reference case with the speed of 544 m s−1. A faster pellet with the speed of 1000 m s−1 shows significantly improved penetration into the core, though the very center ( ) remains almost unperturbed. Notably, in a real experiment faster pellet speed would lead to the decreased pellet shard size due to the stronger shattering process and thus would presumably degrade the SPI-plasma mixing and should not be considered as an independent actuator.
Finally, the scan of the amount injected reveals interesting feature of the density profile changing both in the core (though still outside of  ) and at the edge, not observed in the studies above. According to this scan, the increased amount injected leads to the elevated density. This can be explained by the increased total injected quantity compensating poor assimilation efficiency due to forefront shards cooling the plasma and allowing the following fragments to penetrate deeper in the plasma. However, this may lead to a shorten pre-TQ time with increased perturbations potentially limiting the available time window for the following neon SPI in the staggering scheme.
Notably, the fact of relatively low radiation of the pure deuterium plasmoid, mentioned above, immediately opens a possible way to increase the deuterium mixing with the plasma by doping the pure deuterium shattered pellet with a high-Z material such as neon. This could increase the radiation from the plasmoid, reduce its pressure and decrease the outward drift. Feasibility of this approach was recently demonstrated in experiments and simulations at LHD for solid fueling pellets [36]. However, since the existing modeling for the grad-B-induced drift was presented only for single non-shattered mixed Ne/D2 pellets [58] or pure deuterium or pure neon SPI [59], we leave this route for future work.
These results show that while D2 SPI has issues with the reduced core plasma fueling, it can be still useful as the first step of the staggered injection scheme if its parameters are optimized for ITER.
6. Summary
Study of the temporarily and spatially resolved density and temperature plasma profiles after pure D2 and mixed Ne/D2 SPI on DIII-D revealed poor penetration of pure deuterium into the plasma. This effect persists even during and after the TQ when strong mixing of the injected material with the plasma is expected. The interpretive 1D modeling suggests that only 10% of the injected quantities are assimilated, which implies strong outward transport loss of the ablated materials. The mechanism reasonably explaining the observation is the grad-B-induced outward drift of the pellet ablation cloud, presumably caused by relatively low line radiation and overpressuring of the deuterium plasmoid.
This result indicates that the staggered injection scheme proposed for ITER needs optimization to improve the assimilation of the first, low-Z material injection. Simulations predict that larger pellet shards and/or increased injected amount would improve overall D2 SPI penetration into the plasma.
Acknowledgments
Authors are grateful to Torrin Bechtel for support with EFIT reconstructions and Thomson Scattering group for diagnostic support. This material is based upon work supported by the U.S. Department of Energy, Office of Science, Office of Fusion Energy Sciences, using the DIII-D National Fusion Facility, a DOE Office of Science user facility, under Awards DE-FC02-04ER54698, DE-FG02-07ER54917, DE-AC05-00OR22725 and ITER Organization contract IO/19/CT/4300001939. The views and opinions expressed herein do not necessarily reflect those of the ITER Organization.
Disclaimer
This report was prepared as an account of work sponsored by an agency of the United States Government. Neither the United States Government nor any agency thereof, nor any of their employees, makes any warranty, express or implied, or assumes any legal liability or responsibility for the accuracy, completeness, or usefulness of any information, apparatus, product, or process disclosed, or represents that its use would not infringe privately owned rights. Reference herein to any specific commercial product, process, or service by trade name, trademark, manufacturer, or otherwise, does not necessarily constitute or imply its endorsement, recommendation, or favoring by the United States Government or any agency thereof. The views and opinions of authors expressed herein do not necessarily state or reflect those of the United States Government or any agency thereof.