


Abstract
Ion cyclotron resonance heating (ICRH) is of considerable interest among all auxiliary heating techniques, because it transfers power directly to ions, targets the high-density core, and involves the cheapest radio-frequency (RF) components. During ICRH operation, RF sheaths form on the ICRH antenna itself, nearby hardware, and far-field surfaces. These sheaths are associated with large hot-spot formation and impurity emissions. This work presents high-resolution numerical modelling of RF sheaths in nuclear fusion scenarios using hPIC2, a Debye-scale particle-in-cell code. The modelling reveals a new RF sheath phenomenon which occurs when the RF is resonant with a species ion cyclotron frequency or harmonic in an oblique magnetic field. This resonance of the RF sheath causes modifications of the energy-angle distributions of the ions impacting on the walls, with consequent increase in wall impurity emission. Due to the  scaling of the magnetic field in a tokamak, such cases are possible on divertor or vacuum chamber surfaces, depending on the geometry of the tokamak and the RF heating scenario. A simple physics interpretation using a driven damped harmonic oscillator is proposed, where the ion sheath transit time plays the role of damping the RF sheath admittance. Critically, the resonance leads to increased ion heat flux at the wall as well as increased physical sputtering, despite a lack of increase in RF rectified sheath potential.
Export citation and abstract BibTeX RIS

Original content from this work may be used under the terms of the Creative Commons Attribution 4.0 license. Any further distribution of this work must maintain attribution to the author(s) and the title of the work, journal citation and DOI.
1. Introduction
Radio-frequency (RF) sheaths will play a critical role in nuclear fusion devices over the next several decades. Ion cyclotron resonance heating (ICRH), one main auxiliary heating method dominant in part due to its cost advantage, produces RF sheaths [1, 2]. These RF sheaths form on the Faraday screen, on the adjacent RF limiters or, particularly important for this study, on hardware distant from the antenna via a multitude of far-field mechanisms [3].
The problem presented by RF sheaths is that they are associated with enhanced impurity production. Increased erosion from the Faraday screen and surrounding limiters during ICRH operation is well-characterized [4–7]. This impurity production is attributed to the nonlinear voltage-current trend which produces an additional DC so-called rectified potential. RF sheath rectification has been confirmed experimentally [8, 9] with sheath potentials on antenna limiters measured up to ∼100–150 V in WEST and ASDEX-U [10, 11]. Considerable progress has been made on reducing RF-sheath-induced impurity production near antenna structures, such as antisymmetric power phasing on the antenna straps [12], aligning the antenna with the magnetic field to reduce slow wave (SW) propagation along magnetic field lines [13, 14] and careful choice of the power ratio between current straps [15].
And yet, one potential phenomenon leading to plasma impurities and first wall erosion not addressed by these engineering efforts is the formation of far-field RF sheaths. Over the past three decades, it has become clear that ICRH produces enhanced potentials throughout the scrape-off layer (SOL). A study in NSTX found parasitic ICRH power losses to the divertor even at locations which were not magnetically connected to the ICRH antenna itself [16]. A 2012 study in Alcator C-Mod showed that RF sheaths penetrate radially into the SOL far more than previously known [17]. Further study showed that fast wave (FW) propagation led to magnetically-unmapped pieces of hardware throughout the SOL experiencing enhanced time-averaged plasma potentials whose strengths correlated with that of the FW field [18].
In analysing the extent to which these RF sheaths will produce high-Z plasma contamination and erode the vacuum chamber first wall, numerical modelling is often employed. The community-accepted approach for studying the effects of both near-and-far field RF sheaths on plasma–material interaction (PMI) is to model ion dynamics using a fluid or kinetic Debye-scale code [19]. Both of these models are capable of capturing the angle of incidence of ions crossing the sheath. This is key because, despite the standard in the plasma modelling community being to estimate erosion by assuming ions strike surfaces at normal incidence [20, 21], the sputtering yield of low-Z material from massive incident ions is known to be highly-dependent on the angle of incidence [22]. Furthermore, kinetic modelling is often preferable as it traces the full ion energy-angle distribution (IEAD) of ions impacting the wall, meaning the small fraction of ions whose energy greatly exceeds the sheath potential is captured. This minority can play an important role in far-field RF sheaths forming on surfaces with large ion fluxes. A kinetic modelling study of IEADs for RF sheaths on ICRH antennas was carried out in [23], with the results compared to a fluid code. The present study advances such Debye-scale modelling one step further by passing the IEADs to RustBCA [24], a ion–material interaction code, to obtain accurate sputtering yields.
The main RF phenomenon which has not been examined until the present study is the effect of ion cyclotron resonance occurring in close proximity to, or even within, RF sheaths. By design, ion cyclotron resonances near the antenna and surrounding limiters do not occur, as the aim of ICRH is to target resonances in the plasma core. However, for a given heating scheme, the possibility of impurity resonances on the wall and the effect of RF resonant ion wall sheaths should be examined. To that end, this paper presents findings of a resonance phenomenon in the ion sheath admittance when the RF is near the cyclotron frequency of one or several ion species in the sheath. The resonance is fully characterized, including the damping effects of plasma density and ion temperature. Ion admittance adds to that provided by the electron and displacement currents, and is needed to provide an RF sheath boundary condition for global RF codes. To investigate the implications of such resonances for PMI in future tokamaks, an RF sheath in ITER-like conditions is simulated, and the resulting physical sputtering of both beryllium and tungsten is modelled using RustBCA [24]. Sheath modelling is carried out with hPIC2, a GPU-accelerated hybrid fluid-kinetic code [25].
Critically, the results show that large rectified potentials are not the sole potential cause of enhanced impurity production in RF sheaths. The resonance described in the present study reveals a case in which sputtering yield can more than triple despite a relatively constant floating potential. These findings, along with the subtle dependence of beryllium sputtering yield on angular distribution, demonstrate the need for both kinetic Debye-scale plasma codes as well as binary-collision modelling to fully understand plasma–material interaction in RF fusion scenarios.
In this paper we consider a microscale model of the RF sheath, i.e. a model on the scale of a few times the RF sheath width, the latter being typically 10 or 20 Debye lengths. The goal of a microscale model is to calculate RF sheath and sputtering dynamics in a narrow layer near a material surface, given RF and plasma conditions at the sheath entrance. Output quantities of interest from the microscale model are the RF specific admittance, the rectified sheath potential, and the sputtered fluxes. The RF sheath admittance is used as a boundary condition to model the sheath in macroscale (e.g. whole device) RF codes that follow electromagnetic fast and SW propagation and absorption. The sputtered neutral fluxes provide input to global transport codes that follow neutral-plasma collisions, ionization events, transport and redeposition. Macroscale aspects of the problem await inter-code couplings that are not treated in the present work.
This paper is organized as follows. Section 2 describes the geometry and parameters of the hPIC2 setup. Section 3 includes numerical results: section 3.1 presents the observations of the resonance in admittance; section 3.2 explores the kinetic effects of resonance, particularly the unique effects it has on the phase-resolved ion density and current profiles at the wall resulting from the truncation of gyro-orbits by the wall; section 3.3 details an important characterization of the damping and an extension of previous theory; section 3.4 explores the effects of resonance on ion energy-angular distributions; section 3.5 presents a case-study of ITER-like conditions for impurity production. A summary is given in section 4.
2. Simulation setup
2.1. RF sheath model
Figure 1 describes the geometry of our model. We simulate the plasma sheath in a 1D domain with a uniform mesh in x, under the justification that the domain is small enough that  for all equilibrium quantities. While the number of spatial dimensions for the solution of the electric field is kept to one, we maintain three spatial and three velocity components of all kinetic ions. Walls are assumed to be perfectly neutralizing, and so ions which strike the wall leave the simulation. The plasma is maintained by an upstream ion source which maintains a constant volume-averaged density by sourcing ions into the domain with a non-drifting, Maxwellian velocity distribution at some prescribed temperature Ti
. New ions are placed randomly in the centre third of the plasma domain. This 'smear' source technique was chosen instead of a spatially uniform ion source to avoid placing new ions directly into the Debye sheath
3
. RF sheaths form at either side of the domain due to time-dependent, periodic, antisymmetric Dirichlet boundary conditions on the electric potential
4
for all equilibrium quantities. While the number of spatial dimensions for the solution of the electric field is kept to one, we maintain three spatial and three velocity components of all kinetic ions. Walls are assumed to be perfectly neutralizing, and so ions which strike the wall leave the simulation. The plasma is maintained by an upstream ion source which maintains a constant volume-averaged density by sourcing ions into the domain with a non-drifting, Maxwellian velocity distribution at some prescribed temperature Ti
. New ions are placed randomly in the centre third of the plasma domain. This 'smear' source technique was chosen instead of a spatially uniform ion source to avoid placing new ions directly into the Debye sheath
3
. RF sheaths form at either side of the domain due to time-dependent, periodic, antisymmetric Dirichlet boundary conditions on the electric potential
4


The dimensionless quantities used in this work are the following. Both RF and cyclotron frequency are normalized by the ion plasma frequency
This is a natural value to use, as the normalized quantities are typically between 10−1 and 101 for ICRH applications and SOL plasmas.  is referred to as the ion mobility parameter; in the absence of cyclotron resonance, ion sheath admittance maximizes when
  = 1 [26].
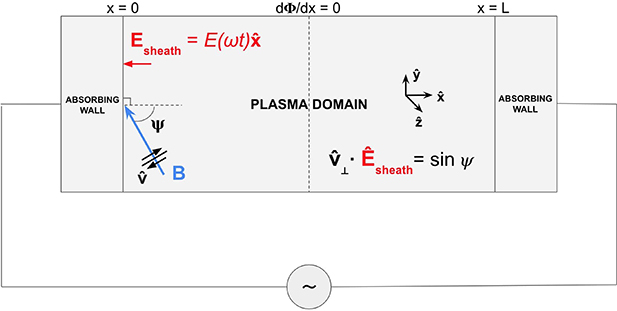
Figure 1. Dual-plate antisymmetric 1D radio-frequency sheath model.  for all quantities. The potential on the plates at x = 0 and L are π out-of-phase. ψ is the angle between the magnetic field and the surface at the boundary.
Download figure:
Standard image High-resolution imageAs usual, Te
is always expressed in electron-volts. Both the peak-to-peak RF voltage  and electric potential
  are normalized by
This is also a natural normalization for voltage because it is the scaling used for determining the electron density via the Boltzmann relation, meaning both the floating potential of a thermal sheath and the time-dependent rectified potential of a RF sheath scale with  .
.  is used to refer to the upstream potential in the middle of the plasma domain. Finally, we normalize various quantities according to the geometry of the magnetic field. If the sheath-producing surface is at x = 0 and
  is the direction normal to the surface, then the normal component of magnetic field is defined as

The angle ψ is then used to describe the angle between the magnetic field and the surface

2.1.1. Ion sheath admittance definitions.
Ion current density normal to and at the wall for species s is evaluated using the first-order fluid moment of the PIC particle distribution, evaluated on a per-mesh-cell basis,
The general expression for the ion contribution to the specific admittance (Ω−1m−2) at frequency ω is given by [26],
where V(t) is the voltage of the wall relative to the upstream plasma and  and we adopt the
  convention for the complex phase. In this section and the rest of the paper, we will refer to the specific ion admittance
  as simply the (ion) admittance. The admittance
  measures how easily an ion current can flow through the sheath for a given RF voltage. It is conventional to separate real and imaginary components of the RF admittance,
where Gi
is the conductance, and Bi
is the susceptance of the RF sheath. The polar coordinate  of
of  in the complex plane is equal to the phase offset between
  and
and  . This phase is largely determined by the ratio of ω to one of the intrinsic ion oscillations such as electrostatic plasma oscillations or cyclotron orbits. When ω is on-par with the dominant intrinsic oscillation, phase-offset is minimized, and
  . Such a sheath is said to be highly conductive for the ions. On the other hand, when
  the frequency of the dominant intrinsic oscillation either exceeds ω (a situation causing ion current to lead RF voltage and
  ), or is less than ω (a case in which ion current responds to, or lags behind, changes in sheath voltage, leading to
  ).
).
In our phase convention, a capacitive susceptance is assigned negative values ( ), while an inductive susceptance is assigned positive values (
 ),
),


In equation (11) the angle bracket operator  on a generic function of time a(t) denotes the time-average over one RF period
  ,
,
For example, the rectified potential in the plasma bulk is obtained from the time-averaged potential over one RF period,
Finally, the admittance  was normalized with respect to a reference specific ion plasma admittance (Ω−1 m−2),
which yields,
where  and
and  are the normalized conductance and susceptance respectively. It is also common expressing the electrical behaviour of a RF sheath using the RF sheath impedance zi
instead of the admittance,
are the normalized conductance and susceptance respectively. It is also common expressing the electrical behaviour of a RF sheath using the RF sheath impedance zi
instead of the admittance,
which can be simply obtained by inverting the values of RF sheath admittance.
2.2. Numerical parameters
In this work, all plots showing admittance trends were obtained using one hPIC2 simulation per data point. Each simulation used 108 macroparticles, and was configured using a uniform mesh with 200 elements, 100 electron Debye lengths in length. This means that each mesh element contained, on average, 500 000 macroparticles. Such a high number of particles per cell (PPC) allowed for a very low noise evaluation of Ji via equation (10). Two mesh nodes per Debye length were sufficient to sample the Debye sheath.
A time step of 10−10 s was used. The simulation domain was initialized with  everywhere. Boltzmann electrons were employed, with Te
held constant at 10 eV. Special care was required to enforce charge conservation in the presence of displacement current for Boltzmann electrons; see appendix
everywhere. Boltzmann electrons were employed, with Te
held constant at 10 eV. Special care was required to enforce charge conservation in the presence of displacement current for Boltzmann electrons; see appendix  and
and  were constant, averaged over several RF periods. The ion currents were then extracted from the last 10 RF cycles to account for the formation of harmonics in the rectified potential (harmonics in RF sheath potentials were previously seen in the sheath model of Lieberman [27]). Real and imaginary components of the ion sheath admittance were obtained using equation (11).
Each simulation used 1 MPI process, each with 1 AMD Milan CPU with 64 OpenMPI threads, using 256GB of DDR4 RAM, and 1 Nvidia A100 GPU with 6912 CUDA cores and 40 GB of 1935 GB s−1 GPU memory (312 TFLOPS). The combined processing power of the GPU and OpenMP threads allowed for very high fidelity simulations (500 000 PPC) to simulate to ion equilibrium time in a matter of a few hours. Parameter scans were made much more feasible by scheduling tens of such simulations at a time thanks to the UIUC NCSA Delta Computing Center. The combined data from these experiments was obtained using super computing GPU-accelerated hardware which would require hPIC2 over 10 years of run time in single-core CPU mode.
3. Numerical results
3.1. Observation of admittance resonance
This section introduces observations and results on the formation of an admittance resonance in a magnetized RF sheath at oblique magnetic field angles. Specifically, a resonance is observed in the ion sheath admittance when the RF is in the proximity of the ion cyclotron frequency. For these simulations, a pure deuterium plasma was used. RF was fixed at  MHz, which is in the range of ICRH frequencies used for example in the WEST tokamak [28]. The magnetic field strength was the scaling parameter for each simulation.
Figure 2 shows the behaviour of the real (figure 2(a)) and imaginary (figure 2(b)) components of the RF sheath ion admittance, and of the rectified potential  in the plasma bulk (figure 2(c)). The plot is presented as a function of the normalized frequency
  (calculated by inverting the magnetic field value for each case and scaling by
  ), over an interval of frequencies spanning from one-half to three ωci
's.
), over an interval of frequencies spanning from one-half to three ωci
's.

Figure 2. (a) Real, and (b) imaginary components of the normalized RF sheath admittance  from equation (11), and (c) rectified sheath voltage
  from equation (17) vs. normalized frequency
  . Each plot is at four selected values of the magnetic angle ψ of 30∘, 45∘, 70∘, 80∘, showing the development of a resonance at oblique angles. Calculations were performed with the hPIC2 code, for a range of magnetic fields across ion cyclotron resonance of deuterium; RF voltage
  electron temperatures.
Download figure:
Standard image High-resolution imageThe plot includes data from four magnetic field inclinations: 30∘, 45∘, 70∘, and 80∘. Several outstanding features emerge from the plots. First of all, at small magnetic inclinations (see the  case in figures 2(a)–(c), brown curves) the conductance (figure 2(a)) exhibits a local maximum at the ion cyclotron frequency,
  . In the RF sheath ions are resistive, with peak conductance of the order of
  , that is only 1% of the ion plasma conductance. At those small inclinations, the susceptance (figure 2(b)) remains positive, meaning that the RF sheath exhibits inductive behaviour. However, as magnetic inclination increases, the peak in conductance becomes more pronounced, and the susceptance develops a pronounced well, with a transition from inductive (
 ) to capacitive (
 ) behaviour. At larger inclinations, and for frequencies in proximity to the ion cyclotron frequency,
  , the RF sheath becomes a better conductor, with peak conductance on the order of
  , that is 10% of the reference plasma ion conductance.
From the trends observed in figure 2 we can define a resonant frequency ωr :

which is the frequency where the conductance has its maximum. At large angles, a capacitive response ( ) is seen for
  where the effect is not washed out by broadening. Furthermore, a second resonance appears near the second cyclotron harmonic,
  for the highly oblique case,
  . Unexpectedly, at those large angles a resonance peak develops also at the half-resonance,
  . This is a rectification phenomenon, arising from a non-linear interaction between the twice-oscillating floating potential and the cyclotron frequency.
3.2. Sheath depletion at resonance and anharmonic ion current
One striking phenomenon that occurs during resonance is sheath depletion, which is characterized by a fraction of the RF period during which the ion density ni
drops an order of magnitude, and Ji
drops to zero, at the wall. Sheath depletion occurs when the RF sheath excites ion gyro-motion to the point that the average Larmor radius is a significant fraction of the sheath width. As excitation of gyro-motion scales with  , this effect is observed at oblique angles.
Figure 3 shows the normal component of ion current density versus time for the semi-oblique case of  . In figure 3(a) we see a special low-frequency case of
  . Here, ions complete two gyro orbits per RF period. The phase-shift closely resembles the current–voltage relationship of a capacitor, with the small fundamental component of the current
  out-of-phase with V. This also makes sense if we look at figure 2, where for the corresponding frequency,
  . In figure 3(b), we see the current profile for
  . Here,
  and
and  , meaning the phase-shift between Ji
and V is less than
, meaning the phase-shift between Ji
and V is less than  yet still greater than 0. Higher harmonics have formed in
  . In addition, a peculiar phenomenon has begun to develop: for a brief stretch of time per cycle, the ion current at the wall is positive, flowing back into the plasma. Increasing ω even further to resonance (figure 3(c)) causes the current to change phase toward a mildly inductive regime, with most of the current amplitude coming in the form of conductance. This frequency, which represents the peak of ion admittance in the resonant regime, results in a phase shift of the ion current such that
  , meaning the sheath is highly conductive to ions. At the frequency depicted in figure 3(c), the gyro-orbit is maximally driven by the RF voltage and the amplitude of
  is greatest. Due to finite Larmor radius effects,
  has departed from a harmonic profile. The current profile has formed a pedestal and a portion of it is positive, meaning the ion drift velocity briefly points from the wall back into the plasma. For
  , the phase continues to shift, asymptotically approaching
  . For
. For  (figure 3(d)), the ion contribution to the sheath is almost purely inductive. Above this frequency (not shown),
  decreases in amplitude and does not change in phase.
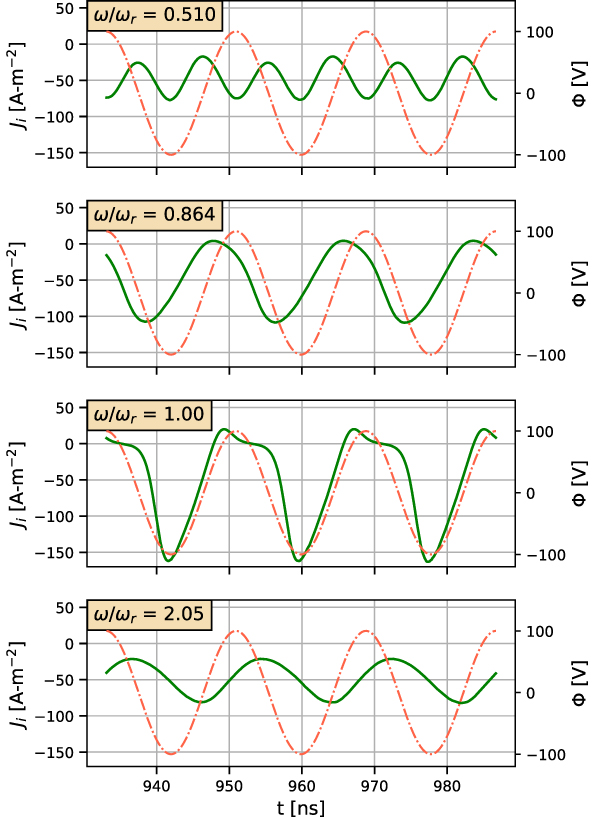
Figure 3. Sheath ion current for various frequencies at the semi-oblique case of  . Red dashed line: sheath potential; solid green line: sheath ion current. The smooth
  profile is the result of the extremely high PIC fidelity achieved from a large PPC.
Download figure:
Standard image High-resolution imageFigure 4 demonstrates the deformation and inversion of IV waveforms in phase space at different resonances for  . Ion currents are normalized by their amplitude
While this normalization is appropriate for comparing the shape of the IV waveforms across simulations with potentially varying amplitudes of  , the reader should take note that it has the effect of encoding the magnitude of
  into the y-offset of
  . Currents whose amplitude is small compared to their magnitude will result in
  for more time steps. On the other hand, currents whose amplitude is a significant fraction of their magnitude will result in
  . In other words, the closer
  is to 0, the greater the ion admittance is.
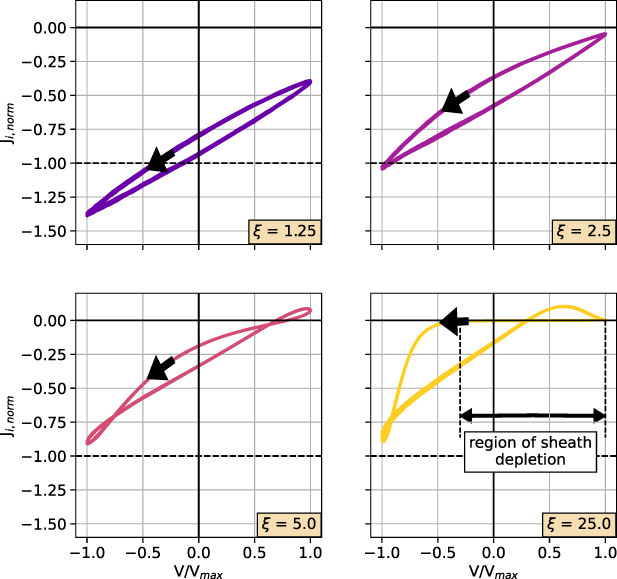
Figure 4. IV waveforms near cyclotron resonance ( ), demonstrating sheath depletion as a function of RF Voltage ξ. Arrows indicate the direction of time. As voltage increases, Larmor radius increases, leading to sheath depletion, i.e. long pedestals where
  .
.  is defined in equation (22). Current over ten RF periods is plotted, meaning line thickness indicates the variance in
  .
.  and
and  for these simulations.
Download figure:
Standard image High-resolution imageThe purpose of this transformation is to emphasize the profile of  in phase space. Figure 4 gives a clear demonstration of the anharmonic effects on ion current across the resonance with increasing RF voltage. Since the RF voltage provides the driving force, sheath depletion becomes more dramatic with increasing amplitude ξ (recall that
  is the normalized RF peak-to-peak voltage). Note that, for the plot of figure 4, ion current over ten RF periods is plotted, thus the thickness of the line is an indication of the variance in
  where ϕ is a fixed RF phase. As we start from a low RF voltage of ξ = 1.25,
  is entirely negative throughout one period, flowing toward the wall. Doubling the voltage to ξ = 2.5 increases the amplitude of
  by shifting the low-current tail of the contour upward. This can be attributed to an increase of both Larmor radius and gyrocentre motion in the RF electric field
5
. As some ions miss the wall in their orbit, they are soon propelled back into the plasma, contributing a positive amount to the overall ion current. As we double voltage again to ξ = 5, the contour begins to invert. Now, near the high-current side of the contour, we begin to see a steeper curve. Ions have increased their gyromotion to the point where they are more directly striking the wall. However, the increase in Larmor radii means that the fraction of ions which miss the wall are even more propelled back into the plasma, leading to
by shifting the low-current tail of the contour upward. This can be attributed to an increase of both Larmor radius and gyrocentre motion in the RF electric field
5
. As some ions miss the wall in their orbit, they are soon propelled back into the plasma, contributing a positive amount to the overall ion current. As we double voltage again to ξ = 5, the contour begins to invert. Now, near the high-current side of the contour, we begin to see a steeper curve. Ions have increased their gyromotion to the point where they are more directly striking the wall. However, the increase in Larmor radii means that the fraction of ions which miss the wall are even more propelled back into the plasma, leading to  for a short range of time steps. We can see an even more dramatic effect as we increase RF voltage to ξ = 25. Examining the high-current side of the RF period first (the left-hand side of the contour) we see a very sharp drop from
  down to maximum current. The ions have been excited to such a degree that a single Larmor orbit is sufficient to traverse the entire sheath. The ions with the largest radii strike the wall and leave the simulation. Soon after, there remains a fraction of the ion population with a slightly smaller Larmor radius, yet still large compared to the sheath width. These ions curl back out of the sheath, traversing the sheath directly. Enough ions leave the sheath during this period that the sheath becomes entirely devoid of ions, as evidenced by the long flat portion of the contour near
  for ξ = 25.
The implication of sheath depletion is that it can synchronize the direction of ions in their orbits, significantly increasing ion admittance compared to other cases where the gyro-radius is not a significant fraction of sheath width. However, in order for sheath depletion to occur in the first place, the sheath must be quite narrow. The next section demonstrates how a narrow sheath width actually presents a damping effect to the RF driving force on the ions.
3.3. Ion admittance damping due to sheath transit time
It was observed that, in certain conditions, the resonance peak broadens, and ωr shifts below 1. This phenomenon, referred to as admittance damping, is controlled by plasma density and ion temperature. These observations can be partly explained by the modification of the sheath width which plays an important role in setting the ion transit time across the sheath, as does the ion temperature.
Figure 5 highlights damping as a function of ion temperature for the semi-oblique case of  . Te
was kept constant at 10 eV. As ion temperature increases from 5 eV to 1 keV, the real part of admittance broadens slightly and decreases significantly in amplitude by more than 90%. The imaginary admittance profile decreases by more than one order of magnitude and does not appreciably broaden. The source of the damping in this case lies in the inability of the RF sheath to significantly alter the trajectories of cyclotron resonant ions with large thermal velocities. A resonance will occur when
. Te
was kept constant at 10 eV. As ion temperature increases from 5 eV to 1 keV, the real part of admittance broadens slightly and decreases significantly in amplitude by more than 90%. The imaginary admittance profile decreases by more than one order of magnitude and does not appreciably broaden. The source of the damping in this case lies in the inability of the RF sheath to significantly alter the trajectories of cyclotron resonant ions with large thermal velocities. A resonance will occur when  regardless of how large Ti
is since, at that frequency, particles complete one gyro-orbit per RF period; however, as explored later, the time the ions spend in the sheath is proportional to the sheath width divided by the thermal velocity, making the relative energy gain from the cyclotron resonance small at high Ti
. Finally, the admittance peak at the second harmonic (
regardless of how large Ti
is since, at that frequency, particles complete one gyro-orbit per RF period; however, as explored later, the time the ions spend in the sheath is proportional to the sheath width divided by the thermal velocity, making the relative energy gain from the cyclotron resonance small at high Ti
. Finally, the admittance peak at the second harmonic ( ) becomes more pronounced with greater ion temperature. This is due to the fact that power absorption at the second harmonic increases with Ti
(the ion acceleration due to ion cyclotron resonance is proportional to a Bessel function
) becomes more pronounced with greater ion temperature. This is due to the fact that power absorption at the second harmonic increases with Ti
(the ion acceleration due to ion cyclotron resonance is proportional to a Bessel function  , where m is the harmonic number [29]).

Figure 5. Effect of ion temperature on RF sheath ion admittance, showing that admittance damping increases with temperature. Upper panel: real component of admittance; lower panel: imaginary component of admittance. Calculations performed with hPIC2, for a range of magnetic fields across ion cyclotron resonance of deuterium; ξ = 15,  . Te
was kept constant at 10 eV.
. Te
was kept constant at 10 eV.
Download figure:
Standard image High-resolution imageFigure 6 demonstrates damping as a function of plasma density  . This is one of the most important results of this paper. The effect of increasing plasma density is to shift the resonant frequency ωr
downward and to significantly broaden the resonance peak. For low density, and hence low damping, the conductance is nearly zero away from the narrow resonance. For higher density, an increasing fraction of the overall admittance is real, coming in the form of conductance. Note that the normalized frequency
. This is one of the most important results of this paper. The effect of increasing plasma density is to shift the resonant frequency ωr
downward and to significantly broaden the resonance peak. For low density, and hence low damping, the conductance is nearly zero away from the narrow resonance. For higher density, an increasing fraction of the overall admittance is real, coming in the form of conductance. Note that the normalized frequency  changes dramatically due to the change in
  . The rectified potential
  stays relatively constant throughout this parameterization, meaning observed effects are not the result of a change in sheath voltage.

Figure 6. Effect of plasma density on RF sheath ion admittance, showing that admittance damping increases with density. Upper panel: real component of admittance; lower panel: imaginary component of admittance. Calculations performed with hPIC2, for a range of magnetic fields across ion cyclotron resonance of deuterium; ξ = 15,  .
.
Download figure:
Standard image High-resolution imageThe admittance resonance profile deviates from that of a classically-driven, damped harmonic oscillator. This is because the sinusoidal driving force of the E-field which excites particles' Larmor orbits is superimposed on all the other forces at the sheath entrance. In particular, there is a background admittance resulting from these forces which can be appreciated by examining the nearly unmagnetized limiting case of ψ = 30 in figure 2. The forces in this case combine such that the sheath is inductive to ions, causing a nonzero positive susceptance. The resulting shift in  affects the admittance resonance profile for all resonant cases in magnetized conditions.
One diagnostic we can employ to better understand the mechanism behind damping is the ion sheath transit time (STT). The single-ion STT is defined as the time it takes a particle to travel from the sheath entrance to the wall at x = 0. The sheath entrance location is defined by the Bohm acoustic speed:

Distributions in ion STT at various charge densities can be found in the right-hand column of figure 7. Each row corresponds to one hPIC2 simulation run at the resonant frequency ωr
for one of the densities in figure 6, repeated here: 1015 m−3, 1016 m−3, 1017 m−3, and 1018 m−3. In the left-hand column, we see typical particle trajectories across the sheath where the excitation of the gyro-radius produces a cone-like trajectory. The sheath width narrows with increasing charge density in proportion to the Debye length ( ). As the sheath narrows, ions spend less time in the sheath. But the RF driving force exciting ion gyro-orbits is only present in the sheath. Therefore, at higher charge density, ions experience a resonant excitation for a shorter period of time.
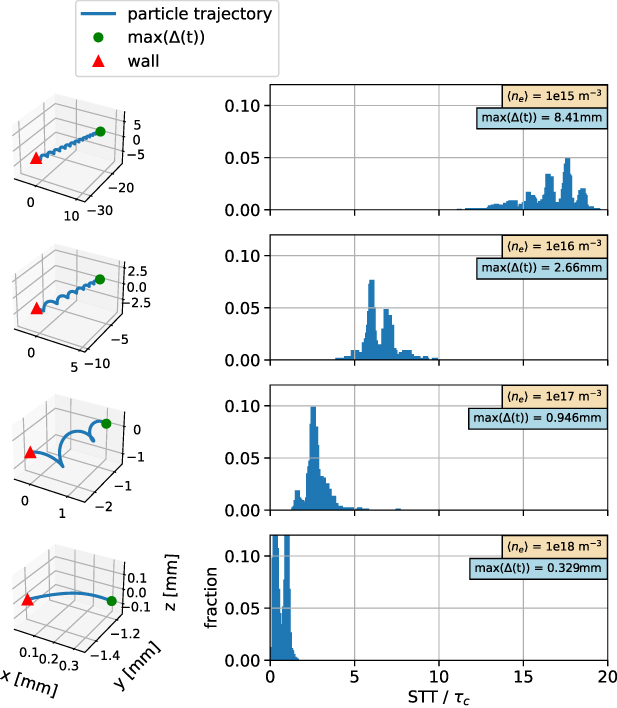
Figure 7. The effect of charge density on the sheath transit time (STT) for an oblique case ( ). Each row corresponds to one simulation at a given charge density at resonance,
  . Right-hand column: 3D trajectory of a typical particle as it crosses the sheath (note the change in scale for the axes at different densities); right-hand column: distribution of normalized sheath transit times for all test particles throughout the entire simulation.
Download figure:
Standard image High-resolution imageThe broadening of the ion admittance resonance due to STT may be captured by the dimensionless factor  , where τc
is the gyroperiod, which can be used to generalize a fit-function for ion sheath admittance (developed by Myra [26] equation (54)), substituting
, where τc
is the gyroperiod, which can be used to generalize a fit-function for ion sheath admittance (developed by Myra [26] equation (54)), substituting  :
:
Plugging in the average experimental STT to obtain γ in equation (24) for each of the four densities in figure 6 successfully reproduces the observed admittance broadening. Figure 8 highlights the damping trend for these four densities (as well as a few additional ones) by comparing the full-width half-max (FWHM) to γ. The trend shows excellent agreement with a linear relationship.
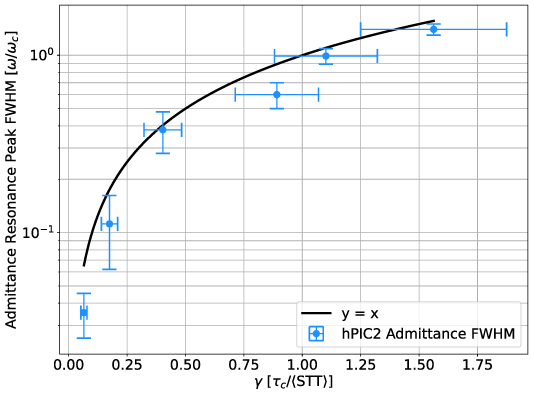
Figure 8. FWHM compared to the γ factor, which depends on STT for a range of plasma densities. Note the semi-log scale. The linear trend confirms the dependence of admittance damping on sheath transit time, which is governed by sheath width and, in turn, by plasma density. Uncertainties in FWHM of the admittance peaks in figure 6 are approximated as follows:  for
for  m−3,
m−3,  for
for  m−3, and
  for all higher densities, since the resonance peak was sufficiently broad for those cases. The uncertainty in γ was calculated by estimating the relative uncertainty in STT at a fixed value of ±0.1.
Download figure:
Standard image High-resolution imageThe broadening of the peak in ion admittance resonance described in this subsection is sufficiently described by inverse sheath transit time and equation (24). As noted earlier, a shorter time spent in the resonant region causes a resonance broadening. This concept is consistent with a number of other resonant phenomena across multiple fields throughout physics. Similar arguments are made in quantum mechanics to predict the broadening of spectral line widths based on the lifetime of the excited state [30–32], as well as in nuclear physics to calculate the half life of highly unstable isotopes [33, 34].
Our observations of ion admittance resonances sheds light on the physical mechanisms responsible for the ion dynamics within the sheath. The consequences on ion energy enhancement, material sputtering and erosion are considered in the next sections.
3.4. Modification of the IEADs across resonance
IEADs of the ions impacting a material surface are a necessary tool for predicting PMI, particularly sputtering. An IEAD is a 2D distribution function of ions crossing the simulation boundary (in this case, representing a material surface) where the degrees of freedom are ion energy and ion angle Θ from the surface normal. In most cases, kinetic plasma models such as particle-in-cell codes are required to accurately analyse PMI because they can provide a detailed IEAD for each surface. The case of an RF sheath in an oblique field near the ion cyclotron frequency presents an extreme case where the rectified potential, which is usually the standard for estimating material sputtering, does not appreciably change across resonance while the IEAD profile changes significantly.
Figure 9 shows D+ IEADs below, across, and above resonance for a high voltage, semi-oblique case. Note here, as in the previous section, the scanned parameter was the B-field, with the RF fixed at  MHz. Here we gain a further understanding of the effects of admittance resonance on PMI. For the case of
  , the ion cyclotron frequency is nearly double the RF. Ion current peaks twice per RF period, each time accelerated by a slightly different potential due to the change in RF phase. The result is a bifurcation of the distribution peak (figure 9(a)). As we approach resonance (
 ), the peak in the distribution shifts slightly higher in energy, while the low-energy tail shifts toward lower Θ, representing a more direct impact at the wall. At resonance (ω = ωr
), the peak of the ion distribution at the wall decreases to ∼20∘, while the most probable energy more than doubles up to 60
), the peak in the distribution shifts slightly higher in energy, while the low-energy tail shifts toward lower Θ, representing a more direct impact at the wall. At resonance (ω = ωr
), the peak of the ion distribution at the wall decreases to ∼20∘, while the most probable energy more than doubles up to 60  . Elias et al found that, for a range of incident angles, RF sheaths produce IEADs with a long band ranging from E = 0 to approximately
  ([23], figure 4). For both the
  and
and  = 1 cases in figure 9, this band is visible in the background (the light green shading between 30∘ and 60∘, in this case up to 30
 ). One interesting finding by Elias et al was that this energy band disappears at high frequencies (
 ). However, despite the relatively low ion mobility of
  for the cases observed in figure 9, this energy band persists near resonance. This exemplifies the ability of cyclotron resonance in the sheath to overcome any lack of ion mobility from plasma oscillations. The main peak, however, is a structure much higher in energy, up to ∼3ξ for
  .
.

Figure 9. Normalized energy-angle distributions for ions impacting the wall, for various frequencies below, at, and above resonance. Deuterium  , ξ = 25,
  .
.
Download figure:
Standard image High-resolution imageLastly, in the region at and below resonance (figures 9(a)–(c)), a critical angle  develops below which no ions strike the wall. This is peculiar because one would expect resonance, which produces the most energetic ions, to accelerate a greater portion of ions to direct impact angles. The width and vertical extent of this depletion band can be explained by the magnetization parameter, defined as
  , where
  is the ion sound radius. The magnetization parameters for each of the four cases in figures 9(a)–(d) are, respectively, 3.36, 2.025, 1.749, and 0.851. For figure 9(a), which is the most magnetized plasma, ions are pulled closest to the direction of the B-field (70∘) and the depletion band is largest, while for the least-magnetized case in figure 9(d), the perpendicular electric field provided by the sheath dominates and the depletion band vanishes.
The effect of admittance damping on the IEAD is highlighted in figure 10. Here we see the IEADs plotted at the resonant frequency  for a range of plasma densities. For all densities, the distribution peak at resonance takes a triangular shape, with a long vertical section at direct angles stretching over a range of energies, as well as an elongated mono-energetic tail spanning a range of angles. When damping is at a maximum (
 = 1018 m−3), the IEAD is a composite of two peaks. The first peak is the resonant triangle we see for all other densities at resonance, here significantly shifted downward as a result of damping. Superimposed onto this peak is another, narrower peak of ions which impact the wall at greater inclination. This second peak can be explained by the severe truncation of the gyro-orbit due to the small sheath size
6
. In addition, at the highest density case of
= 1018 m−3), the IEAD is a composite of two peaks. The first peak is the resonant triangle we see for all other densities at resonance, here significantly shifted downward as a result of damping. Superimposed onto this peak is another, narrower peak of ions which impact the wall at greater inclination. This second peak can be explained by the severe truncation of the gyro-orbit due to the small sheath size
6
. In addition, at the highest density case of  m−3, the critical inclination
  , observed for all other resonant IEADs, has disappeared, and ions are once again able to directly strike the wall (
 ). This can once again be explained by the ion magnetization parameter, which is at a minimum for the high-density case of figure 10(d), where the magnetization is weakest, enhancing the effect of the sheath electric field accelerating ions directly into the wall over the effect of the ion motion parallel to B. Ultimately, damping has the effect of narrowing the peak of the distribution in energy-angle space.

Figure 10. Normalized energy-angle distributions of ions impacting the wall at  for increasing charge density. Damping increases with charge density. Deuterium, ξ = 15,
  .
.  changed significantly for each simulation, due to large changes in
  .
.
Download figure:
Standard image High-resolution image3.5. Effect of resonance on sputtering in the far SOL on divertor and first wall surfaces
The doubling of ion impact energy at the wall throughout resonance (figure 9) calls for further investigation into material sputtering. Specifically, we wish to investigate the effect of resonance on material sputtering inside a tokamak. The question is where precisely such resonant RF sheaths would form in a tokamak. The formation and coupling mechanisms of RF sheaths on hardware far from ICRH actuators is well known [3]. Assuming a fixed ICRH frequency, resonance would occur at different locations depending on the species mass and charge, as well as the magnetic field strength at one of these sheaths. In a fusion plasma, there is a wide range of species, including oxygen impurities as well as trace amounts of neon from gas puffing near the divertor. Due to the  scaling of the toroidal B field in a tokamak, resonances will therefore occur in far-field RF sheaths at various major radii. The only exception to this broad generalization is the set of locations with large plasma densities, since we have shown in section 3.3 that charge density damps admittance resonance. In divertor plasmas, this eliminates locations along the divertor, specifically the near the strike points (the plasma density in ITER is predicted to be as large as
  m−3 [35] at the inner and outer strike points). Enhanced sputtering from cyclotron resonance is therefore not expected in the private flux region or near SOL and we may limit our investigation to far SOL surfaces.
Motivated by these considerations, we ran a series of multi-species RF sheath simulations with hPIC2 [25], and passed the resulting IEADs to RustBCA [24], a binary collision approximation code capable of modelling ion–material interactions such as sputtering, reflection, and implantation. Simulations were run for an isothermal plasma,  eV, at low-density,
  m−3, with atomic composition approximately representative the far SOL and first wall in ITER-like conditions [36], namely, deuterium–tritium in equimolar concentration,
  , helium-4 from fusion ash (
 %) in both charged states 4He+ and 4He2+, helium-3 (3He2+) at 3% concentration used for minority heating [37], as well as other trace impurities (
 %) such as oxygen, neon, and beryllium including all relevant charge states. The complete set of ion densities used in these simulations can be found in table B3. The magnetic field was left as a parameter and scaled from 1 T to 12 T to study the resonance behaviour, with magnetic field inclination
  with respect to the surface, sufficiently oblique to induce resonance and demonstrate its effects on sputtering. The RF wave in proximity to the surface was assumed having peak-to-peak amplitude V
 = 50 V (ξ = 2.5) and frequency of f = 54 MHz. Two walls were considered, made of pure tungsten and pure beryllium. A ZBL inter-atomic potential [38] was used in RustBCA for ion surface interactions [39]. Note that such a purely repulsive potential ignores surface chemistry effects, which may increase overall sputtering. The complete set of material properties for beryllium and tungsten target materials are reported in tables B1 and B2, respectively.
Figure 11 illustrates the calculated sputtering yields resulting from the hPIC2-RustBCA simulations, for the case of tungsten wall. The different panels of the figure are divided by impacting ion species. Note that here and in the following sputtering yields are denoted by Yi
as is conventional, which should not be confused with the RF sheath ion admittance  . In figure 11, peaks in Yi
can be seen at the resonant magnetic field strength for each species. Two results are particularly striking. The first is the behaviour of low-mass, single-or-doubly charged species such as deuterium (figure 11(f)), 3He2+ (figure 11(e)), and 4He2+ (figure 11(d)). Yi
increases significantly at resonance from these incident ions, more than tripling in the case of deuterium (resonant B-field strengths are indicated by solid circles). While the overall sputtering yield of tungsten from incident deuterium is low (
. In figure 11, peaks in Yi
can be seen at the resonant magnetic field strength for each species. Two results are particularly striking. The first is the behaviour of low-mass, single-or-doubly charged species such as deuterium (figure 11(f)), 3He2+ (figure 11(e)), and 4He2+ (figure 11(d)). Yi
increases significantly at resonance from these incident ions, more than tripling in the case of deuterium (resonant B-field strengths are indicated by solid circles). While the overall sputtering yield of tungsten from incident deuterium is low ( ), it must be taken into account that the flux of deuterium at the divertor is the greatest of all species. Such a significant increase of Yi
from deuterium has implications for gross erosion and total impurity production. The second effect is the behaviour of medium-mass, highly-ionized species such as Ne10+ (figure 11(a)) and O8+ (figure 11(b)). For these ions, a local minimum in Yi
is present just below resonance, most dramatic for high charge states such as Ne10+ and O8+. This local minimum results from the off-resonance magnetization of species crossing the sheath, causing them to follow the oblique magnetic field lines, thus impacting the tungsten wall at greater inclination where the sputtering yield is lower. Moreover, for these highly ionized species, resonance increases Yi
only slightly. This is due to the fact that the baseline Yi
is already quite large for such highly-energetic ions. Note that the apparent broadening of the resonant peaks of Yi
with decreasing charge state of neon, oxygen, and beryllium is not a result of increased damping; rather it is simply the result of scaling with the magnetic field instead of
), it must be taken into account that the flux of deuterium at the divertor is the greatest of all species. Such a significant increase of Yi
from deuterium has implications for gross erosion and total impurity production. The second effect is the behaviour of medium-mass, highly-ionized species such as Ne10+ (figure 11(a)) and O8+ (figure 11(b)). For these ions, a local minimum in Yi
is present just below resonance, most dramatic for high charge states such as Ne10+ and O8+. This local minimum results from the off-resonance magnetization of species crossing the sheath, causing them to follow the oblique magnetic field lines, thus impacting the tungsten wall at greater inclination where the sputtering yield is lower. Moreover, for these highly ionized species, resonance increases Yi
only slightly. This is due to the fact that the baseline Yi
is already quite large for such highly-energetic ions. Note that the apparent broadening of the resonant peaks of Yi
with decreasing charge state of neon, oxygen, and beryllium is not a result of increased damping; rather it is simply the result of scaling with the magnetic field instead of  .
.

Figure 11. Per-species sputtering yields for a far-field induced RF sheath. Circles indicate resonant per-species B-field strength. Tungsten target,  m−3; the divertor magnetic field ranges for the inner and outer far SOL in ITER are shown (values calculated using dimensions in [40] along with the
  scaling).
Download figure:
Standard image High-resolution imageFigure 12 reports the sputtering yield for the case of a beryllium wall. The resonant response of beryllium Yi is more or less the inverse of the tungsten sputtering yields, with local minima occurring at resonance rather than peaks. This can be explained by the general rule of thumb that, when the incident ion is more massive than the material atom, the sputtering yield is angle-dominated as opposed to energy-dominated, and peak sputtering yield occurs at oblique angles of incidence [22]. This is why beryllium Yi from deuterium (figure 12(e)) only has a slight decrease but neon (figure 11(a)) has a significant decrease at resonance.

Figure 12. Per-species sputtering yields for a far-field induced RF sheath. Circles indicate resonant per-species B-field strength. Beryllium wall,  m−3; beryllium high-field side and low-field side wall ranges are shown for ITER, calculated using plasma dimensions in [40] and the
  scaling.
Download figure:
Standard image High-resolution imageThis phenomenon may be more concretely appreciated by examining figure 13, which compares the energy-and-angle dependence of beryllium with tungsten, in this case for incident oxygen. From these results one clearly sees that the sputtering yield for oxygen on beryllium is significantly more dominated by incidence angle than is the case for tungsten. Sweeping mono-energetic 400 eV oxygen, for example, across angles of incidence from 0∘ to 60∘, would only slightly vary the sputtering yield of tungsten, while for beryllium the sputtering yield would peak at 70∘ and decrease up by more than a factor of 5 as the angle of incidence approached the normal. Overlayed on the contour plots in figure 13 are the distributions of O8+ at the wall from the hPIC2 far SOL RF simulations. One sees that the effect of resonance is to increase the energy slightly while bringing the impact distribution closer to normal incidence. These variations, along with the sputtering yield contours, explain the difference in resonant Yi response between tungsten and beryllium in figures 11 and 12.
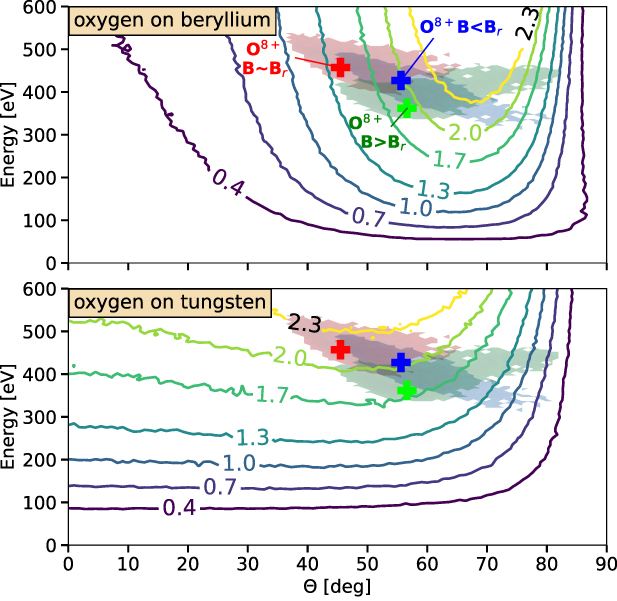
Figure 13. Contours of Yi
from incident oxygen. Top: oxygen on beryllium; bottom: oxygen on tungsten. Red, blue, green distributions: top 70% of O8+ IEADs from large-scale hPIC2 far SOL RF sheath simulations at different B field magnitudes; blue: 5.05 T; red: 6.91 T; green: 9.07 T. Crosses indicate distribution peaks. Te
= 10 eV,  .
.
Download figure:
Standard image High-resolution imageThe tungsten sputtering results (figure 11) indicate that several important species produce peaks or significant increases in Yi
for the range of magnetic fields found in the far SOL along the ITER divertor, including the highest charge states of neon and oxygen, Be4+, 4He2+, and deuterium. 3He2+ also experiences a peak in Yi
for magnetic field strengths found within the outer SOL. The results indicate that far-field RF sheaths on divertor surfaces that are not magnetically mapped to the antenna in a device such as ITER would still produce a significant enhancement in sputtering. On the other hand, despite the local minimum in beryllium sputtering yield at resonance (figure 12), off-resonant B-field strengths will play a larger role for beryllium sputtering, especially for the low-field beryllium wall side. This is made apparent by the peak in Yi
within the low-field blue shaded region. Only 3He2+ and deuterium have a peak in Yi
for the high-field side beryllium first walls. In short, the maxima for Yi
of both beryllium and tungsten occur in magnetic field ranges where each material will be located in ITER. This demonstrates that the full range of the resonant phenomenon will be relevant for ITER sputtering. Finally, beryllium erosion could become a concern in future tokamaks which will experience longer plasma burn pulses. As ITER is expected to have pulses  400 s, and future tokamaks look to achieve ignition and steady-state, erosion of the beryllium first wall may require further attention and possibly compared against high-Z alternatives producing lower sputtering.
Ultimately, the combination of plasma density, ion temperature, magnetic field strength, and wall material serve to demonstrate locations in a real-world tokamak where enhanced sputtering connected to far-field RF sheaths may occur. The choices for these parameters are reasonable values for the ITER far SOL. Nevertheless, the reader should note our choices of sheath voltage and magnetic field inclination, which, as we have shown, modify the resonance profile. While these values do not affect the device locations that will experience enhanced sputtering, further analysis would be required to quantify the effect of these parameters on sputtering yields. Furthermore, net erosion rates are not addressed by this analysis and await coupling to SOL modelling codes that can refine parameters such as plasma density and temperature.
4. Summary
In this paper, resonant behaviour in the RF sheath admittance was presented. This resonance was observed to occur as the RF crosses the ion cyclotron frequency in oblique magnetic fields. The consequence is that the overall sheath admittance, which at low density is dominated by displacement admittance, is brought closer to a conductive regime. Because the transmission and reflection of incident EM waves on an RF sheath is governed by the total sheath admittance, this phenomenon could affect the reflection of radio waves off of various components in the vacuum chamber of a tokamak. We have fully characterized the damping of the cyclotron resonance via sheath transit time for several cases, namely plasma density and ion temperature. In addition, we have obtained high-resolution IEADs across resonance. These IEADs demonstrate a significant jump in ion energy from RF resonant ion acceleration, despite a lack of change in the rectified sheath potential, which is usually a proxy for ion impact energy. A kinetic modelling of ion dynamics within the RF sheath also reveals the change in surface impact angle of resonant ions. Finally, we ran a many-species RF particle-in-cell sheath simulation, modelling a typical far SOL plasma composition. The resulting energy-angle distributions for each species were passed to high-resolution RustBCA (binary-collision approximation) simulations, for both beryllium and tungsten material surfaces, to obtain accurate per-species sputtering yields. The results indicate enhanced sputtering across resonance for tungsten, and an opposite trend—a local minimum—for heavy ion sputtering of beryllium, across resonance. For several incident ion species, the resonant peak in tungsten Yi occurs in the magnetic field range found in the inner and outer far SOLs. Likewise, despite the local minimum for beryllium Yi at resonant field strengths, beryllium sputtering yield from several incident species was also seen to maximize for magnetic field strengths found within the outer far SOL in ITER.
Ultimately, prevention of these far-field RF sheaths will be important going forward. Further research is required to understand methods to mitigate far-field RF sheaths that are both magnetically-connected and magnetically-unconnected to an ICRF antenna. Shine-through is not expected for big machines as they have better core absorption of ICRH-launched waves, but coaxial modes could be an issue especially if the antenna is far from the separatrix. For the example calculations considered, the resonant-specific effects on the ion admittance are substantial and cause important modifications to sputtering yields for some species. More definitive results will require the integration of tools used here with global RF and SOL modelling codes that can predict the amplitude of the RF potential exciting sheaths around the torus walls as well as refining parameters such as the SOL plasma density, temperature and composition.
Acknowledgments
This material is based upon work supported by the U.S. Department of Energy Office of Science, Office of Fusion Energy Sciences, Scientific Discovery through Advanced Computing, Center for Integrated Simulation of Fusion Relevant RF Actuators, Award Numbers DE-SC0018090-PO97564 and DE-AC05-00OR22725/4000158507. This research used the Delta advanced computing and data resource which is supported by the National Science Foundation (award OAC 2005572) and the State of Illinois. Delta is a joint effort of the University of Illinois at Urbana-Champaign and its National Center for Supercomputing Applications.
Appendix A: Charge conservation algorithm AugBisection
Enforcement of charge conservation with Maxwell Boltzmann electrons requires an implicit solve of the modified Poisson relation, inserting the Maxwell Boltzmann electron approximation:
A dedicated scheme needs to be implemented in order to compute the reference density n0. While various schemes have been proposed which satisfy electrostatic or low frequency RF simulations [41, 42], generalized RF simulations introduce a nontrivial displacement current which must also be conserved:

or more explicitly in full integral form:
Elias [43] found that equation (A.3) can be solved implicitly by minimizing  where
where
Equation (A.4) requires an iterative approach where the field across the domain is solved at each iteration. However, the standard Newton–Raphson approach is not applicable because establishing a Jacobian of (A.3) is not feasible given the implicit form of the field solve in (A.1). Nevertheless, it was observed that a guess  which is below the correct value, plugged into equation (A.4), will result in
  . Similarly, a guess for
  that is above the correct value will produce
  . Thus we can use the method of bisection.
Algorithm 1, named AugBisection, is the general bisection algorithm to solve for the reference density with time-dependent, periodic electrostatic boundary conditions. The initial guess for the upper reference point min_above is a multiple P of the reference density from the previous time step. The parameter P is called the augmentation parameter.
| Algorithm 1. AugBisection. |
|---|
1: function
solve_n
 , ,  , timestep, , timestep,  , Te
, ψ, , Te
, ψ, 
|
2: if timestep  3 then 3 then
|
| 3: return |
| 4: end if |
5: tol 
|
6: min_above_tol 
|
7: residual 
|
8: max_below 
|
9: min_above 
|
10: 
|
11: 
|
12: while residual  tol do tol do
|
| 13: if k > 0 then |
14: if
 then
then
|
15: max_below  max(max_below, max(max_below,  ) ) |
16: min_above_residual 
|
17: if min_above_residual  min_above_tol then min_above_tol then
|
18: min_above  min_above min_above |
| 19: end if |
| 20: else |
21: min_above  min(min_above, min(min_above,  ) ) |
| 22: end if |
23: 
|
| 24: end if |
25: 
|
26: 
|
27: 
|
28: 
|
29: residual 
|
30: 
|
| 31: end while |
32: 
|
| 33: end function |
The performance of AugBisection is weakly dependent on the choice of augmentation parameter P. This parameter exists to handle cases where  . The condition on line 17 is reserved for situations where
  . In this case, the search space must be augmented. This augmentation can be repeated as many times as is required. If P is too large, the search-space will be too large and AugBisection will waste the first few iterations reducing the search space. However, P must be large enough to handle cases where there are large changes in n0 per time step. These situations occur when there is a rapidly changing potential at the boundary (large displacement current). This can either be caused by large values of
  or by increasing
  without decreasing the time step. Increasing P will reduce the number of times the augmentation condition (line 17) is triggered for high-voltage cases. The augmentation condition is not triggered for low-frequency simulations because n0 does not change dramatically between time steps. Increasing P will, however, slightly increase the number of iterations for low-frequency cases by broadening the search space. It was observed that any value of P greater than 10 produced sufficiently performant results for a wide range of driving voltages and RFs.
Appendix B: RustBCA parameters used in ITER RF Sheath PMI simulations
Table B1. Figures 11 and 13 tungsten parameters.
| Density (at. µ m−3) | 6.306 × 10¹⁰ |
| Mass (amu) | 183.84 |
| Cutoff energy (eV) | 3.0 |
| Surface binding energy (eV) | 8.79 |
| Bulk binding energy (eV) | 0 |
| Surface binding model | Average |
| Bulk binding model | Average |
| Energy barrier thickness (µm) | 2.512 × 10⁻⁴ |
| Electronic stopping mode | Low-energy nonlocal |
| Mean free path model | Liquid |
| Interaction potential | ZBL |
Table B2. Figures 12 and 13 beryllium parameters.
| Density (at. µ m−3) | 12.347× 10¹⁰ |
| Mass (amu) | 9.012 182 |
| Cutoff energy (eV) | 3.00 |
| Surface binding energy (eV) | 3.31 |
| Bulk binding energy (eV) | 3.00 |
| Surface binding model | Average |
| Bulk binding model | Average |
| Energy barrier thickness (µm) | 2.008 × 10⁻⁴ |
| Electronic stopping mode | Low-energy nonlocal |
| Mean free path model | Liquid |
| Interaction potential | ZBL |
Table B3. Table of ion particle densities used in ITER divertor/lower wall RF sheath simulations.
| Species | ni (m −3) |
|---|---|
| D+ | 4.43 × 10¹⁶ |
| T+ | 4.43 × 10¹⁶ |
| 3He2+ | 2.80 × 10¹⁵ |
| 4He+ | 3.97 × 10¹³ |
| 4He2+ | 3.97 × 10¹³ |
| Ne+ | 1.49 × 10¹³ |
| Ne2+ | 1.68 × 10¹³ |
| Ne3+ | 1.40 × 10¹³ |
| Ne4+ | 1.31 × 10¹³ |
| Ne5+ | 1.12 × 10¹³ |
| Ne6+ | 7.47 × 10¹² |
| Ne7+ | 9.34 × 10¹³ |
| Ne8+ | 1.59 × 10¹⁴ |
| Ne9+ | 1.31 × 10¹⁴ |
| Ne10+ | 1.49 × 10¹⁴ |
| O+ | 1.20 × 10¹⁴ |
| O2+ | 5.62 × 10¹³ |
| O3+ | 3.75 × 10¹³ |
| O4+ | 2.81 × 10¹³ |
| O5+ | 2.25 × 10¹³ |
| O6+ | 1.88 × 10¹³ |
| O7+ | 1.61 × 10¹³ |
| O8+ | 1.40 × 10¹³ |
| Be+ | 9.34 × 10¹⁰ |
| Be2+ | 9.34 × 10¹⁰ |
| Be3+ | 9.34 × 10¹⁰ |
| Be4+ | 9.34 × 10¹⁰ |
Footnotes
- 3
It was found that
 did not change appreciably between a smear particle source and a central Gaussian particle source in the PIC setup.
 - 4
The antisymmetric double-plate model provides nearly identical ion sheath admittance to other alternatives, such as single-plate models. See section 4.2 of [3] for a detailed discussion on their differences.
- 5
When the sheath is strongly inhomogeneous on the scale of the ion excursion in a cyclotron period, the separate concepts of Larmor radius and gyrocentre motion are not precisely defined. In what follows, we will frequently use the gyroradius, proportional to the instantaneous perpendicular velocity
, to describe this excursion amplitude. - 6
See the bottom row of figure 7. A significant fraction of the ion population transits the sheath in less than one gyro-period.

