


Abstract
A hybrid scenario with the minimum safety factor above unity and a safety factor profile with a wide range of low magnetic shear in the core is one of the candidates for ITER operations. Theory predicts that such equilibria are prone to quasi-interchange mode, which was confirmed by observations from several devices. The presence of those 3D quasi-interchange helical modes has both positive and negative effects on plasma performance. On the one hand, they can avoid low mode number instabilities such as sawteeth. On the other hand, they would lead to confinement degradation, significant fast ion losses and toroidal rotation damping. Such modes are observed for the first time in EAST high βp hybrid plasmas achieved with off-axis neutral beam injection (NBI) heating. The mode manifested itself as long-lived saturated helical instability. Notably, when the mode was destabilized, the toroidal rotation profile in the core was completely flattened. The extent of the flattened rotation profile reaches up to half of the minor radius. As the minimum safety factor qmin approaches unity, strong n = 2 and n = 3 harmonics are successively driven unstable as nonlinear consequences of the n = 1 mode. A 3D resistive nonlinear simulation with a realistic tokamak configuration has been applied to reproduce the evolution of long-lived helical instability with the M3D code. The simulated magnetic perturbation shows a strong n = 2 component. As the mode grows, the amplitude of the n = 2 harmonic grows immensely with respect to that of the n = 1 harmonic. The n = 2 harmonic gradually becomes dominant as the mode saturates. In saturation, the initial weak shear safety factor profile in the core becomes completely flat. This change of safety factor profile in the core corroborates a self-regulating magnetic flux pumping mechanism which is considered responsible for maintaining stationary non-sawtoothing hybrid discharges.
Export citation and abstract BibTeX RIS
1. Introduction
The objective of tokamak experiments is to explore operating scenarios that produce steady-state burning plasmas whilst simultaneously optimizing the ratio of plasma energy to magnetic energy (defined as β = 2µ0 /
/ , with
  the volume average pressure and B0 the central toroidal magnetic field). In future economic fusion reactors, the plasma discharge should last long enough to retain a reasonable duty cycle. Since a tokamak scenario with a large fraction of inductively driven plasma current will be inevitably pulsed, the boundary condition of steady state operation requires a large faction of the plasma current to be driven noninductively. Over the years, external current driven systems have been developed and made significant progress in noninductive current driving as well as plasma heating. These systems, though large, sophisticated and hugely expensive, have relatively low current drive efficiency [1]. So the best strategy for sustaining long-pulse operation usually relies on developing operating scenarios that optimize the noninductive, self-generated 'bootstrap' current [2–4]. The so-called 'advanced' scenario (AS) and 'hybrid' scenario (HS) are two such devised candidates [1, 5]. In tokamak plasmas, bootstrap current peaks off-axis, hence significantly altering the magnetic pitch angle. The magnetic pitch angle is expressed in terms of the safety factor q (the inverse average pitch angle). In the AS, bootstrap current provides large fraction of the total current, producing a non-monotonic q profile with a region of reversed magnetic shear. The magnetic shear is defined as s = rq−1dq/dr, with r the minor radius. In the HS, with a smaller fraction, the bootstrap current produces a monotonic q profile with a wide range of low magnetic shear. Due to the relatively low core current in both AS and HS, the minimum value of the q profile (qmin) is above one. This characteristic adds to the benefits of avoiding deleterious resistive MHD instabilities such as sawteeth. However, as qmin evolves towards one and βp increases significantly, the plasma becomes favorable for destabilizing the n = 1 ideal kink-ballooning mode [6, 7]. Such modes, generally referred to as long-lived modes, were observed and analyzed in many devices. In MAST plasma discharges with reversed q profile, the mode was found to cause degradation of confinement, significant fast ion losses and serious toroidal rotation damping [8, 9]. In HL-2A plasma discharge with broad low q profile, the mode has similar deleterious effects and was found to be suppressed by electron cyclotron resonant heating (ECRH), or by supersonic molecular beam injection (SMBI) [10]. In NSTX high β plasmas with a wide range of low magnetic shear q profile, saturated internal modes in some cases even contributed to the complete loss of plasma angular momentum and stored energy [11].
In recent years, such a long-lived saturated mode has sparked significant interest. It has been found that the long-lived saturated mode was associated with 3D helical core formation [12, 13]. Recent 3D magnetohydrodynamic simulations have shown that in hybrid scenarios, a self-regulating magnetic flux pumping mechanism [14] could contribute to form a stationary state in tokamaks. This so-called 'flux pumping' redistributed the current profile, maintaining the minimum safety factor qmin above unity. The most important mechanism responsible for the flux pumping is that a saturated (m = 1, n = 1) quasi-interchange instability in the core drives a near helical flow pattern that acts nonlinearly to sustain the current profile by adjusting the central loop voltage through a dynamo effect [15, 16].
Recently, a saturated long-lived helical mode (LLMs) has been observed for the first time in EAST hybrid plasmas achieved with neutral beam injection (NBI). The presence of LLM would cause many deleterious effects such as confinement degradation, fast ion losses. Notably, in the EAST case, LLM caused severe toroidal rotation damping in the core so that the rotation profile inside the q = 2 surface is flattened. The flattened part of the rotation profile extends up to half of the minor radius. Such a rotation profile would bring further implications for instabilities that happened inside the q = 2 surface, namely 1/1 mode and 2/2 mode. The flattened rotation profile will force 1/1 mode and 2/1 mode to rotate at the same angular frequency, i.e. toroidal mode coupling. A 3D resistive nonlinear simulation with realistic tokamak configuration has been applied to investigate the evolution of long-lived helical instability with the M3D code. The simulated magnetic perturbation has a very strong n = 2 component. As the mode grows and saturates, the n = 2 component increase immensely and gradually becomes the dominant mode number. In the saturated phase, the initial weak shear safety factor profile in the core becomes completely flat. This change of safety factor profile in the core corroborates a self-regulating magnetic flux pumping mechanism that was considered responsible for maintaining stationary hybrid discharges.
This work will focus mainly on the experimental impact of LLM on the EAST tokamak. LLM is experimentally studied and numerically reproduced. The rest of the paper is organized as follows: in section 2, we briefly introduce the diagnostic tools and auxiliary heating systems used in LLM experiments. The phenomenology of the LLMs is detailed in section 3. The 3D nonlinear simulation is presented in section 4. Finally, discussions and conclusions are presented in section 5.
2. Diagnostics
The data presented in this paper are taken from the 2016 EAST experimental campaign. EAST is a noncircular cross section, fully superconducting tokamak, with a major radius R = 1.75–1.85 m, a typical minor radius a = 0.45 m, and tungsten upper divertor [17]. The key diagnostics on EAST for MHD studies are soft x-ray (SXR) arrays, Mirnov coils. A POlarimeter INterferometer (POINT) system [18] is used to measure electron density and Faraday rotation angle. Charge exchange recombination spectroscopy (CXRS) [19] is employed for plasma toroidal rotation and ion temperature measurements. A microwave reflectometry system [20] is used for plasma density measurements. In this study, the structure and dynamics of the LLMs are presented using data mainly from the SXR imaging system [21]. The upgraded SX horizontal U and D cameras were installed in Port P of the EAST tokamak. The schematic is shown in figure 1(a). The U and D cameras covered the whole poloidal section. The vertical camera VC was installed in port C, which covers the low-field side of the poloidal section (figure 1(b)). To study the toroidal characteristics (e.g. rotation direction) of the LLMs and toroidal correction for SX tomography, a vertical array VF with the same poloidal position was installed in port F (figure 1(b)). The VC and VF arrays are separated by a toroidal azimuth angle of 67.5°. For all cameras, the beryllium foil thickness is 12.5 nm, and the spatial resolution is 2.5 cm in the central region. Their maximum sampling rate is 100 kHz.

Figure 1. Schematic of the SXR imaging system on the EAST tokamak. (a) Two horizontal arrays U and D are installed in port P, covering the whole poloidal plasma section, (b) two vertical arrays VC and VF, separated by 67.5° toroidally at the same poloidal location, covering the lower field side, are installed in port C and port F, respectively. The red dotted curve is the last closed magnetic surface flux.
Download figure:
Standard image High-resolution image3. Experimental phenomena
3.1. Experimental setup
A long-lived helical saturated helical mode (LLM) with a mode frequency of 5 kHz and higher harmonics has been observed in EAST hybrid plasmas heated by NBI. The basic plasma parameters of EAST shot 63730 are presented in figure 2. The plasma discharges operate in an upper single-null (USN) configuration. The plasma current is 500 kA. The toroidal magnetic field at the magnetic axis is about 2.24 T. Line average electron density is about 3.1 * 1019 m−3. Ion temperature is about 2 keV. The EAST NBI system [22] has two beam lines located at Ports A and F which are toroidally separated by 112.5°. In LLM experiments, only Port A beam lines were activated. 5 MW of cocurrent direction NBI was overlapped on 2 MW of low hybrid wave injection. Plasma enters H-mode phase after NBI.

Figure 2. The basic plasma parameters of EAST shot 63730; (a) plasma current, line-average electron density from HCN interferometer central chord; (b) NBI source power, LHW source power; (c) poloidal beta βp, core ion temperature; (d) core radiation and Dα emission with respect to time; (e) safety factor profile at mode saturated phase at 3.3 s.
Download figure:
Standard image High-resolution imageIn EAST experiments, a new method was developed to improve the accuracy of core plasma current density and q profile reconstruction on EAST [23–25]. This method is based on extracting the internal Faraday rotation measurements provided by the POINT diagnostic. Detailed comparisons of magnetic surfaces and the q profile reconstructed using external magnetic data against those using magnetic and POINT data are performed. Such a method has produced good results in reconstructing the q profile in EAST sawtooth experiments [24]. The same method is applied to reconstruct the q profiles during the LLM. As shown in figure 2(e), the q profiles during LLM exhibit a monotonic feature with a wide region of low magnetic shear in the core. In such a monotonic q profile, q0, the q value at the magnetic axis is the same as qmin, the minimum q value. As shown in figure 4(d), q0 is kept above unity during LLM.
The typical plasma density and temperature profile during the LLM in EAST shot 63730 is presented in figure 3. The electron density profile in the core region was measured with an HCN interferometer. The edge electron density was measured with a microwave reflectometry system. The complete electron density profile is shown in figure 3(a). The ion temperature profile was measured with CXRS as shown in figure 3(b).

Figure 3. The typical plasma density and temperature profile during the LLM in EAST shot 63730; (a) electron density profile measured with HCN interferometer and microwave reflectometry system, x-axis is normalized poloidal flux coordinate; (b) ion temperature profile measured with CXRS (CXRS), x-axis is normalized poloidal flux coordinate.
Download figure:
Standard image High-resolution imageA 6 kHz oscillation with strong harmonics is observed from both core SX emission signal and boundary Mirnov signal. LLM is driven unstable as q0 (q0, the safety factor at the magnetic axis) gradually evolves towards unity and βp increases significantly as shown in figure 4(d). The mode started at 3.1 s. It saturated at 3.28 s. As the mode linearly grows, the boundary magnetic perturbations are suppressed as shown in figure 4(b). The mode was terminated at 3.55 s when a minor crash occurred and q0 was elevated well above unity. The mode frequency is close to the central bulk plasma rotation frequency as shown in figure 4(a).

Figure 4. (a) The mode frequency measured from core SX emission signal and boundary Mirnov signal; the frequency of bulk plasma rotation; (b) boundary magnetic perturbations from Mirnov coil measurements; (c) SX perturbations in the central chord of horizontal array D with respect to time; (d) the value of q0 and βp with respect to time.
Download figure:
Standard image High-resolution imageThe presence of LLM would cause deleterious effects. As shown in figure 5(d), following the onset of the LLM, βp gradually decreases, indicating a gradual loss of plasma confinement. In figures 5(b) and (c), a decrease in the neutron rate is observed despite NBI heating power being kept constant and core ion temperature being on the rise. It is an indication of fast ion losses. Figure 5(e) shows that the LLM could cause minor disruption. The minor disruption event happened at about 3.5132 s–3.5133 s.

Figure 5. (a) SX emission in the core; (b) neutron rate; (c) core ion temperature; (d) βp; (e) SX emission signals from core to edge, showing a minor disruption happened at 3.5132 s–3.5133 s.
Download figure:
Standard image High-resolution imageThe toroidal rotation profile is measured by a CXRS system. As shown in figure 2(b), the external momentum introduced by NBI is added from 3.1 s and kept constant during the plasma discharge. The evolution of the toroidal rotation profile is thus caused only by internal sources. In figure 6, the toroidal rotation profiles at various time points from EAST discharge 63730 is presented. With the long-lived helical mode present, which is from 3.1 s to 3.55 s, the rotation profile inside the q = 2 surface is flattened. The toroidal rotation profile without the presence of the LLM at 3.62 s is a monotonic one with the maximum toroidal rotation speed in the core region. Such a toroidal rotation profile evolution indicated that the LLM would cause severe toroidal rotation damping in the core. Previous research applied neoclassical toroidal viscosity (NTV) theory to calculate the breaking torque exerted by internal modes [26, 27]. In the EAST case, the flattened part of the rotation profile extends up to almost half of the minor radius, which provides excellent conditions to test NTV theory. This will be worked on in the future.
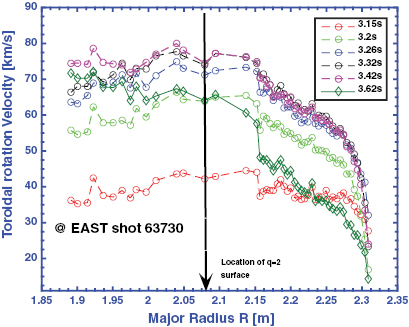
Figure 6. Toroidal rotation profiles at various time points from EAST discharge 63730. The dash line corresponds to the time point with LLM. The flattened part of the rotation profile extends up to almost half of the minor radius; the solid line corresponds to the time point without LLM.
Download figure:
Standard image High-resolution imageIn the laboratory frame, the MHD mode frequency is determined by plasma rotation frequency and diamagnetic frequency as  . In the EAST LLM case, the electron diamagnetic frequency
  is estimated as
  . The electron diamagnetic frequency is small compared with the MHD mode frequency in the saturated phase, which is about 6 khz. So the MHD mode frequency is determined by plasma rotation frequency f rotation. f rotation is defined as
  . Considering the toroidal rotation speed Vtoroidal is about 70 km s−1 (typical value of Vtoroidal in EAST NBI plasmas is up to 100 km s−1) in the saturated phase, the major radius R0 is 1.85 m, and radial position r inside the q = 2 surface varies from 0 to 0.2 m, the mode frequency is dominantly determined by toroidal rotation velocity. A flattened toroidal rotation profile brings further implications. MHD instabilities that take place inside the q = 2 surface, namely 1/1 and 2/1 modes, would rotate at the same angular frequency. The phase of 1/1 and 2/1 modes would be locked, i.e. toroidal mode coupling. It is safe to conclude that a flattened profile could provide conditions for toroidal mode coupling. This observation is consistent with previous works on EAST showing that 2/1 neoclassic tearing mode (NTM) is triggered by 1/1 mode via mode coupling [28, 29].
3.2. Mode number analysis
Figure 7 shows the toroidal mode numbers as found from the Fourier transform of the boundary magnetic probe measurements for EAST shot 63730. It is clear there are n = 1 and n = 2 harmonics present during the LLM evolution.
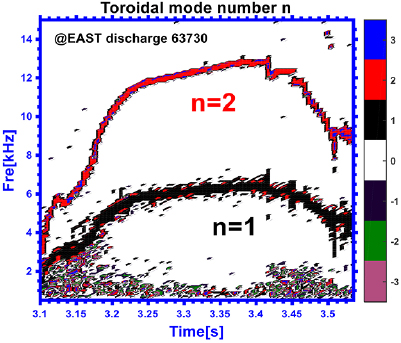
Figure 7. The toroidal mode numbers calculated from the Fourier transform of the boundary magnetic probe measurement for EAST shot 63730. It is clear there are n = 1 and n = 2 harmonics present during the LLM evolution.
Download figure:
Standard image High-resolution imageA combined application of singular value decomposition (SVD) method and tomography of multi-array SXR emissions is conducted to identify the poloidal mode structure and poloidal rotation direction of LLM [30]. In figure 8, reconstructed local SXR emission intensity perturbations show a typical m = 1 mode structure. The m = 1 mode structure rotates along the ion-diamagnetic direction (clockwise poloidal direction). In figures 9(a) and (b), the relative amplitude of 1/1 and 2/2 perturbations are plotted in arbitrary units respectively. In figure 9(c), the amplitude of 1/1 + 2/2 perturbation is acquired by linearly adding up the amplitudes in figures 9(a) and (b). Comparing the relative amplitude of local SXR perturbation emissions, the 1/1 mode is clearly the main component.

Figure 8. (a) SXR signal in central chord. Five time points termed t1–t5 are chosen in one LLM oscillation period; (b) the reconstructed local emission intensity perturbations corresponding to t1–t5 respectively. The mode structure rotates along the ion-diamagnetic direction (clockwise poloidal direction).
Download figure:
Standard image High-resolution image
Figure 9. (a) Tomography of SXR emissions caused by 1/1 perturbations at 3.300 05 s. The time point corresponds to t3 in figure 8(a). The units of plot color bar are arbitrary units.; (b) tomography of SX emissions caused by 2/2 perturbations; (c) tomography of SX emissions caused by combined 1/1 and 2/2 perturbations; (d) tomography of total SX emissions.
Download figure:
Standard image High-resolution image3.3. Mode radial displacement ξ
A novel method was developed on ASDEX Upgrade to derive robust estimates of the core displacement of 1/1 internal mode [31] from SXR tomography. Here, the same method is used to acquire the core displacement of LLM in EAST shot 63730. The displacement of the m = 1/n = 1 mode, ξ1/1, is evaluated as the average radius of the area (figure 10(a)) enclosed by the trajectories of SXR maximum in one oscillation period (figure 10(b)). This method can overcome two major shortfalls of the naive method, which uses the distance between the magnetic axis and the SXR maximum: (1) the uncertainty in the magnetic axis attained from an equilibrium reconstruction, and (2) the errors resulting from severe noncircular plasma shape. The trajectories of the SXR maximum (referred to as a 'hot core') during one LLM period show that the 'hot cores' circulate in the ion diamagnetic direction in the R–Z plane and that the displacement ξ1/1 is about 2.6 cm in the saturated phase. Figure 10(c) shows the radial displacement ξ with respect to time. The mode growth rate γ is estimated as 1/ξ * dξ/dt in figure 10(d).

Figure 10. (a) Trajectories of the SXR maximum during one mode oscillation cycle from t1 to t7 in EAST shot 63730; (b) time points in one mode oscillation cycle from t1 to t7; (c) the radial displacement ξ with respect to time; (d) the mode growth rate γ estimated as 1/ξ * dξ/dt.
Download figure:
Standard image High-resolution imageThis novel method of extracting plasma core displacement is based on the assumption that the trajectory of the SXR maximum is a reliable proxy of the trajectory of the displaced core. This assumption is valid upon a few conditions [31]. The mode frequency f should change slowly. The mode growth rate γ should change slowly. The growth rate γ should be small compared to mode frequency f. That is to say, the method is most accurate when the mode is in saturated phase. If the mode is fast growing or decaying, though inaccurate, as long as the trajectories of SXR maximum could still enclose an area like the one shown in figure 10(a), a value for mode displacement could be estimated. As figure 10(d) shows, the absolute value of growth rate γ is rather large compared to mode frequency from 3.25 to 3.26 s, the corresponding displacement is thus inaccurate. The same would apply to radial displacement ξ in figure 10(c) at 3.36–3.37 s. Note that this method is based on SXR tomography. The limited resolution of SXR tomography would cause errors at 3.1–3.25 s and 3.37–3.55, when 1/1 displacement is small the trajectories of SXR maximum could not enclose an area like the one shown in figure 10(a). These values for mode displacement ξ are set to be zero, though in reality, they are not (see figure 4(c), the central chord SXR perturbation).
Given all these, the reliable estimation of the amplitude of the radial displacement ξ should be found at 3.26–3.36 s. The minimum reliable amplitude of the radial displacement ξ should be found at about 3.26 s. It is safer to choose a time point well after 3.62 s, say 3.27 s. The corresponding displacement is 1.5 cm as shown in figure 10(c).
A new combined method for investigation of MHD activity is developed by Igochine et al [32]. This new method develops a MHD interpretation code (MHD-IC) [33] and makes it possible to compare the mode structure predicted by theoretical models directly with experimental data to accurately determine the mode eigenfunction. The same approach is applied here to interpret experimental SXR data at the saturated phase of the LLM. The MHD-IC code would require an initial guess for the form of radial displacement ξ. This initial guess took a form of parameterized theoretical models. Then the MHD-IC will fit the theoretical mode structure to experimental data. In this reconstruction, the initial guess is provided by a parameterized internal kink mode model. Theoretically, a safety factor profile as shown in figure 2(e) would be more likely to produce a quasi-interchange mode other than an internal kink mode. However, due to limited special resolution, the experimental SXR data used in the reconstruction would not be able to provide fine details to distinguish the quasi-interchange mode structure from internal kink mode structure. Seen also in previous work, an ideal internal kink model was applied to calculate the mode eigenstructure in MAST LLM plasmas [8].
The reconstructed results are presented in figure 11. The radial displacement of 1/1, 2/2 and 3/3 components in figure 11(c) are obtained by applying the best fitted eigenfuntions in figures 11(a) and (b). The maximum ξ1/1 is about 2.6 cm, which is consistent with the results in figures 10(a) and (c).

Figure 11. (a) m = 1 eigenfunction fitted to experimental data, the x axis is the chord index number of SXR U array; (b) m = 2 eigenfunction fitted to experimental data, the x axis is the chord index number of SXR U array; (c) the radial displacement ξ of 1/1, 2/2 and 3/3 components obtained by applying the best fitted eigenfuntions, the x-axis is matched in minor radius in cm.
Download figure:
Standard image High-resolution image4. 3D nonlinear simulations
4.1. Long-lived saturated helical mode reproduced in realistic tokamak configuration
3D resistive nonlinear simulations using the M3D code [34] have been applied to reproduce the LLM. Resistive MHD equations including viscosity are detailed in section 3 of [35]. Plasma rotation is not taken into account in the model. In this simulation, the experimental plasma density profile (figure 3(a)), temperature profile (figure 3(b)) and safety factor q profile (figure 2(e)) of EAST shot 63730 are employed to provide a realistic tokamak configuration. Note that there is no Thompson scattering diagnostic support in EAST shot 63730 for electron temperature profile measurements. The electron temperature profile is assumed to be identical to the ion temperature profile shown in figure 3(b). Figure 12 shows the mesh in one arbitrary poloidal cross section. The simulation is performed in fixed boundary conditions constrained by the last closed flux surface of EAST shot 63730 at 3.3 s.

Figure 12. Mesh for M3D simulations. (a) Mesh for the whole poloidal cross section; (b) mesh at the boundary; (c) mesh at the centre.
Download figure:
Standard image High-resolution imageM3D is an initial value code. A perturbation is added into the background equilibrium plasma. If the equilibrium is unstable, the perturbation will evolve in space and time until a spatial structure is produced corresponding to the unstable mode eigenfunction. To initiate the simulation, the toroidal mode numbers are set to be 1–8 and the poloidal mode numbers are set to be 1–4. LLM is reproduced when the value of viscosity µ is set to be 10−5 and the resistivity η is set to be 10−7. Simulation results are summarized in figure 13. Figure 13(a) shows the total kinetic energy versus time. Time is denoted as  , where
  is the Alfvén time, s1 is the magnetic shear at the q = 1 surface. Figure 13(b) shows the average amplitude of magnetic perturbations (denoted as δφ) as a function of toroidal mode number at initial phase (τA = 0.246), linear phase (τA = 245.69) and saturation phase (τA = 368.09).

Figure 13. (a) Total kinetic energy versus time; (b) the average amplitude of magnetic perturbations (denoted as δφ in arbitrary units) as a function of toroidal mode number at initial phase (τA = 0.246), linear phase (τA = 245.69) and saturation phase (τA = 368.09).
Download figure:
Standard image High-resolution imageThe simulated stream function U [35] and pressure perturbations confirmed a 1/1 helical mode structure (figures 14(a) and (b)). However, the magnetic perturbation of the mode has very strong m = 2 components that are comparable to the n = 1 component (figure 14(c)). This result is consistent with the experimental observation that a dominating m = 2 component is shown in SVD analysis of boundary Mirnov coil signals. Note that 1/1 kink mode always has 2/2 components in a torus configuration (e.g. toroidal effects), which agrees with previous nonlinear simulations [34].

Figure 14. (a) Stream function U perturbation with 1/1 helical structure in 3D configuration; (b) pressure perturbations with dominating 1/1 structure; (c) magnetic perturbation of LLM with a strong m = 2 component.
Download figure:
Standard image High-resolution image4.2. Dynamics of long-lived saturated helical mode
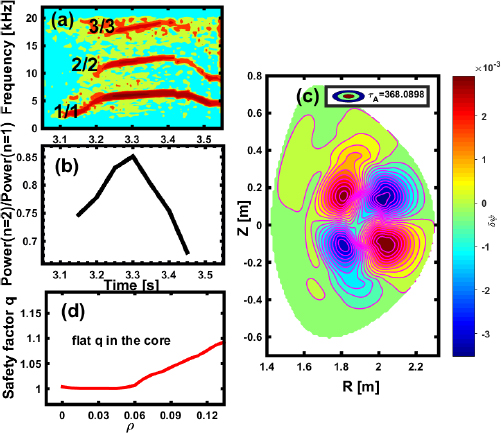
In figure 15(a), the spectrogram of central chord SXR signal shows that 1/1, 2/2 and 3/3 mode are driven unstable successively in EAST shot 63730. It is possible to estimate the relative amplitude of the different toroidal mode number modes during the long-lived helical mode evolution from the SXR fluctuation data. By taking a fast Fourier transformation of SXR data from a small time window, the amplitude of the fluctuation can be calculated as a function of frequency. The frequency spectrum peaked at n = 1 and n = 2 frequency, respectively. So the relative amplitude of n = 2 and n = 1 modes can be estimated at this small time window. By moving the small time window along the time axis, the amplitude ratio of the n = 2 mode to the n = 1 mode against time is acquired (figure 15(b)). It is clear that as qmin (figure 4(d)) gradually approaches unity, the n = 2 amplitude increases substantially with respect to n = 1 amplitude. Conversely, as qmin is driven further above unity, n = 2 amplitude decreases with respect to n = 1 amplitude.
Figure 15. (a) Spectrogram of the central chord SXR signal of EAST shot 63730. 1/1, 2/2 and 3/3 mode are driven unstable successively; (b) the amplitude ratio of the n = 2 component to the n = 1 component for the LLM; (c) simulated 2/2 magnetic perturbation at saturation phase; (c) a completely flat safety factor profile in the core at saturation phase.
Download figure:
Standard image High-resolution image
The simulated magnetic perturbations agree very well with similar evolution. In figure 13(b), as LLM grows, the n = 2 amplitude increases immensely with respect to the n = 1 amplitude. When LLM saturates at τA = 368.09, the n = 2 amplitude becomes the dominant component. The corresponding 2/2 harmonic component of the magnetic perturbation at saturated phase is presented in figure 15(c). The simulation also shows that when the 2/2 component become dominant in the saturated phase, the initial weak shear safety factor profile in the core becomes completely flat (figure 15(d)) This change of safety factor profile in the core corroborates a self-regulating magnetic flux pumping mechanism that was considered responsible for maintaining stationary hybrid discharges.
5. Discussion and conclusion
LLMs could contribute to future ITER operations from various perspectives. From one of the positive perspectives, the LLMs are associated with 3D helical core formation, which can redistributed the current profile and help to maintain stationary hybrid discharges through the magnetic flux pumping mechanism. One of the primary benefits of this self-sustaining scenario is that it can prevent the introduction of low q rational surfaces, so that detrimental low mode number instabilities such as sawteeth are avoided. From one of the negative perspectives, however, the LLMs are found to cause toroidal rotation damping in the core. Plasma rotation in tokamaks is of special interest for its potential stabilizing effects on micro- and macro- instabilities. On a micro scale, rotation-induced E × B shear flow contributes to suppressing turbulence and forming an internal transport barrier (ITB) [36]. On the macro scale, toroidal rotation introduces a stabilizing term on ideal internal kink mode [37, 38]. Also, in ITER advanced scenarios, high performance plasmas suffer from the resistive wall mode (RWM). RWM arises from the interaction between a pressure driven external kink mode and the tokamak wall, posing a serious β limit [39]. Maintaining high toroidal rotation is important to alleviate this constraint [40].
A long-lived saturated helical mode is observed for the first time in EAST hybrid discharges achieved with NBI. The mode structure is reconstructed by a combined use of tomography of multi-array SXR cameras and a singular value decomposition method. It has a typical 1/1 mode structure with a substantial 2/2 component. The mode rotates along the ion-diamagnetic direction and has a maximum radial displacement of 2.6 cm in the saturated phase.
3D resistive nonlinear simulations using the M3D code have been applied to reproduce the evolution of the LLM in realistic tokamak configuration. The simulation results match very well with experiment observations in producing a 1/1 dominant pressure perturbation. The simulated magnetic perturbation has a very strong n = 2 component. As the mode grows and saturates, the n = 2 component increases immensely and gradually becomes the dominant mode number. In the saturated phase, the initial weak shear safety factor profile in the core becomes completely flat. This change of safety factor profile in the core corroborates a self-regulating magnetic flux pumping mechanism that was considered responsible for maintaining stationary hybrid discharges. EAST hybrid discharges suffer severe toroidal rotation damping in the plasma core when long-lived helical mode is destabilized. During the LLM evolution, the toroidal rotation profile inside the q = 2 surface is kept flattened. The flattened part of the toroidal rotation profile extends up to half of the minor radius. The mechanism responsible for exerting the breaking torque will be investigated in future work.
Acknowledgments
Dr. Liqing Xu would like to thank Dr. L. Sugiyama (MIT-US) for useful discussions about M3D nonlinear simulations and Dr. V. Igochine (APP-Germany) for providing the MHD-IC code for SXR perturbations simulation with MHD.
This work was supported by the National Nature Science Foundation of China under Grant No. 11605243.