


Abstract
Scaling of intrinsic rotation in DIII-D H-mode plasmas demonstrates a strong correlation with the ion temperature (Ti) and stored plasma thermal energy, indicating a coupling between the turbulent intrinsic momentum flux and the turbulent energy flux. We consider intrinsic rotation to be the toroidal rotation in axisymmetric conditions with no external momentum injection. The DIII-D dimensionless empirical scaling of intrinsic rotation with plasma stored energy has been recently tested by novel experiments on DIII-D that utilize relatively small variations in the plasma shape, namely the triangularity, to modify the intrinsic rotation. Shape variation affects the intrinsic rotation by modifying the turbulent transport, rather than via changes in the auxiliary heating power, or applied torque. These H-modes are heated by ECH with no external torque input. Balanced torque blips from neutral beams measure the ion flow velocity and Ti. Higher thermal energy and intrinsic angular momentum are correlated with higher triangularity. Turbulent density fluctuations in the pedestal region show a significantly higher level at lower triangularity, with lower energy confinement, possibly the source of greater transport. In DIII-D, the E × B shear, which is mainly driven by the edge pressure gradient term in intrinsic rotation conditions, could provide the dominant symmetry breaking necessary for generating a net turbulent momentum stress and qualitatively agree with the scaling.
Export citation and abstract BibTeX RIS
1. Introduction
Intrinsic rotation in the axisymmetric tokamak is where the plasma develops a toroidal mass flow velocity in the absence of any externally injected torque [1]. This is commonly observed wherever velocity measurements are made, although this toroidal intrinsic velocity is not large, relative to the ion thermal velocity. However, the intrinsic rotation velocity, or the radial shear in this velocity, could potentially be large enough to have a positive effect on confinement and stability in future burning plasma devices [2], which will differ in several areas from present experiments. One aspect is that present high-performance experiments have largely benefitted from a high toroidal velocity generated by directed neutral beam injection (NBI) that will not be as significant in future burning plasmas. Globally torque-balanced NBI, as well as high power RF heating in present devices, can also generate torque from fast ion loss [3, 4], or transport, that could lead to a difference in projecting present results to burning plasmas. Also, when field axisymmetry is lacking, as with the application of so-called 3D fields for various purposes or simply from error fields, deleterious momentum drag effects can be introduced such that the intrinsic rotation is reduced.
A great variety of intrinsic rotation profiles have been observed in experiments. The vector nature of momentum means it can readily be positive and negative, usually the sign convention is relative to the direction of Ip, the plasma current, and indeed profiles with co/counter rotation reversal are seen in the absence of external torque. There is no violation of physical law here. As is well known theoretically, turbulence can generate a localized momentum stress which drives a dipolar radial flux of toroidal momentum. When this is coupled with turbulent momentum transport and a sink at the edge of the plasma, a net toroidal momentum can remain in steady state. One commonality in the toroidal rotation profiles observed is that there is a positive, co-Ip, toroidal flow in H-mode discharges, or in auxiliary heated L-mode conditions [1]. This is in the 'confinement region',  , a large volume region of a typical elongated poloidal divertor shaped plasma, where
  is a normalized toroidal flux minor radius. This commonality in rotation profiles promoted empirical searches for scaling laws across multiple machines [5, 6]. Indeed, understanding the size scaling to future large devices is required to anticipate what effect intrinsic rotation might have there.
Experimentally, the intrinsic rotation in this confinement region is found to be coupled to the plasma thermal energy, and is enhanced with lower Ip [5–7]. Usually the intrinsic rotation is varied in an experiment using the readily available knobs for the experimentalist: the heating power, plasma density, Ip and occasionally BT, the toroidal magnetic field strength at the magnetic axis. In contrast, in this paper we report on a DIII-D experiment in which we modified intrinsic rotation by changing the plasma confinement, i.e. the transport of energy and particles, utilizing relatively small changes in the shape of the plasma by varying the triangularity parameter. This works as it is well known experimentally that the edge H-mode pedestal pressure varies with triangularity [8].
Another direct shaping effect on intrinsic rotation has been considered theoretically and confirmed experimentally [9], where the variation is in the up/down symmetry of the shape. This is relatively speaking a zeroth order effect compared to what we discuss here, in that the up/down asymmetry breaks the toroidal symmetry and generates a net local turbulent momentum flux, whereas in this DIII-D experiment the dominant symmetry breaking mechanism is likely the shear in the E × B drift velocity which is always in place to some extent, but varies with the level of confinement. Experiments in DIII-D have shown the E × B shear is a possible drive for intrinsic rotation in the edge region [10, 11].
2. Experiment
DIII-D H-mode discharges are heated with electron cyclotron heating (ECH) in a lower single null shape as shown in figure 1, with the grad B drift directed towards the X-point. As shown, the upper triangularity,  , is modulated slightly between these two limits. This is done in a square-wave fashion with period 1.2 s throughout the 5 s Ip flat-top discharge. The location of the ECH deposition is indicated. The basic discharge parameters are
 The plasma pressure, p , expressed in engineering units by
  , spans the range
  . With Ip in MA, BT in T, minor radius, a, in m, and the spatially averaged
  in %, where
  .
.
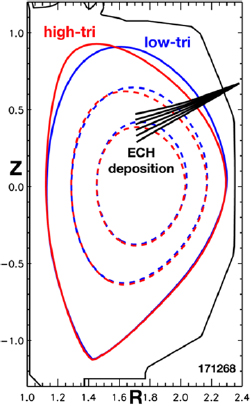
Figure 1. DIII-D LSN shapes with two typical upper triangularity levels used in this experiment. The ECH deposition locations are also indicated.
Download figure:
Standard image High-resolution imageError fields are compensated using the standard DIII-D error correction algorithm and the I (internal) coils. This technique is very effective [12] in these midrange  ECH-dominated H-mode discharges utilized here. To measure the ion temperature, Ti, and toroidal velocity,
  , ~15 ms 'blips' of balanced NBI are injected every 300 ms for the standard CER processing for the carbon impurity [13] velocity and temperature, together with the recently added main ion D + processing technique [14]. ECH is the dominant auxiliary heating, with the time-average NBI power only ~300 kW. The CER measurements are done at a fixed timing relative to the
  modulation cycle. The torque balanced blips every 300 ms provide an unperturbed state at the start of the next blip [6]. The net torque injected per blip is <0.01 N m and the source dies away within ~50 ms, from TRANSP computations [15]. However, the power and instantaneous torque from the blips cause a significant perturbation to the plasma state, such that only the first 2 ms of the blip is utilized for the CER measurements. The modulation in
  leads to measurable modulations in the toroidal rotation, ion temperature and plasma density as shown in figure 2 for a typical discharge in this experiment. In figure 2(a) the response of the toroidal rotation frequency,
  , is shown for three different radial locations, measured during the first 2 ms of the beam blips for carbon. The
  values are also shown. The rotation response has a slower time response than the Ti waveform and the core (
 = 0.33) has an inverted response initially, compared to the confinement region (
 = 0.77). A highly regular response is seen in Ti as shown in figure 2(b), with a ~20% increase in the higher
  state. With the well-established correlation of intrinsic rotation with Ti [6, 16, 17], we would expect an increase in co-Ip
  to accompany this. Figure 2(c) shows the line averaged density,
  , and the edge pedestal density,
  , in units of 1019/m3, both showing a significant change with a similar temporal response. Also, core electron temperature,
  , and pedestal electron temperature,
  are shown in units of keV. The continuous EFIT-determined shaping parameter
  is also shown in figure 2(c) together with the specific measurement times (green circles) plotted in figures 2(a) and (b).

Figure 2. Time history of a typical discharge with temporally modulated δu ('TriTop'). (a) Toroidal rotation response at 3 minor radii, measured at the start of each beam blip, (b) Ti at these locations and times, (c) continuous measurements of line averaged and pedestal density, and central and pedestal Te, (d) continuous measurements of PECH, PNBI, and Dα recycling light and blip-time values of efit q95.
Download figure:
Standard image High-resolution imageWe did not leave more time between the end of a transition and the measurement time as we had hoped to vary this delay and expose the velocity change dynamics, but the time needed for the shaping swing was longer than anticipated, and comparable to the time scale of the velocity change. The slow inverted sawtooth-like behavior in  is due to the short, but high power, diagnostic NBI blips. In figure 2(d) we show the ECH power time trace and the NBI blip power. The ECH steps down late in the shot causing a change in the discharge. Two other possibly important parameters are changed with this rather subtle change in the upper triangularity. First, q95 is modulated as shown in figure 2(d) due to the boundary surface modulation. Even though a relatively small change, it results in a modulation of the MSE-determined magnetic shear of ~20% at ρ ~ 0.88, and ~30% in the core at ρ ~ 0.3. Some theoretical treatments of intrinsic rotation involve the shear [18]. Lastly, as is well known the triangularity affects the pedestal stability limit [8] and thus the nature of the ELMs, as shown also in figure 2(d).
While higher  raises the stability limit and tends to result in less rapid, larger ELMs, it does not appear that the resulting change in time-averaged edge confinement can explain the change in stored energy, or density, based on continuous measurements. The ELM-induced perturbations are quite small compared with the overall step changes. For example,
  roughly varies between 0.85 and 1.20 at low and high triangularity, respectively, in this shot, whereas the ELM perturbations to
  are at a very small level of a few %. We are continuing to evaluate how much change a time-averaged ELM transport effect could cause. Assuming that ELMs are not a dominant effect in the response of interior density and energy changes with
  , we assume also ELMs are not a dominant effect for the momentum response in this shape change.
Isotopic effects, or the effects of impurities, on intrinsic rotation have not been seriously addressed, to our knowledge. Previous experiments in DIII-D found that the Rice scaling appeared to hold for main ion helium as well as main ion deuterium [1]. Invariably, all measurements that have led to the various scalings have been taken in deuterium discharges, measuring a minority constituent velocity, such as carbon in DIII-D. Main ion velocity measurements are now being made in DIII-D to compare with the carbon measurements [19]. Roughly speaking, inside the pedestal, ρ < 0.8, the difference in the two toroidal velocities is not large [19]. Nevertheless, we point out that the  modulation does modify Zeff, due to C6 + , in the discharges under discussion here. A typical change in the carbon to deuterium density ratio,
  , is from 8% to 12% in the low and high
  condition, respectively, at ρ = 0.7, that is, Zeff = 2.5, and 3.1, respectively.
We point out that the significant changes in density and energy confinement with the  modulation do not take place when the discharge does not go into H-mode, indicating that the enhanced confinement, or the existence of an edge transport barrier are necessary for these effects of the plasma shape. We consider this level of change in
  to be relatively small even though the change in the value computed by the standard definition, as plotted, is not relatively small. We wish to quantify this. In the description of the effect of up/down asymmetry on intrinsic rotation, Camenen et al identify a normal component of the curvature plus gradB drifts along a field line as a critical parameter (equation (9) in [9]). This shape parameter is computed for the two shapes shown in figure 1, and we find only a maximum 10% change which occurs between the top and inner midplane portion of the flux surfaces at ρ = 0.7. In contrast, deviations of order unity appear to be found between the variation of this parameter in the different shapes in TCV being discussed in [9]. We take this as a confirmation that our shape change is relatively small.
3. Agreement with DIII-D empirical scaling
A dimensionless empirical scaling for intrinsic rotation in DIII-D has been recently published [6], showing a good prediction of the intrinsic  in the confinement region to be
  , where
  is an Alfvénic 'Mach' value,
  is the usual global normalized stability parameter (%-m-T/MA), and
  , and the fitting parameter is C = 1.25 for the empirical database utilized in [6]. A global Alfvén velocity is used, computed using the axial magnetic field strength,
  , and the line-averaged electron density. The thermal ion Larmor radius,
  , is computed using the local Ti, with B0, and a is the minor radius. The data utilized in this empirical scaling came from a limited region in minor radius of diverted discharges, approximately
  , for historical reasons as being where DIII-D found a so-called Rice scaling for intrinsic rotation [1]. However, this MA scaling appears to be reasonably represented for a wide range of minor radii, except in the core or approaching the edge, as previously described [6]. We also discuss the relation of this scaling to the Rice and Parra [20] scalings and describe the additional parameters that this scaling adds to these other scalings.
We find that the intrinsic rotation modulation driven by the shape modulation in this experiment is also well represented by the above MA scaling. We focus on specific temporal and spatial locations in the discharges utilized, taking  , and taking the middle 3 cycles for
  as shown in figure 2. This avoids some transients in the beginning of the shots, and later in the shots there are sometimes programmed changes searching for other effects.
The  scaling for these selection conditions is shown in figure 3 for 11 discharges from this DIII-D shape modulation experiment, where we plot the measured
  versus the value of
  . The key to the symbols and colors is given in the insert showing
  during the time window considered; circles indicate the first measurement after a shape step and cusps the second measurement, black is lower
  and red higher
  . The variation in the discharges includes Ip,
  limits,
  , and
, and  . A good correlation is observed in figure 3, with a simple straight line fit through origin giving
  . The range of normalized gyroradius in the data set in figure 3 is
  . The overlap of the different triangularities in the data shown in figure 3 indicates that the triangularity as such cannot be contributing much to determining the velocity, rather it is the change in particle and energy confinement induced by this shape change that is causing the change in velocity.
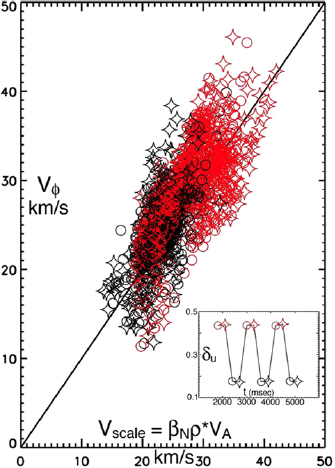
Figure 3. Plot of the measured velocity, Vϕ versus the prediction from an empirical dimensionless scaling [6], Vscale, in the spatial region 0.6 ⩽ 𝜌 ⩽ 0.85, over the time range shown in the insert, where the key to the symbols and colors is indicated. Data from 11 discharges are shown. Pearson correlation r = 0.75.
Download figure:
Standard image High-resolution image4. Momentum and energy correlation
The momentum-energy connection can be explored more closely by examining the variation of the plasma profiles as the triangularity is modulated. Profiles measured at a low and high  time are shown in figure 4. There is little change in Te in figure 4(a), while Ti increases with
  . This seemingly small temperature response must be viewed in light of the dramatic increase in density, seen in figure 4(b), with constant heating power. The increase in the intrinsic toroidal rotation is primarily in the outer region, approaching the pedestal, as plotted in figure 4(c). With the density increase, the momentum increase is significant. The peaks in Te seen in figure 4(a) are located in the region of ECH power deposition and may be due to a rational q surface effect seen in DIII-D [21]. Theoretical treatments of intrinsic rotation have discussed a relation between energy transport and intrinsic momentum transport in tokamaks [22–24]. Some posit a thermodynamic picture of momentum generated due to energy flow [23, 24]. With NBI injection of power and torque there is a fixed local relation between these two sources, so it may not be surprising that with NBI-driven torque there is a correlation observed between momentum and energy, or
  and
and  [25]. This correlation is sometimes explained by similar turbulent diffusivities for energy and momentum [26]. However, for neoclassical transport there is a large theoretical difference between the two diffusivities [27], and in some high confinement regimes neoclassical ion transport is approached.
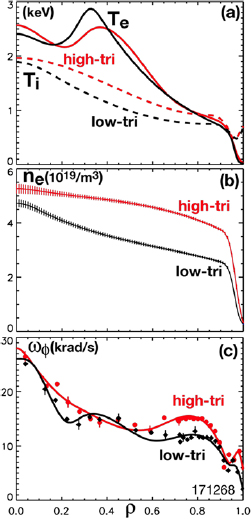
Figure 4. Profiles from a high and low δu state. (a) Te and Ti, (b) density, (c) toroidal rotation.
Download figure:
Standard image High-resolution imageWithout torque input in the axisymmetric heated tokamak we typically can accurately compute the local power deposition profile, but the 'source' for any observed intrinsic momentum is not accurately known, or at least not externally applied. If we assume energy and momentum sources are related here also, then the fluxes of energy and momentum should also be related, just as in the NBI-torque driven source condition. We would then expect to see a correlation between the locally contained momentum and energy, as the gradient of each would be correlated due to the local coupling between velocity and temperature.
This momentum-energy correlation is well borne out in this experiment with constant input power and utilizing the shape to control the confinement level. We compute the local toroidal momentum and energy density from the profiles for the discharge times used in figure 4, given by  , and
, and  , respectively, in the single main ion approximation. Here, M is the D + ion mass, R the major radius, and
  represents a flux surface average. Utilizing the EFIT equilibria for these two times we compute the local ratio of these two terms,
  , and plot this ratio versus minor radius in figure 5(b), for both the high and low triangularity profiles from figure 4. The ratio remains essentially unchanged locally for the both triangularity conditions, where the total integrated momentum and energy are about 50% larger at high
  . Figure 5(a) shows the ratio of
  , to indicate the fraction of thermal energy in electrons versus ions.

Figure 5. (a) Ratio of Te/Ti at low and high triangularity, and (b) Ratio of the toroidal mechanical momentum density and the thermal energy density at low and high triangularity, both versus 𝜌.
Download figure:
Standard image High-resolution imageThe main term in the change is the density increase, and the density is common in momentum and energy. Further experiments are needed to see if this is primarily a density effect, or if utilizing a transport 'knob' to directly control confinement has revealed a correlation not seen clearly in experiments where heating power or density are used as control variables. Note again, we have not changed any controlled external particle source in this modulation, rather the innate transport coefficients through the shape change. There is little change in the baseline amplitude in recycling light seen in figure 2, in contrast to a large change with density increases using gas puffing.
In a comprehensive gyrokinetic investigation of intrinsic rotation momentum stress due to turbulence and neoclassical effects, Lee et al [22] make the insightful qualitative observation that in the low collisionality regime '...the normalized radial flux of toroidal angular momentum divided by the normalized turbulent heat flux is of the order the poloidal rhostar...' (section 4.1 of [22]) With the authors' gyrokinetic normalization definition this statement says:
where  and Q are the turbulent momentum and energy fluxes and Vti is the ion thermal velocity. Accounting for the definitions of Vti in our papers and taking an equal sign in equation (1), this equation becomes simply
  , where
  is the gyrofrequency computed for the poloidal magnetic field. We observe that this ratio well describes the ratio plotted in figure 5(b). The computed value of this ratio is 2.4–2.6 × 10⁻⁷ s in the range
  in figure 5(b), very close to the plotted values, where we have used a surface averaged
  from the equilibrium. To place this value in perspective the historical tangential beams on DIII-D inject ~1 N m MW−1 through a port, that is a value of
  , at standard operating source voltage. If equation (1) held for a directed NBI dominated discharge one might expect ~4 times greater toroidal velocity for the beam driven condition compared with the intrinsic rotation condition in figure 5(b), all else being equal. This is well in keeping with observations in DIII-D, taking the ratio of toroidal velocity to ion temperature for the comparison [6, 25].
This ratio,  , can be put in terms of q, since the so-called poloidal gyrofrequency here may be entering due to q. It can be expressed as
  , with
  ,
,  , and
, and  .
.
The dimensionless scaling compared with in figure 3. can be shown to lead to the gyrokinetic observation given in (1). We have discussed possibilities for connecting these two statements in [28, 29]. Here, we give a heuristic local mathematical connection. We have pointed out that the scaling in figure 3. can be expressed in other dimensionless forms [6], one of which likely would best emphasize the underlying physical mechanism. Here we start with the scaling as given in figure 3:  . In order to clearly establish the magnitude of the ratio of the fluxes we utilize
  , which is
  expressed in MKS units [6]. This scaling becomes
  . We then simplify assuming
  and relate the poloidal magnetic field to the plasma current with
  , where S is a shaping factor, <1. We then find the relation between local angular momentum and local ion temperature to be:

We have used  rather than R. We assume turbulent diffusive processes carry the outgoing momentum and ion energy flux.
  , and
, and  . Using these terms in the LHS of (1) together with (2) we obtain:
where  is the normalized gyroradius in the poloidal field and
  . The term in parentheses in (3) is of order unity thus reproducing (1). For this dataset we find
  , S ~ 0.7, at
  , and taking 0.7 as a reasonable value for
  , we find the RHS of (3) = 1.3
 . This is encouraging, but this derivation starting from the scaling has made approximations. The term,
  , is involved in the difference between this DIII-D empirical dimensionless scaling and the Rice scaling, as described in [6]. Turbulent transport is the driver in the gyrokinetic result of (1), and in these ECH H-mode discharge conditions we have verified with TRANSP that the experimental
  is an order of magnitude larger than the neoclassical prediction for these discharge conditions.
Regarding the underlying turbulence thought to be responsible for intrinsic rotation phenomena, and the correlation with energy transport, measurements of the turbulence find significant changes in the edge accompanying the small triangularity shape modulation shown in figure 1. Energy and momentum are transported by turbulence. Additionally, turbulence can introduce a net momentum stress that acts a as a source provided there is a broken symmetry to give a preferential direction. One seemingly universal symmetry breaking mechanism arises from the shear in the ambient  drift velocity, i.e.
  ~
~  [30], which can drive the inward transport of co-Ip toroidal momentum required to explain the results considered here.
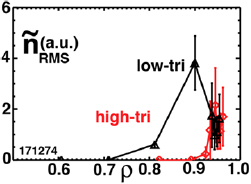
Measurements of the turbulent density fluctuations with Doppler backscattering (DBS) [31] show that the turbulence amplitude is significantly larger for the low  condition, figure 6, where prima facie the energy and particle transport are greater. In that figure, the normalized wavenumber parameter
  varies between 0.5 at radial location
  to
to  , where ρs is the ion-sound gyroradius. The ñ levels near
  show little difference for the two triangularity conditions. In this region
  , i.e. well within the lower
  ITG instability scale region. Based on this one might expect little change in the transport in this region. In contrast, the region
  indicates a large increase in ñ for the low triangularity case. In that radial location
  is slightly less than 1, indicating a dominant ñ contribution from TEM scale instabilities and little contribution from ITG scales. TEM type instabilities are believed responsible for electron thermal transport, particle transport, as well as momentum flux [32, 33]. Based on these points we believe that the large measured increase in ñ is consistent with an increase in the momentum flux. Note however that the actual fluxes are not measured therefor this remains a conclusion based upon the ñ correlation with the changes in energy and particle transport. Finally, lower
  turbulence measurements would be a useful addition to these results, however the low-k BES ñ diagnostic was not available in this experiment due to the lack of long pulse NBI, only utilized as an ion diagnostic in this experiment.
Figure 6. Amplitude of measured turbulent density fluctuations at low and high δ.
Download figure:
Standard image High-resolution image
Additionally, the magnitude of  is also reduced by the reduction in pressure with low
  , from the enhanced turbulent energy transport, thereby reducing the drive for the turbulent stress source [30]. A further consideration in this picture is the suppression of turbulent transport with sufficiently large
  . Generally, the drift velocity shear can provide the symmetry breaking condition that gives rise to a turbulent momentum source, but with increased magnitude can also quench the turbulence amplitude, thus reducing the momentum source.
5. Relation to E × B Shear
Based upon the energy scaling of intrinsic rotation, we postulate that the E × B shear flow is a likely cause of the symmetry breaking needed for intrinsic rotation. This symmetry breaking mechanism has been shown to be of a relevant magnitude, both experimentally [10, 11] and theoretically via GYRO simulations [30], and the empirical scaling law used in figure 3 may follow from this source of intrinsic momentum flux [28, 29]. The observed values of intrinsic velocity are small compared to the ion thermal velocity and in this limit the radial electric field is dominated by the ion pressure gradient, giving a natural coupling of the intrinsic momentum flux to the thermal energy. The GYRO definition of the shear in the E × B flow is given by [30]:
where  and
and  is the magnetic shear term. The appearance of the q-shear term is possibly how the plasma current affects intrinsic rotation and enters the empirical scalings. At lower Ip (higher q),
  is larger, especially in the outer region of diverted discharges, and the symmetry breaking shear term in equation (2) is larger, driving more turbulent momentum flux. The region in minor radius we focus on is just inside the edge H-mode pedestal. In the pedestal region the second term on the RHS of equation (2) certainly dominates due to the large, narrow, well in the electric field. We note that in figure 4. we see Ti increasing in the mid-radius region without an increase in
  there, as further out in minor radius. This could be due to the small shear,
  at
at  , in the interior compared with
  , at
, at  .
.
When the q-shear term is dominant in equation (2), it has been shown using the momentum transport equation that a natural correlation of the intrinsic toroidal velocity, or rotation frequency, with the ion temperature emerges [29]. Scaling studies utilizing the reduced gyrokinetic code TGLF [34] have also been performed and these are qualitatively consistent with the trends of the dimensionless scaling law [6, 29]. We are now evaluating the utility of TGLF to explain the measurements of the intrinsic rotation measurements in the discharges from this shape-modulation experiment, with the primary symmetry breaking mechanism provided by  .
.
6. Summary
Shape variation in DIII-D has been used to probe the coupling of intrinsic rotation and thermal energy by variation in the underlying transport coefficients rather than the external sources of power or torque, or of the engineering parameters. Total toroidal angular momentum and thermal energy display a tight coupling under this transport variation. Increasing the upper triangularity (in LSN) results in higher thermal energy confinement, as expected, being driven by increased H-mode pedestal height. Here we find a quantitatively similar increase in the intrinsic toroidal angular momentum, globally, and locally for the change within a magnetic surface. The intrinsic velocity change is found to fit well with the DIII-D empirical intrinsic rotation scaling [6]. In intrinsic rotation conditions the H-mode pressure gradient in the outer region of minor radius provides an E × B shear that can break the toroidal symmetry and lead to a net turbulent momentum stress of the correct sign to build up co-Ip toroidal momentum going inward from the edge [30]. We postulate this E × B shear to be the dominant physical process which creates the co-Ip peak in intrinsic rotation typically seen in the outer half of minor radius [1] and have previously given arguments that it is responsible for the energy-centric DIII-D empirical scaling, from analytic considerations and modelling with TGLF [28, 29]. We are now applying TGLF to this shape modulation DIII-D data set, and the results will be a future publication.
One scenario that could explain these particular observations is that the causal effect is an increase of electron density and thermal energy confinement with increased triangularity. First, there is no change in the auxiliary heating, and only a small change in the Ohmic heating. Given the initial temperature profiles, it can readily be shown that the increase in density increases the thermal exchange term between electrons and ions, providing more ion heating leading to an increase in  . There is little, if any, reduction in
  , with this greater thermal energy indicating a reduction in electron thermal transport. The increase in rotation velocity is then due to the increased turbulent momentum stress due to increased
  . In this picture, there is perhaps no need for a change in the ion thermal transport. The changes in transport are in electron density and thermal energy. This conjecture has been verified by TRANSP time slice analyses, where we find little change with triangularity in
  inside
  , and get an increase in the electron to ion coupling with the higher triangularity, higher density.
Acknowledgments
This material is based upon work supported by the U.S. Department of Energy, Office of Science, Office of Fusion Energy Sciences, using the DIII-D National Fusion Facility, a DOE Office of Science user facility, under Awards DE-FC02-04ER54698.
Disclaimer
This report was prepared as an account of work sponsored by an agency of the United States Government. Neither the United States Government nor any agency thereof, nor any of their employees, makes any warranty, express or implied, or assumes any legal liability or responsibility for the accuracy, completeness, or usefulness of any information, apparatus, product, or process disclosed, or represents that its use would not infringe privately owned rights. Reference herein to any specific commercial product, process, or service by trade name, trademark, manufacturer, or otherwise does not necessarily constitute or imply its endorsement, recommendation, or favoring by the United States Government or any agency thereof. The views and opinions of authors expressed herein do not necessarily state or reflect those of the United States Government or any agency thereof.