

Abstract
Objective. Effective human motor augmentation should rely on biological signals that can be volitionally modulated without compromising natural motor control. Approach. We provided human subjects with real-time information on the power of two separate spectral bands of the spiking activity of motor neurons innervating the tibialis anterior muscle: the low-frequency band (<7 Hz), which is directly translated into natural force control, and the beta band (13–30 Hz), which is outside the dynamics of the neuromuscular system. Main Results. Subjects could gain control over the powers in these two bands to navigate a cursor towards specific targets in a 2D space (experiment 1) and to up- and down-modulate beta activity while keeping steady force contractions (experiment 2). Significance. Results indicate that beta projections to the spinal motor neuron pool can be voluntarily controlled partially decoupled from natural muscle contractions and, therefore, they could be valid control signals for implementing effective human motor augmentation platforms.
Export citation and abstract BibTeX RIS

Original content from this work may be used under the terms of the Creative Commons Attribution 4.0 license. Any further distribution of this work must maintain attribution to the author(s) and the title of the work, journal citation and DOI.
1. Introduction
One of the biggest challenges in human-machine interfacing is the expansion of human capabilities by providing novel ways to interact with the environment [1]. Real motor augmentation through supernumerary artificial limbs may provide users with new means of interaction with the environment through artificial actuators controlled using spare biological signals [2]. However, in most cases, human motor augmentation is achieved at the expense of limiting already existing motor functions, e.g. by making users learn to control endogenous bio-signals that would otherwise be used for the movement of existing parts of the body [3, 4]. Identifying biological signals that can be reliably decoded and volitionally controlled independently from natural motor function is critical to achieve real human motor augmentation. Neural or muscular signals are commonly used to implement human-machine interfaces [5, 6]. Surface electromyography (EMG) represents a non-invasive, direct and simple source of information tightly linked to the intent to move natural limbs [7–11]. Due to biomechanical constraints, the effective frequency band within which common inputs to motor neurons (MNs) translate into movements is rather narrow and concentrated at frequencies <7 Hz [12]. EMG information contained at higher frequencies, such as the cortical beta band (13–30 Hz), is known to be caused, at least in part, by projections from the motor cortex [13–17]. Yet, the functional role of these higher frequency components in the EMG is unclear [16, 18–20]. If cortical beta signals observed in the muscles could be uncorrelated from motor function, they could be used to effectively expand the degrees-of-freedom of humans to control artificial limbs during muscle contractions by enabling a new control channel independent from the existing natural ones. In principle, this approach could indeed lead to duplicating the degrees-of-freedom of muscles from which independent beta sources are extracted.
Here we hypothesize that spectral components within the beta range in the common inputs to a MN pool can be partially decoupled from the low-frequency components and, therefore, they might provide a resource for controlling additional degrees-of-freedom concurrently with the motor control of natural limbs. To test this hypothesis, we used a recently validated real-time EMG decomposition technique to extract the firing patterns of pools of MNs projecting to a single muscle to directly decode the neural input the muscle receives [21, 22]. These firing patterns allowed us to separate information about the effective drive to the muscle (components at low frequencies causing muscle contraction and movements) from common projections to the MN pool in the beta band (~20 Hz) that are not directly translated into force because of their high frequency relative to the musculoskeletal bandwidth [12]. With this, we tested to what extent our subjects could independently control components in the neural projections to muscles that do not directly determine force and that are therefore not directly associated with the natural control of movements [23]. Figure 1 summarizes the concept of our framework where common contributions to a MN pool in two separate frequency bandwidths are extracted from real-time decomposed MNs to allow subjects to volitionally control them assisted by visual feedback. Specifically, we run two experiments to test our hypothesis. In the first experiment (which is the one represented in figure 1), subjects had to learn to perform a 2D target-tracking task by means of which they were encouraged to independently control the low (translated into force) and high (outside the force production bandwidth) spectral components in the activity of the MN pool. With this, we aimed to assess the suitability of common high-frequency components in the MN pool for controlling additional degrees-of-freedom while natural motor function was unaffected. In a second experiment, we studied if volitional modulation of beta activity in the muscles could occur in the context of steady force contractions. Overall, the results of this study show for the first time a potential way to extract endogenous bodily signals for human motor augmentation that could be controlled without distorting the natural motor repertoire and, by doing this, we provide new insights into the possible links of beta cortical oscillations with motor function.
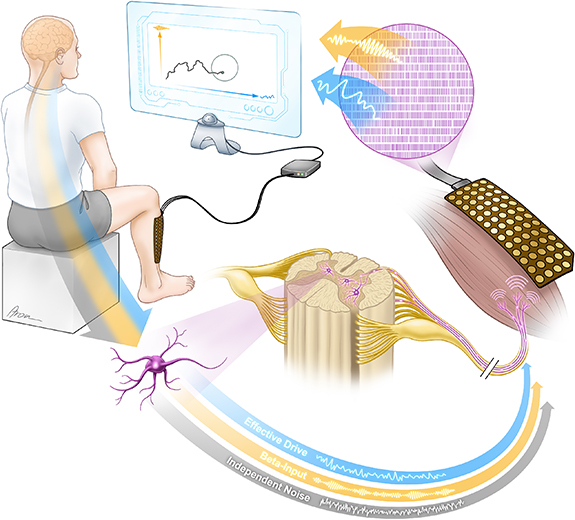
Figure 1. Real-time spectral separation of the neural output of a MN pool to augment the degrees-of-freedom of muscles. In the model used here, the spinal MN pool projecting to the tibialis anterior (TA) muscle of the right leg receives common neural projections in a broad frequency range. These projections are demodulated by the MN pool to produce an output neural signal that includes low-frequency components driving movements (effective drive to the muscle; <7 Hz; blue arrow projecting to the muscle). In addition, MNs send common projections to the muscle in the beta band (∼20 Hz; yellow arrow) and each neuron receives an additional input, referred to as independent noise (grey arrow). Spiking activity of MNs is decomposed in real-time from high-density surface EMG. Decomposed spiking activity is used to retrieve information about the effective drive and beta projections. In experiment 1, this information is fed-back continuously through visual feedback to subjects who are asked to volitionally modulate the activity projected to MNs to navigate a cursor in a 2D space.
Download figure:
Standard image High-resolution image2. Materials and methods
2.1. Subjects
Nine male, healthy subjects (age: 28.44 ± 5.10 years (µ ± SD)) were recruited and participated in the study. None of the subjects were familiar with the experimental paradigm nor experienced any neuromuscular diseases prior to the experimental sessions. The ethics committee at Imperial College London approved the experiments (reference number: 18IC4685).
2.2. Acquisition
High-density surface EMG (HDsEMG) was acquired from TA of the dominant leg with a 64-electrode grid (5 columns and 13 rows; gold-coated; 1 mm diameter; 8 mm interelectrode distance; OT Bioelettronica, Torino, Italy). The adhesive electrode grid was placed over the muscle belly aligned to the fiber direction. The signals were monopolar recorded, amplified via a Quattrocento Amplifier (OT Bioelettronica, Torino, Italy), sampled at 2048 Hz, A/D converted to 16 bits, and digitally band passed filtered (10–500 Hz). The communication between the amplifier and the computer was conducted via data packages of 256 samples (one buffer corresponds to a signal length of 125 ms). The foot of the dominant leg was locked into position to allow dorsiflexion of the ankle only. The force due to ankle dorsiflexion was recorded via a CCT TF-022 force transducer, amplified (OT Bioelettronica, Torino, Italy), and low-pass filtered at 33 Hz.
2.3. Biofeedback
A MATLAB (The MathWorks, Inc. MA, USA) based version of the online decomposition algorithm described in the next subsection together with a custom-made biofeedback suite were used in all experiments. The biofeedback suite provided visual feedback on discharge timings of single MNs, sub-pools or the entire MN pool, the force level exerted by the ankle in the longitudinal plane, the rectified EMG, and included a target-tracking environment.
2.4. Online decomposition of MN activity from HDsEMG
Online decomposition of MN activity was achieved using convolutive blind source separation techniques [24, 25] for identifying MNs. The real-time decomposition methods used in this study is extensively described and validated in Barsakcioglu et al [21]. The real-time decomposition algorithm is calibrated through an initial training phase during which the separation matrix, to extract MN activity from HDsEMG recordings, is computed along with other real-time decomposition parameters. This step involves convolutive sphering (extension of the observations followed by whitening) of the recorded HDsEMG signals followed by a fixed-point iteration algorithm to extract individual separation vectors (for each source) forming the separation matrix, as well as a secondary iterative procedure during which the separation vectors are further refined. During this calibration phase, the final separation matrix is designed, using the whitening transformation matrix, such that the whitening, which involves singular value decomposition, is not required during the real-time decomposition, saving computational resources during real-time operation.
The real-time decomposition phase comprises several processing steps until the final discharge timings of extracted MNs are determined. First is the extension of observations (i.e. recorded HDsEMG signals) followed by extraction of spike trains by multiplying the extended observations with the separation matrix. The extracted spike trains are squared, and the peaks are detected. The detected peaks are compared to noise and signal centroids (computed during the training stage) using Euclidean distance. The timestamps of each peak, classified as a valid discharge, is then output together with the information about which MN it belongs to (i.e. spike label).
2.5. Intramuscular coherence (IMC)
The IMC quantifies common inputs to the MN pool in the different frequency bands [26, 27]. The IMC was estimated by first randomly dividing the pool of MNs into two sub-pools of equal size, followed by calculating the maximum squared coherence between the spiking activity of the cumulative spike train (CST) obtained from the two pools by summing the spiking activity of the MNs in the two pools. This way the IMC was estimated as:
where  and
and  are the power spectral densities of both CSTs (Welch's, Hanning windows of 4 s, 50% overlap), and
  is the cross power spectral density (PSD). This procedure was repeated 100 times while the two MN pools were randomly selected in each permutation. The average of all permutations was used to determine the peak of the common beta activity present in the MN pool.
Although the detected MN pool is only a small sample of all MN innervating the TA, this subgroup is sufficient to estimate the common neural input present to the entire anatomical pool of MNs [21].
2.6. Experimental paradigms
2.6.1. Pre-experimental processing
Subjects were asked to perform maximum isometric dorsiflexion of the right ankle to estimate the maximum voluntary contraction force (MVC) that the TA could produce. The estimated MVC was then set as a reference for the subsequent parts of the experiment. In a sub-MVC task, subjects were instructed to follow a 4 s ramp trajectory (2.5% MVC per second) followed by a constant phase at 10% MVC of 40 s. In both experiments, visually-guided force feedback produced by isometric TA contractions was provided. Based on the EMG recorded during this sub-MVC task, the separation matrix used by the online decomposition algorithm was generated. The real-time estimates of MN firing were visually presented to the subjects to make them recruit MNs one after another by gradually increasing the contraction level to 10% MVC. This pre-experimental task was performed to visually inspect the decomposition results before proceeding with the main experiment as previously done in [21]. Notably, all subjects quickly succeeded (i.e. less than 10 min) in recruiting single MNs progressively by producing mild contractions.
After initializing the online decomposition algorithm, subjects were asked to perform an isometric contraction at 10% of the MVC for 40 s while receiving visual feedback about the force exerted by the ankle. The MN activity extracted from this period was used to generate the feature space for the following experimental sessions. The feature space was composed of two spectral components based on the neural input to the identified MN pool. The estimation of this neural input corresponds with the CST, which is the sum of all discharge time series of all detected MNs. Both spectral features were obtained by bandpass filtering (3rd-order Butterworth bandpass filter) the CST and calculating the power of the filtered CST (FCST) over 256 samples to mimic the data stream present during the experiments. The cut-off frequencies for the bandpass of the low-frequency feature were set to 1–6 Hz representing information within the effective bandwidth of motor control. The bandpass characteristics for the high-frequency feature were obtained by centering a 5 Hz band around the most dominant frequency peak in the common beta activity projected to the MN pool. This peak was estimated by calculating the IMC (see section 2.5). The standard deviations and the maximums of the obtained values for both features were used to standardize and maximum-norm the feature values during the following experiments.
2.6.2. Experiment 1.1—target-tracking task
In the first experiment, subjects had to navigate a cursor in a 2D space by modulating the common MN activity within two spectral bands: (a) inside the effective bandwidth of muscle control (1–6 Hz); and (b) in a higher frequency band (beta band) known to receive an important amount of cortical common inputs (5 Hz band centered around the peak frequency of the IMC within the beta spectrum). The standardized power of the signals in these two bands was maximum-normed and used to create a 2D manifold (feature space) with units between 0 and 1 along both axes. The feature space included three targets of equal size placed along the low (TI: 0.7 F1, 0.1 F2 (distance from the origin scaled to the amplitude of the low- and high-frequency features F1 and F2)), high-frequency axis (TII: 0.1 F1, 0.7 F2), and their diagonal (TIII: 0.5 F1, 0.5 F2), with their centers having all the same distance to the origin (see figure 2). The target radius was set to 30% of the scaled feature amplitude. This target design was determined in pilot studies preceding the experiments. The final selection of target size and placement aimed to encourage naïve subjects to explore the feature space while ensuring that target hits could be achieved.

Figure 2. Schematic overview of the pre-processing and feedback chain during the target-tracking task. HDsEMG acquisition from the TA and real-time decomposition of active MN discharge timings. The sum of all detected MN, i.e. the CST, is filtered in the respective feature bandwidths (green: low-frequency feature inside the effective bandwidth of muscle control; blue: high-frequency feature inside the beta band). Finally, the features are estimated by calculating the power of each individual FCST, mapped into the cursor coordinates, and backpropagated to the subjects via visual feedback by cursor movement inside the 2D space.
Download figure:
Standard image High-resolution imageThe acquired HD-EMG signals were online decomposed and filtered in the respective bands as described above. Newly acquired data led to new values for F1 and F2 which determined the cursor's position inside the target space (see figure 2). The cursor movement was smoothed over six buffers (correspondence to 750 ms) using a moving average to smooth the estimates of the cursor's position for the visual presentation. In an initial familiarization phase, subjects were instructed to explore the target space while TI and TII were displayed. The gain to reach each target was set manually to ensure subjects could reach the targets without overexerting themselves to prevent symptoms of muscle fatigue. On average, the gain was increased to 1.98 ± 0.89 F1 and 2.22 ± 0.95 F2 for the low- and high-frequency features, respectively.
The first part of the experiment was a target-tracking task, where the subjects were asked to move the cursor within 40 s from the coordinate origin (0 F1, 0 F2) inside one of the three targets (randomly selected) and hold it there for at least seven buffers (one buffer size longer than the moving average; this corresponds to 875 ms). In total, each target was presented three times, while the same target never appeared in two consecutive trials. At the end of each trial, subjects needed to move the cursor back into the resting position (origin of the coordinate system) and stay there for at least 10 s before the new target was presented. A target hit was indicated via a color change of the target-of-interest (ToI) from blue to green, while the color switched black when the subject failed to reach it within the 40 s time window.
2.6.3. Experiment 1.2—force-tracking task
In a force feedback task, performed afterwards, subjects were instructed to follow the mean forces they had used to keep the cursor inside the ToI area. For this purpose, the force exerted during the 875 ms preceding a target hit was averaged across all successful trials. Subjects were provided with visually-guided force feedback only. Each block consisted of three constant force trajectories, mirroring the forces used in the previous target-tracking task. Each force trajectory was 20 s long and separated by a 20 s rest period. The order of the force trajectories was picked randomly from trial-to-trial. In total, this task was repeated three times and subjects were instructed to rest for 60 s between trials to avoid muscle fatigue.
2.6.4. Experiment 2—beta modulation task
The second experiment assessed whether activity in the beta bandwidth present in the TA could be modulated volitionally while holding a constant force level with the ankle. Subjects were asked to perform a force-tracking task while they were provided with feedback on both the exerted force level and the beta feature amplitude from experiment 1 (high-frequency feature: the power of the CST filtered in the beta feature bandwidth, see section 2.6.1). Beta power was calculated in the same way as in the target-tracking task. Information on both the force and the beta feature amplitudes were fed-back visually to the subjects by two plots in different colors that were drawn along a time axis as each trial was run. One trial consisted of two phases where the subject was asked to keep the force constant at 10% MVC level while the beta feature amplitude should be either increased (beta up-modulation) or decreased (beta down-modulation). The order of the beta up- and down-modulation phases was randomized on a trial-by-trial basis. Both phases were separated by 20 s rest intervals during which subjects were asked to relax. Ten seconds before the modulation started, subjects were instructed to gradually start exerting the required force of 10% of the MVC. In total, this task was repeated over three trials while subjects were instructed to rest for 60 s between trials to avoid muscle fatigue.
2.7. Analysis
2.7.1. Experiment 1.1—target-tracking task
All subjects participated in this experiment. If a subject failed to navigate the cursor towards the ToI and to hold it inside for the 875 ms period, the nearest miss position was estimated. A nearest miss is the average cursor position during the 875 ms interval during which the cursor has the shortest distance to the center of the selected ToI.
In addition, unintended hits were used as an approach to quantify the probability of cursors hitting non-selected targets before the end of both successful and unsuccessful trials. An unintended hit described the case when the cursor was held inside a non-selected target for at least 875 ms. As these did not terminate the trial, unintended hits of the same target could happen multiple times as long as the subject reentered the non-selected target recurrently.
TI and TII have the longest center-to-center distance inside the cursor space as they required the activation of one feature while suppressing the other. A chance analysis was performed to quantify the probability that the cursor was navigated and held inside either TI or TII without hitting the other target before, i.e. the probability of hitting the ToI TI without a preceding hit of TII, and vice versa. All hits that happened without preceding unintended hits of the other target area were marked as True, while no hits or preceding unintended hits as False. The chance level was estimated by repeating this analysis on the data gained during the force-tracking task (see section 2.7.2) where no feedback on the cursor movement was given.
2.7.2. Experiment 1.2—force-tracking task
All subjects participated in this experiment. The recorded EMG during the force tracking task was decomposed and filtered in low- and high-frequency feature bandwidths, as described above, to simulate cursor movement. The analysis of hits and unintended hits was repeated for the cursor movement based on the neural activity recorded during the force-tracking task, whereas the ToI corresponded to the associated force trajectory. Moreover, the chance analysis, as described above (see section 2.7.1), was repeated. Particularly, these results of the force-tracking task were used to estimate the chance level.
2.7.3. Experiment 2—beta modulation task
The mean beta feature amplitude during both beta up- and down-modulation was normalized with the mean beta feature amplitude during the control condition (10% MVC visually-guided force feedback only). Other functional parameters recorded during the modulation phases were also normalized with the respective value gained during the control condition including the mean force, mean rectified EMG, mean low-frequency feature amplitude (standardized and maximum-normed power of the CST filtered between 1 and 6 Hz), coefficient of variation (CoV) of the force, CoV of the rectified EMG, and CoV of the beta feature amplitude. Moreover, this analysis included parameters as the number of active MN as well as their discharge rates. An MN was classified as active when its discharge rate during the modulation phases (20 s time window, 10% MVC force level) was between 4 and 30 spikes-per-second.
MNs that turned inactive during one of the beta modulation phases were excluded from the analysis. Thus, the beta feature amplitude was recalculated posterior without considering these MNs. The PSD of the CST was estimated using Welch's method (Hanning window, window length: 4 s, 50% overlap). One subject was excluded from the analysis as it failed to keep behavioral indicators as force and rectified EMG power at the corresponding amplitudes while modulating beta activity.
2.8. Statistics
Statistical analysis was performed to examine the dependency between two or more variables. To compare two variables during different conditions, a two-sided pairwise t-test was performed. The normality was tested by using a Shapiro–Wilk test. If the normality assumption was violated, a two-sided Wilcoxon signed rank test was performed instead. However, if the difference between the two variables was not symmetrically distributed, a sign test was used. If more than two variables were the objective, a repeated measures ANOVA was used. If the normality assumptions were not met, Friedman test was performed instead. Post hoc tests were Bonferroni corrected. The threshold for the statistical significance was set to P < 0.05.
3. Results
3.1. Online decomposition and single MN control
In total, 95 MNs, 11.9 ± 2.3 MNs on average per subject, were detected. Prior to the start of the experiments, subjects were given time to become familiar with single MN control by providing them with visual feedback on the MN spiking activity (see section 2.6.1).
3.2. Experiment 1—target tracking and force
In experiment 1 we assessed whether low- and high-frequency components of the neural signal that projects to a MN pool and ultimately determine muscle activation can be used to control the movements of a cursor in a 2D space.
The cursor trajectory of one subject during all trials is visualized in figure 3. According to the criteria defining a target hit explained in the methods section (see section 2.6.2), 92.6% of all trials were successful (96.3% for TI, 81.5% for TII, and 100% for TIII). Moreover, all subjects managed to hit all three targets at least once. Figure 4(A) illustrates the cursor movement during the successful trials. When zooming into figure 4(A) (left), a trend of each of the cursor movements towards the corresponding target was observed. The average position during the hold period before a hit as well as the nearest misses (the closest cursor position towards the target center within an 875 ms time interval) during unsuccessful trials are shown in figure 4(B). In line with the observations in the cursor movements, the cursor end positions are distributed within the corresponding targets. Only three cursor end positions of TIII shared a subspace with endpoints of target TII. Therefore, both the cursor movement and the end-point trajectories indicated that all subjects were able to navigate within this 2D manifold to reach the presented targets. This indicates an effective augmentation of human motor output from one dimensional natural control of the pool of MNs to a 2D control that includes a second dimension from neural features not directly translated into natural movement.
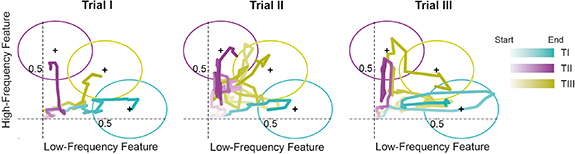
Figure 3. Cursor trajectory of one subject during the target-tracking task (experiment 1). Interpolated cursor trajectories during all trials of the target-tracking experiment of one representative subject, all targets, and their centers (black cross). Trials I, II, and III represent the first, second, and third appearance of each target, respectively. The color intensity of the cursor trajectory increases over time.
Download figure:
Standard image High-resolution image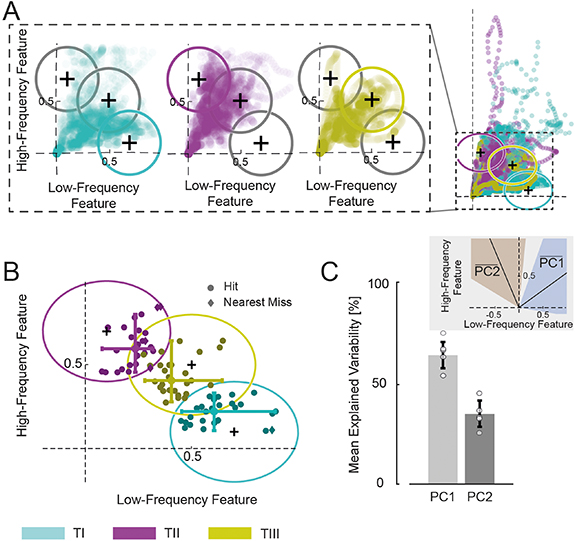
Figure 4. Cursor movement during the target-tracking task (experiment 1). (A) Cursor movement during all successful trials for all three targets, and all three targets and their centers (black cross). Each dot represents one cursor position. Left inset shows zoomed-in cursor space that was shown to the subjects for each target and the respective cursor movement. (B) Average position during hit and nearest miss intervals (875 ms) for each trial and all targets, overlaid by all three targets and their centers (black cross). (C) The first two principal components (PCs) and their explained variability of all demeaned cursor coordinates averaged across all subjects. Black bars indicate the standard deviation. Each circle represents one subject (n = 9). Mean position of the first and second PC (black line) and their standard deviation (blue and orange shaded areas, respectively) in relation to the high- and low-frequency feature axes.
Download figure:
Standard image High-resolution imageDespite the spreading of coordinates almost over the entire space, the previous analysis did not reveal whether subjects preferred certain subspaces or directions within the manifold in which they moved the cursor primarily. To study if favored directions were seen in the movements of the cursor made by the subjects, we computed the two PCs of all cursor coordinates in the 2D space for each subject (figure 4(C)). On average the first PC explained 64.72 ± 6.59% and the second one 35.28 ± 6.59% of the total variability of the cursor coordinate arrangement, which indicates that the first dimension (under natural control) was favored by the subjects but that the second dimension (spectrally separated from force generation) was also strongly represented.
Taken together, the above findings point to the fact that subjects managed to explore major parts of the feature space while separately controlling the two features used for navigation in the 2D plane.
The mean forces exerted during the hit and nearest miss periods across all subjects were 8.89 ± 5.59% of the MVC, 13.01 ± 2.70% MVC, and 11.72 ± 4.02% MVC, for TI, TII, and TIII, respectively (see supplement 1A (available online at stacks.iop.org/JNE/18/016001/mmedia)). The mean CoV of the force during hits and nearest misses across all subjects were 15.91 ± 4.68%, 3.76 ± 0.80%, and 6.94 ± 1.23%, for TI, TII, and TIII, respectively (see supplement 1B). For both the magnitude and variability of the force during hits and nearest misses, an ANOVA revealed a significant difference between the three targets (mean force, Friedman's test, Χ2(2) = 6.89, P = 0.032; CoV, Friedman's test, Χ2(2) = 9.56, P = 0.008); however, post-hoc analysis did not reveal significant differences (P > 0.05). The time-to-target across all subjects did not change during the task with an average time to reach the ToI of 9.47 ± 1.43 s, 9.21 ± 1.34 s, and 9.72 ± 1.46 s in the first, second, and third trial, respectively (repeated measures ANOVA, F(2,16) = 0.03, P = 0.968; see supplement 1C), which suggests no improvement of performance on the small time scale of the experiment. The mean time across all trials to reach TI, TII, and TIII was significantly different with 11.79 ± 0.82 s, 12.89 ± 1.97 s, and 5.20 ± 0.57 s, respectively (repeated measures ANOVA, F(2,16) = 11.77, P = 0.001). A post-hoc test revealed that subjects were able to hit TIII significantly faster than TI (two-sided t-test Bonferroni corrected, t(8) = 6.38, P = 0.001) or TII (two-sided t-test Bonferroni corrected, t(8) = 3.71, P = 0.018).
Since the results presented only informed about the cursor hitting the ToI in the given window of time, an additional analysis was performed to quantify the probability of cursors hitting non-selected targets before the end of each trial. Specifically, unintended hits were defined as the cases when the cursor was navigated and held inside a non-selected target for at least 875 ms. Unintended hits of the same target could occur multiple times per trial if the subject re-entered the non-selected target area successively. On average unintended hits of TIII occurred multiple times per trial regardless of the current ToI. This observation, as well as the time-to-target analysis, suggest that TIII, which required concurrent activation of both features, was the easiest target to reach for all subjects. TI and TII, which were associated with the increase of one feature while suppressing the other (thus maximally decorrelating the two features), required more effort. Figure 5 shows the relative amount of all hits and unintended hits across all targets and subjects. It has to be noted that the presence of unintended hits does not imply that the features could not be decorrelated but only that the subjects needed to extensively explore the 2D space before hitting the selected target, especially before reaching the targets TI and TII. Notably, 37.04% of all attempts hitting either TI or TII were successful without any unintended hits.
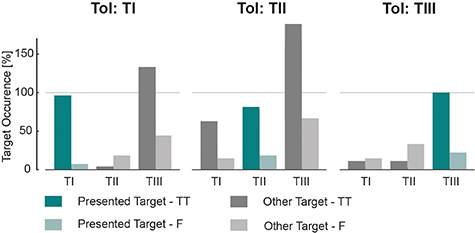
Figure 5. Target hits during target- and force-tracking task. Relative occurrence of target hits (green) and unintended hits (preceding hit of a non-selected target prior to the hit of the ToI; grey), i.e. the absolute number of (false) hits divided by the total number of trials per ToI. Results are shown across all subjects for targets TI (left), TII (middle), and TIII (right) for the target-tracking task (TT). Corresponding results of the force-tracking task (F) (control condition; see text) are shown by the lighter colors.
Download figure:
Standard image High-resolution imageIn order to assess the importance of providing feedback on both spectral features enabling subjects to perform the target-tracking task, a control condition, i.e. the force-tracking task (see section 2.6.3), was included. In a post-processing step, the cursor movement was simulated using the underlying neural activity recorded during the force-tracking task. Figure 5 compares the percentage of target hits in the initial target-tracking task and the subsequent control force-tracking task. Using the activity of MNs during the force-tracking task, TI, TII, and TIII were hit in 7.41%, 18.52% and 22.22% of all trials, which indicates that without feedback the subjects did not naturally explore the 2D space.
TI and TII are the two targets that have the most distinct placement inside the feature space. However, figure 5 shows that regardless of which of those two targets was presented as the ToI to the subject, in certain trials, unintended hits of the other target occurred. Therefore, the chance level of hitting TI and TII was estimated, which is the cutoff probability that one of these targets was intentionally hit without navigating the cursor in the other non-selected target. All hits that happened without preceding unintended hits of the other target area were marked as True, while no hits or preceding unintended hits as False (see figure 6). The results during the force task were used as an estimation of the chance level. From this analysis, across all trials, subjects managed to move and keep the cursor as instructed insight the target area of TI and TII by exceeding the chance level (figure 6).
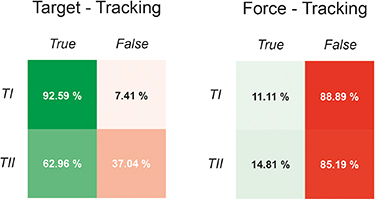
Figure 6. Chance level analysis for target- and force-tracking task. Chance level analysis of a hit in target TI or TII in the target-tracking task (left) and force-tracking task (right). 'True' implies that the ToI, i.e. either TI or TII, was hit without a preceding hit of the other target whereas 'False' includes all cases where the ToI was missed, or the other target was hit before the trial finished.
Download figure:
Standard image High-resolution image3.3. Experiment 2—beta modulation during steady contractions
Experiment 1 showed that common 1–6 Hz and beta frequency features in the MN pool can be partially uncorrelated with biofeedback. However, these results were obtained by using variable force contractions (i.e. force was not constrained; see supplementary material). As subjects received no visual feedback on force, these uncontrolled dynamics in the motor output might have influenced the activation of the beta frequency feature. Therefore, we designed experiment 2 to assess whether the beta component present in the TA during sustained contractions could be modulated while the contraction force was kept constant (i.e. isolated changes in the beta component present in the MN pool; see section 2.6.4).
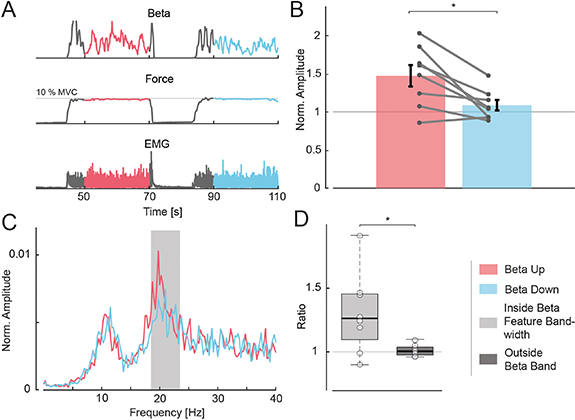
The beta activity, force and global EMG for a single trial are shown in figure 7(A). The phases during which the subject needed to modulate muscle beta activity are marked in red and blue for beta up- and down-modulation, respectively. Importantly, the subject was able to modulate the beta activity in the muscle as instructed while force and global EMG were kept unchanged (see figure 7(B)). The mean beta feature amplitude across all subjects, normalized against the amplitude in the control condition, decreased significantly from 1.47 ± 0.40 to 1.09 ± 0.20 during beta up-modulation to beta down-modulation (two-sided paired sample t-test, t(7) = 3.44, P = 0.011). Hence, the task led to a substantial increase of almost 50% in the mean beta feature amplitude during up-modulation compared to the control condition, without any changes in force. On the contrary, in the down-modulation phases, no significant changes of beta activity were observed (repeated measures ANOVA, F(2,14) = 11.13, P = 0.001; post-hoc comparison between beta down-modulation and control set: two-sided t-test Bonferroni corrected, t(7) = 1.46, P = 0.561; post-hoc comparison between beta up-modulation and control set: two-sided t-test Bonferroni corrected, t(7) = 3.47, P = 0.031).
Figure 7. Overview of beta modulation during steady contractions. (A) Beta feature amplitude, force and rectified EMG trajectories for a single trial and subject in the beta modulation task (experiment 2). Red indicates the beta up-modulation interval whereas blue the beta down-modulation one. (B) Normalised beta feature amplitude for both modulation conditions. Black bars indicate the standard error of the mean, grey points the mean value for each subject (n = 8), while the grey line combines data points of the same subject. (C) Mean PSD of MN CST during beta up- and down-modulation for a single representative subject. Grey box indicates the beta feature bandwidth. (D) Ratio of beta up-modulation power to beta down-modulation power inside the beta feature bandwidth (light grey) and outside the beta band (up to 100 Hz; dark grey) for PSD across all subjects (n = 8), shown by their median and quartiles. *P < 0.05.
Download figure:
Standard image High-resolution image
Control measurements of various variables apart from the beta activity, i.e. force, global EMG power, and the number of decoded MNs (firing rate above 4 and below 30 pulses-per-second (pps)), did not suggest any other significant changes apart from the one in beta activity. Only the MN discharge rate changed (although minimally) from 11.78 ± 2.70 pps to 11.38 ± 2.65 pps for up- and down-modulation, respectively, with borderline significance (two-sided paired sample t-test on the normalized discharge rate (1.17 ± 0.11 and 1.13 ± 0.13), t(7) = 2.37, P = 0.050). Further details are given in the supplementary materials (see supplement 2). Although the number of active MNs was reduced in certain blocks, the relationship between beta feature amplitudes during up- and down-modulation remained unaffected when recalculated with the shrunk set of MNs (two-sided t-test of normalized beta up- and down-modulation with reduced set of MNs (1.46 ± 0.74 and 1.06 ± 0.44), t(7) = 3.03, P = 0.019; see section 2.7.3).
The modulation of the beta content in the decomposed MN pools resulted in changes in the spectral properties of the CST. Figure 7(C) exemplifies this effect by illustrating the mean PSD of the CST for a representative subject during beta up- and down-modulation. The grey box indicates the beta feature bandwidth estimated before the target-tracking experiment. The power spectrum was raised in the feature bandwidth while the subject increased the overall beta feature activity. Figure 7(D) compares the ratios of the mean PSD during beta up- to beta down-modulation intervals inside the feature bandwidth relative to the spectral content outside of the beta band (up to 100 Hz). A rise in activity inside the feature bandwidth (1.31 ± 0.32) occurred during increased beta activity while an absence of this effect was observed outside the beta range (1.01 ± 0.05; two-sided paired sample t-test, t(7) = 3.00, P = 0.020).
4. Discussion
Concomitant control of supernumerary and natural limbs requires using independent command signals. Ultimately, human augmentation through artificial devices should ideally rely on the control of biological signals that have no direct involvement in the natural motor repertoire [28]. Here we characterized in real-time the spiking activity of pools of MNs projecting to a single muscle to test if the activity in the beta band (13–30 Hz) shared by the neurons could be volitionally controlled independently from voluntary muscle contractions. With the two sets of experiments run here we show for the first time that beta activity in the MN pool of a muscle can be partially uncorrelated from the effective drive to the muscles at low frequencies that causes force production, and that this could potentially be used to expand the degrees-of-freedom of a muscle for human–machine interface applications.
We designed a feedback paradigm which used as inputs the spiking activity of tens of MNs projecting to a single muscle and decomposed in real-time from HDsEMG. The designed paradigm allowed us to provide feedback to the subjects about both the contents of the decomposed MNs within the beta range and in the low (1–6 Hz) frequency band. Importantly, these two spectral components have been suggested to have different links to movements: while low-frequency components have been shown to be highly correlated with voluntary muscle contractions, beta oscillations have been associated with cortical projections to the muscles without a clear or direct role in motor function [16]. Results showed that most subjects controlled a cursor in a 2D space to hit specific targets above chance levels by partially decorrelating the low- and beta-band components in the MN pool. The distribution of the end point trajectories suggested that subjects were able to volitionally place and hold the cursor in the designated target areas. Despite TIII having intersection areas with TI and TII, the end points were separated across targets (only three end points of TIII also belonged to the cluster of TII; see figure 4). The target hit and time-to-target analyses revealed that the simultaneous up-modulation of both features (i.e. increasing the power of the MN activity within the low and beta frequency bands) was successfully achieved in most cases. On the contrary, subjects took longer to reach towards target areas when the selective promotion of one feature only was required, i.e. the decorrelation of the two features. In particular, subjects showed a limited ability to move the cursor inside the target area that required concurrent suppression of the beta activity while promoting the low-frequency feature. To eventually navigate the cursor towards the target area, the force analysis presented in supplement 1 revealed that subjects had used less-steady contractions for the targets that required pronounced beta activity. Thus, subjects used this compensatory movements as a strategy to overcome the limitations of suppressing beta activity during constant contractions. This attenuation of activity inside the beta band during the performance of variations in movement is in agreement with previous studies (see Kilavik et al for a review [13]). Furthermore, when we then asked subjects to perform a constant force output, they failed to suppress beta activity.
The frequency components inside the beta range of the MN pool are cancelled-out completely in the force output due to the low-pass filter characteristics of the muscle [23]. In fact, their functional role in movement generation is not fully understood [16, 18–20]. While in other cortical structures, e.g. the primary visual cortex, different frequency bands comprise well-described decoupled functionalities [29, 30], such clear assignments are yet to be defined for motor cortical structures. Motor cortical activity within the beta range has been suggested to act as a regulator to maintain the current state of the force output [19], a probability estimator rather than a motor control signal per se [18], or a state-informing signal enabling sensorimotor integration [16]. Our results indicate that beta activity may not be fully linked to motor function: in our experiments, subjects were able to modulate beta activity while keeping the force output unchanged. Furthermore, the accuracy of force control did not decrease when subjects voluntarily promoted beta activity. Recent studies have indicated that beta oscillations may not be directly linked with motor function but rather with a form of state definition when updates in the motor system are needed [20, 31]. While it still remains unclear how coherent cortico-muscular beta is originated in the latter case [32], our findings are aligned with this type of processing: beta modulations do not directly affect motor function and thus beta activity can be promoted probably by increasing the occurrence of beta events.
During both experiments run in this study, subjects were required to gain, at least partially, control over a biological signal (beta activity in MNs) that is outside the dynamics of the neuromuscular system [12]. To train subjects to modulate the beta activity in the common neural commands to the muscle, we used an operant conditioning framework. Subjects received a reward or punishment (through visual feedback), for example, when they were able or failed to navigate the cursor into the correct target during experiment 1. Previous brain–computer interface studies have shown that such frameworks can enable subjects to gain control over spectral features extracted from cortical signals during periods of no motor activity [33, 34]. Further experiments are needed to investigate the relevance of using visual feedback and the influence of the type of feedback given to subjects to allow volitional modulation of common beta activity in MNs.
Recent studies have shown that motor cortical oscillations can be used to control supernumerary degrees-of-freedom while maintaining motor activity by using highly invasive brain implants [33] or by triggering predefined motions of a robotic arm during motor imagination tasks [35]. In our study, however, we proposed a novel communication channel, which is accessible non-invasively via a wearable neural interface that could allow healthy individuals to expand the boundaries of human motor control. We showed that most subjects were able to explore a large section of the 2D space, and to place and hold the cursor inside certain targets during the target-tracking task. Yet, despite the existence of a favored direction in which subjects moved the cursor, the PCA revealed that a continuous cursor movement along two orthogonal axes inside the 2D space was possible. This demonstrates the potential of controlling supernumerary degrees-of-freedom non-invasively by partially decorrelating spectral features present in the MN pool and decoded with wearable (non-invasive) peripheral interfaces.
The novel neural interface, including a real-time decomposition algorithm [21, 22], enabled us to study the activity of a single MN pool in isolation. Hence, all physiological observations gained throughout the experiment are truly generated by the observed muscle and its MN pool. In addition, we restricted the leg into position to allow dorsiflexion of the ankle only and instructed subjects to keep a stable body position throughout the experiments. Although, we did not track the movement of other body parts, e.g. hip, knee and trunk, and the activity in the related MN pools which may affect the behavior of the single pool we have observed, the force and global EMG profiles provided no evidence for co-contracted antagonist muscles during the beta modulation task. Thus, the analysis presented here most likely revealed a command signal inside the neural input to the MN pool examined that is not translated into movement of the corresponding muscle but, to some extent, can be modulated in isolation.
The decomposition algorithm employed in this study uses a separation matrix to deconvolute EMG to the underlying neural activity in real-time. The initialization of this separation matrix is performed on a set of EMG data recorded prior to the experiment (see section 2.4) and is not altered for the duration of the experiment [21]. However, the quality of the EMG signal may worsen over time, for example, due to the accumulation of sweat between the skin and the electrode [36]. Such negative influences on the electrode-skin contact may result in misclassification of neural spiking activity. This issue can be overcome by adaptive decomposition (as in [37]), but in this study we have not implemented adaptive strategies to assure that the same MNs were sampled during the experiments for each subject. For this reason, we have chosen to limit the number of trials per experiment to ensure subjects having enough time to explore the augmented control strategies as well as to reach a high quality in neural spike detection throughout the experimental session.
The method proposed here based on extracting high-frequency components from MN activity inherently relies on the recorded muscle being active [21], as it depends on the characterization of MN action potentials. Nevertheless, the results of experiment 2 indicate that natural force control was not critically altered while subjects gained partially control over the high-frequency feature. Furthermore, the independent modulation of high-frequency components present in the MN pool was tested in isometric conditions only. Future research aims to probe the feasibility of using beta activity to drive supernumerary degrees-of-freedom should include additional investigations during dynamic muscle contractions. Moreover, the aspect of learning should be addressed by focusing on the temporal evolution of beta control. The current results, however, present the first evidence of a potential resource for controlling additional degrees-of-freedom without the need of an invasive signal acquisition.
In conclusion, we demonstrated the ability to decorrelate high-frequency (inside the beta range) from low-frequency components of the neural code in the MN pool by using a wearable neural interface. We showed that subjects were able to modulate activity within the beta band while maintaining a steady force output. Further investigations on whether the observed behavior of beta rhythms in the periphery are also present at the cortical level might generate a better understanding of the underpinning phenomena. Nevertheless, these results provide first evidence for the potential of beta activity in non-invasive human augmentation applications to create the basis for a control channel parallel to natural movements.
Acknowledgments
This study was funded by the EPSRC Centre for Doctoral Training in Neurotechnology and Health and by the European Research Council (Synergy Grant Natural BionicS, contract #810346).
Author contributions
D.F., J.I.P., D.Y.B. and M.B. conceived the study. M.B. carried out the experiments and conducted the analysis. D.F., J.I.P., D.Y.B. and M.B. interpreted the data, wrote and edited the manuscript
Declaration of interests
M.B., J.I.P., D.Y.B, and D.F. are inventors of a pending patent application concerning part of the methods in this work (Neural interface. UK Patent application no. 2014671.8. 17 September 2020)
Supplement 1 (1.1 MB, JPG)
Supplement 2 (1.2 MB, JPG)