
Abstract
The use of optogenetics or photobiomodulation in non-human primate (NHP) requires the ability to noninvasively stimulate large and deep cortical brain tissues volumes. In this context, the optical and geometrical parameters of optodes are critical. Methods and general guidelines to optimize these parameters have to be defined. Objective. We propose the design of an optode for safe and efficient optical stimulation of a large volume of NHP cortex, down to 3–5 mm depths without inserting fibers into the cortex. Approach. Monte Carlo simulations of optical and thermal transport have been carried out using the Geant4 application for tomographic emission (GATE) platform. Parameters such as the fiber diameter, numerical aperture, number of fibers and their geometrical arrangement have been studied. Optimal hardware parameters are proposed to obtain homogeneous fluence above the fluence threshold for opsin activation without detrimental thermal effects. Main results. The simulations show that a large fiber diameter and a large numerical aperture are preferable since they allow limiting power concentration and hence the resulting thermal increases at the brain surface. To obtain a volume of 200–500 mm3 of brain tissues receiving a fluence above the opsin activation threshold for optogenetics or below a phototocixity threshold for photobiomodulation, a 4 fibers configuration is proposed. The optimal distance between the fibers was found to be 4 mm. A practical implementation of the optode has been performed and the corresponding fluence and thermal maps have been simulated. Significance. The present study defines a method to optimize the design of optode and the choice of stimulation parameters for optogenetics and more generally light delivery to deep and large volumes of tissues in NHP brain with a controlled irradiance dosimetry. The general guidelines are the use of silica fibers with a large numerical aperture and a large diameter. The combination of several fibers is required if large volumes need to be stimulated while avoiding thermal effects.
Export citation and abstract BibTeX RIS

Original content from this work may be used under the terms of the Creative Commons Attribution 3.0 licence. Any further distribution of this work must maintain attribution to the author(s) and the title of the work, journal citation and DOI.
Introduction
Optogenetics has become ubiquitous in neuroscience research. It relies on gene transfer in the central nervous system of light sensitive channels, called opsins, so that specific populations of neurons become photosensitive. Simple pulses of light delivered through optical fibers can trigger or inhibit neuronal activity within milliseconds [1]. Since its first implementation in the 2000s the technique has been used to explore neuronal connectivity over large scales in many fields such as cognitive, behavioral and learning neuroscience [2–5]. It has evolved quickly with a systematic screening of light activated proteins and the mutagenesis of existing opsins. Despite the revolution enabled by optogenetics for invertebrate and rodent research, this technique has faced slow progress in NHP research. The first proof of principle study of optogenetics in NHP was carried out by Han et al in 2009 [6] and followed by subsequent studies that established the possibility to used excitatory and inhibitory opsins in NHP [7, 8]. These studies used optogenetics to activate neurons in the motor or visual cortex. Further studies have demonstrated behavioral changes under optical stimulation [9–14]. Recent advances and remaining challenges are reviewed in [15]. Beside the inherent ethical and practical issues of studies in NHP, these studies remain a necessary step in the evaluation of new potential therapeutical approaches. There are several critical issues for optogenetics translation to NHP and maybe 1 d to human. One is obviously related to the safe and efficient transfection of cells and control of potential immune reaction. In this work, we focus on another significant issue, which is the ability to deliver enough fluence to large brain volumes down to several millimeters beneath the brain surface in order to activate the opsins with minimal mechanical invasiveness and thermal increases. Such requirements are essential if noninvasive optical modulation of large cortical volumes connected to deep brain nuclei is to be investigated in NHP models of central nervous disorders, as recently proposed in a translational perspective [9, 16]. The quantitation of the non-invasive optical stimulation of large volume of cortical tissues is also of great interest for the field of photobiomodulation (PBM). This approach consists in illuminating large volume of tissues with red or near infrared light to stimulate non-specifically the cells via mechanisms that are thought to involve absorption by cytochrome-oxydase and further activation of the mitochondria metabolism. The technique is under active review for use in a vast range of brain diseases including stroke, traumatic brain injury, neurodegenerative diseases, where the non-specific optical stimulation of the cortical tissue was shown in mice models to lead to transient increase of ATP, decrease of inflammatory markers and -in some studies- cognitive improvement (reviews in [17, 18] and first studies in humans of the use of PBM to alleviate Alzheimer's disease symptoms in [19]).
Light distribution into the brain has always been an issue in brain optical stimulation technology [20, 21]. A simple analytical approach can provide an estimation of the light distribution in the rodent brain [22]. However, this method is limited since by the lack of degree of freedom on the optical properties, geometry of the tissues, and is inadequate to simulate complex optodes combining several optical fibers. More generally, quantitative tools to simulate optical photon paths and the subsequent activated volume for realistic geometries are missing. Some simulation packages were developed, but they were only designed to address specifically optogenetics in mice or bound to pre-defined geometries [23]. The possibility to simulate a large variety of optode geometries and arrangements in NHP brain tissue volumes with heterogeneous optical and thermal properties would guide the design of such stimulation systems for NHP. The parameters to be optimized are the volume of brain tissue that can be effectively optically modulated, considering the necessity to minimize the thermal effects and the bulkiness of the optode. The volume of tissue that can be modulated is defined as the volume of tissue that receive an irradiance above the activation threshold of the opsins while remaining below the phototoxicity level. In literature irradiance values of 1–5 mW mm−2 are mentioned to trigger opsins-controlled cell activation or inhibition. We therefore considered V5 and V1 as the volume of tissues receiving irradiance levels at least equal to 5 mW mm−2 and 1 mW mm−2.
In the present study, the impacts of the fiber diameter and numerical aperture (NA), as well as the number of fiber and their geometrical arrangement, regarding these requirements will be evaluated using Monte Carlo (MC) simulations. Thanks to this conceptual and technical optimization, we will be able to design and build new reproducible optodes, that meet all the requirements for a safe and efficient photostimulation of NHP large cortical volumes, to be used in future experiments in NHP models for central nervous system disorders.
Materials and methods
MC simulations
The MC simulations were performed using the GATE software (release 8.0) [24]. The Geant4 Application for Emission Tomography (GATE) open-source simulation platform, based on the Geant4 toolkit, has been developed since 2001 [25–27] by the OpenGATE collaboration (www.opengatecollaboration.org) and is currently widely used by the research community involved in molecular imaging, radiotherapy. A module dedicated to optical transport in tissues is available within GATE since release 6.2 [25]. Absorption, Mie scattering, refraction and reflection at boundaries are simulated. The simulation of photon transportation in biological tissues relies on a commonly used and validated implementation [26]. A set of parameters including refractive index (n), anisotropy (g), the absorption length (La), and scattering length (Ls) are defined for each type of tissues. In GATE, the mean absorption length (La), and mean scattering length (La) are defined as follows:
For the evaluation of the thermal effects we used a hybrid approach based on the bioheat model developed by Pennes [27] and validated previously [28]. Our previous in vivo and post mortem comparisons of the temperature increase of brain tissues undergoing optical stimulation have shown only a slight difference presumably due to blood flow in the living brain (see supplemental figure (stacks.iop.org/JNE/15/065004/mmedia) in [29]). As this difference of the order of a fraction of Celsius degree even for a sustained optical stimulation, we chose to use the simplified Pennes model that accounts for the heat diffusion but not for the convection due to heat transfer in blood vessels.
Parameters for optode optimization
For NHP cortical stimulation, the targeted cell layers are typically located between 2 and 4 mm beneath the brain surface, which corresponds to the average thickness of NHP cortex. These deep layers should receive sufficient fluence to activate the opsins. The commonly admitted threshold fluence is between 1 and 5 mW mm−2 depending on the type of opsin used and the transfection efficiency [1]. The fluence in mW mm−2 was chosen as the parameter of reference as it is directly related to the opsin activation. It incorporates the influence of the light source power but also its coupling to a fiber, and the dimension of the fiber section. Table 1 summarizes the geometrical and optical parameters and their range considered in the MC simulations.
Table 1. Range of the optical and geometrical parameters used in the MC simulations.
| Parameter studied | Fiber diameter Φ (mm) | Fiber numerical aperture N.A. | Inter-axes distance between fibers D (mm) | Number of fibers N |
|---|---|---|---|---|
| N.A | 0.5 | 0.1, 0.37, 0.58, 0.8, 0.9 | n.a. | 1 |
| Φ | 0.1, 0.2, 0.5, 0.75, 1 | 0.58 | n.a. | 1 |
| D | 1 | 0.58 | 2, 3, 4, 5 | 2 |
| N | 1 | 0.58 | 4 | 4 |
We first assessed the influence of the numerical aperture (NA values of 0.1, 0.37, 0.58, 0.8 and 0.9) for fibers with a fixed diameter of 500 µm. The NA describes the angular emission of fiber. It is the product of the refractive index of the medium where light exits the fiber with the sinus of the half maximum angle of light emission. We then evaluated the impact on the fluence distribution of the fiber diameter for a fixed NA of 0.58. Fibers with diameters of 0.1, 0.2, 0.5, 0.75 and 1 mm have been successively simulated. Figure 1(a) shows the set-up for the single fiber simulations carried out to study the influence of the fiber NA and diameter. The optical fiber axis was orthogonal to the tissue and the brain was tangent to the cortical tissue. In a third set of simulations, we studied the use of several fibers to increase the volume of activated tissue. We studied the effect of the distance between fibers on the fluence distribution homogeneity and the superimposition of fluence from each fiber. We have simulated distance between the fibers of 2, 3, 4 and 5 mm. The distance between the fibers is defined as the distance between their optical axes. For these simulations, fibers with a diameter of 1 mm and an NA of 0.58 were chosen according to the results from the previous simulations. In order to maintain the dimensions of the optode mechanically feasible and to limit its bulkiness we did not carry out simulation for distances larger than 5 mm between the fibers optical axes (figure 1(b)).
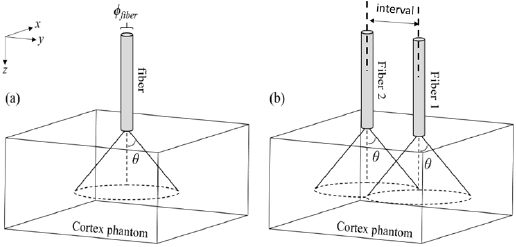
Figure 1. Geometries of MC simulations. (a) Geometry for the simulations of the NA and diamater impact. (b) Geometry for the simulation of the impact of the interval between fibers.
Download figure:
Standard image High-resolution imageOptical and thermal properties of cortical tissue
Since brain tissue strongly absorbs light in the blue/green region of the spectrum, optical stimulation of large and deep volume of brain tissues require red light that is less absorbed and scattered that other visible wavelengths. Regarding optogenetics in NHP, opsins sensitive to red light have been developed for deep tissue optical stimulation. The use of one of these red-shifted opsin, called Jaws, was recently validated in NHP cortex [30]. Accordingly, we simulated photons with a 674 nm wavelength. The optical properties of NHP cortex have been measured previously at this wavelength and used as reference optical properties in the context of optogenetics in NHP [7]. The optical properties of tissues are the aoptical absorption coefficient µa, the optical scattering coefficient µs, and the optical anisotropy coefficient g. The reduced optical scattering coefficient is a practical coefficient often used in optical transport simulation as it allows to pool the optical scattering coefficient and the optical anisotropy coefficient in a single parameter. It is defined as  = µs (1 − g). The optical [31] and thermal [32] properties for NHP cortex used in the simulations are shown in table 2. We have chosen to use the optical parameters measured on cortical human tissues [31] as they have been obtained in vivo on non-processed tissues. Other data have been obtained for human brain properties [33, 34] but they have been obtained in vitro on processed (cryogenized or saline immersed tissues). Saline immersion leads to partial blood removal and thus decrease the absorption while cryogenization has an strong impact especially on the reduced scattering coefficient [35, 36]. The optical properties use in the present studies have been measured at 674 nm are therefore relevant for the wavelengths used to activate red shifted opsins.
Table 2. Cortical tissues optical and thermal properties used in GATE simplified simulations.
| µs | g |  = µs(1 − g) = µs(1 − g) |
µa | n | k | C | ρ | K = k/ρC |
|---|---|---|---|---|---|---|---|---|
| Optical scattering coefficient | Optical anisotropy coefficient | Reduced optical scattering coefficient | Optical absorption coefficient | Refractive index | Thermal conductivity | Heat Capacity | Density | Thermal diffusivity |
| mm−1 | — | mm−1 | mm−1 | — | W · m−1 °C−1 | J · kg−1 °C−1 | kg · m−3 | mm2 · s−1 |
| 12.44 | 0.91 | 1.12 | 0.017 | 1.4 | 0.51 | 3630 | 1046 | 0.134 |
To further refine the simulations to design NHP optodes, we have used a realistic geometry based on anatomic MRI images of a primate brain segmentated into grey matter, white matter, and cerebrospinal fluid. The simulation of the motor cortex with an optode composed of four fibers was carried out. The optical and thermal properties used in the simulation are summarized in table 3.
Table 3. Optical and thermal properties used in the segmented primate brain geometry.
| µs | g |  = µs (1 − g) = µs (1 − g) |
µa | n | k | C | ρ | K = k/ρC | |
|---|---|---|---|---|---|---|---|---|---|
| mm−1 | — | mm−1 | mm−1 | — | W · m−1 °C−1 | J · kg−1 °C−1 | kg · m−3 | mm2 · s−1 | |
| White matter | 9.0 | 0.85 | 1.35 | 0.0165 | 1.4 | 0.51 | 3630 | 1046 | 0.134 |
| Gray matter | 9.4 | 0.9 | 0.94 | 0.08 | 1.4 | 0.51 | 3630 | 1046 | 0.134 |
| CSF | 2.5 | 0.9 | 0.25 | 0.004 | 1.4 | 0.51 | 3630 | 1046 | 0.134 |
Derivation of 3D fluence and temperature increases maps
The GATE simulations outputs were the coordinates of photons' absorption within a 5 × 5 × 2 cm3 area beneath the fiber tip. For each simulation, 108 optical photons were launched from each fiber and propagated through the tissues. For each set of optical and geometrical parameters, we derived the relative fluence isocontours considering the radial distance to the fiber for absorbed photons and normalizing by the total number of launched photons. Fluence profiles along the direction of fiber axis (z profile) and perpendicular to the fiber axis (y profile at 0.5 mm depth) were both calculated with a spatial resolution of 10 µm. The simulation results were normalized to the real number photon emitted by the fiber.
Fluence in each voxel was derived from the number of photon counts passing through the voxels Cphotons (photons per mm3) using the following equation (1).
where F is the fluence in mW mm−2, Cphotons is the number of photons per mm3, c is the speed of light in vacuum in mm.s−1, n is the media optical index, i.e. 1.4 for biological tissues, and Ephoton is the energy of a photon at 674 nm.
We used a hybrid MC/analytical approach to simulate the dynamic increase of temperature during an optical stimulation. Optical absorption was dynamically recorded in a voxelized geometry and used to derive the dynamic temperature increases in the tissues considering the diffusion modeled on the basis of the classical bioheat model [27]. Details of the implementation of the heat generation and diffusion from optical absorption can be found in [28].
Results
Impact of numerical aperture
The relative fluence isocontours obtained for a single 500 µm diameter fiber with increasing NA are shown in figure 2(A). Figure 2(B) shows that lower NA lead to a modest increase of light transmission in the axial direction within the first millimeter deep into the cortex. Similarly, the lateral distribution changes with the NA are modest and located close to the light entry point. Higher NA values produce a larger lateral spread of the photons. Yet, due to the strong optical diffusion of brain tissues, the fluence quickly becomes homogeneous as depth increases. Beyond 2 mm from the entry point, the fluence distribution and isocontours are identical for all NA (see insert in figure 2(B)). For all NA, about 1% of the light reaches a 2 mm depth in the phantom, 0.5% and 0.2% for 3 and 5 mm depths respectively. The fluence immediately at the fiber tip is larger for low NA fibers, potentially resulting in stronger local thermal effects. A NA of 0.5 appears to be a good compromise to obtain an optical stimulation of a large volume of cortical tissue at 1 mm depth from the surface. It allows minimizing the fluence for the tissues around the light entry point, while maintaining appropriate light penetration. Consequently, in the following sections, the NA was set to 0.58 corresponding to common available multimode fibers.
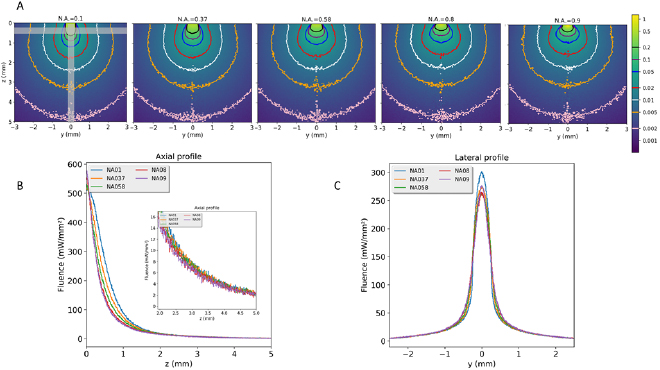
Figure 2. Influence of the numerical aperture of the optical fiber on the fluence distributions. (A) Isocontours of relative fluence for increasing N.A. and a fiber with a 0.5 mm core diameter. Data have been normalized by the total number of photons exiting the fiber. The normalized isocontours at 0.002, 0.005, 0.01, 0.02, 0.05, 0.0.2 are given as colored lines. Areas used to calculate the profiles of figure (B) and (C) are shown as light grey bars on the outermost left diagram on figures (A) and (B) axial fluence profiles computed for the 0.5 by 0.5 mm2 area along the axis of the fiber. (C) Lateral fluence profiles at 0.5 mm below the surface.
Download figure:
Standard image High-resolution imageImpact of the fiber diameter
The relative fluence isocontours for fibers with increasing core diameters are presented in figure 3(A). The corresponding axial and lateral fluence profiles are shown in figures 3(B) and (C). The diffusive nature of cortex leads to fluence homogenization beyond the first millimeter of tissues surrounding the fiber tip. The fluence near the surface of the cortex is significantly higher for fibers with lower diameters. Fibers with larger core result in much lower local fluences due to the distribution of the photons over a larger surface. Considering the lateral fluence profiles, the fluence peaks are much sharper for lower diameter fibers. Consequently, larger diameter fibers should be chosen to minimize heat effects at the brain surface. Still, one should consider the availability of large core fibers and the bulkiness and mechanical flexibility of each light guide (including fiber and ferrule), especially for optodes with multiple fibers arrangement, necessary for the stimulation of large brain tissue volumes. Clearly, several fibers are requested to illuminate a 200–500 µl volume of cortical tissue with sufficient fluence to actuate light controlled channels.
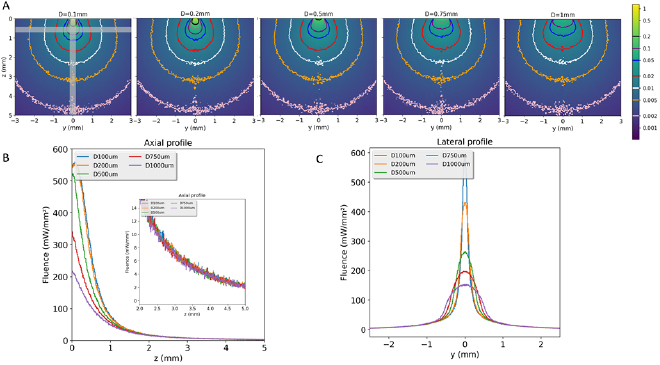
Figure 3. Influence of the core diameter of the optical fiber on the fluence. (A) Isocontours of relative fluence for increasing core diameters and a fixed N.A. of 0.58. Data have been normalized by the total count of photons exiting the fiber. The normalized isocontours at 0.002, 0.005, 0.01, 0.02, 0.05, 0.0.2 are given as colored lines (B) axial profile of fluences. (C) Lateral profiles of fluence at 0.5 mm below the surface. Areas used to calculate the profiles are shown as light grey bars on the outermost left diagram in figure (A).
Download figure:
Standard image High-resolution imageImpact of the distance between fibers
Two fibers with a NA of 0.58 and a core diameter of 1 mm were simulated in order to evaluate the influence of the distance between fibers on the fluence distribution. The fluence isocontours shown in figure 4 correspond to the coronal plane through the axis of both fibers and the transverse plane at 3 mm below the cortical surface. The fluence decreases rapidly with depth. Interestingly, the use of fibers allows obtaining a significant number of photons down to several millimeters inside the tissue. For all the simulated configurations with two fibers, about 1% of the total number of photons are absorbed locally at 2 mm depth which is similar to what we observed for a single 1 mm diameter, 0.58 NA fiber (figure 3(A), extreme right). Since both simulations are normalized by the total number of photons, this means that twice more photons are absorbed in the two fibers configuration. In addition, the homogeneity of the fluence distribution depends on the distance between the fibers. Thus, for a 5 mm distance between fibers, the individual fluence patterns of each fiber can still be observed at a depth of 3 mm. The fluence becomes homogeneous for an inter-fiber distance below 4 mm. The lateral extension of the illuminated volume also increases with the inter-fiber distance. To illuminate a large brain volume deep down to several millimeters, a distance of 4 mm between the fibers seems adequate for 1 mm diameter fibers with NA 0.58 because it induces a large and homogeneous illumination coverage.
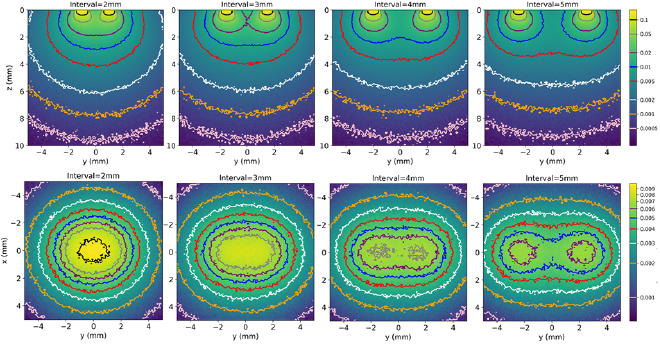
Figure 4. The fluence isocontours in coronal view through the axis of the fibers (upper row) and in transverse view at 3 mm depth (lower row). Columns from left to right correspond to a distance of 2, 3, 4, 5 mm between fibers (both fibers have a 1 mm core diameter and a 0.58 N.A.). Data have been normalized by the total number of photons exiting the two fibers.
Download figure:
Standard image High-resolution imageSimulations of 3D fluence distribution for an optimal four fibers optode design
Based on the simulation results of the previous sections, four fibers of 1 mm diameter and 0.58 NA with an inter-fiber distance of 4 mm, were used to simulate an optimized optode. A practical implementation is presented in supplementary data 1. A fluence of 150 mW mm−2 at the fiber tips was simulated. Figure 5(A) shows the relative fluence maps at different depths starting from the cortical surface down to 3 mm depth. The illumination pattern for each individual fiber can be seen down to 2 mm depth. For deeper planes, the fluence is homogeneous due to the diffusion of light in tissues. Figure 5(B) shows the relative fluence maps of the central coronal plane. Deeper than 3 mm below the surface, the fluence is homogeneous over a lateral extent of at least 8 mm. The fluence decreases with the depth, yet it remains above the opsin stimulation threshold of 5 mW mm−2 down to 5.2 mm depth.
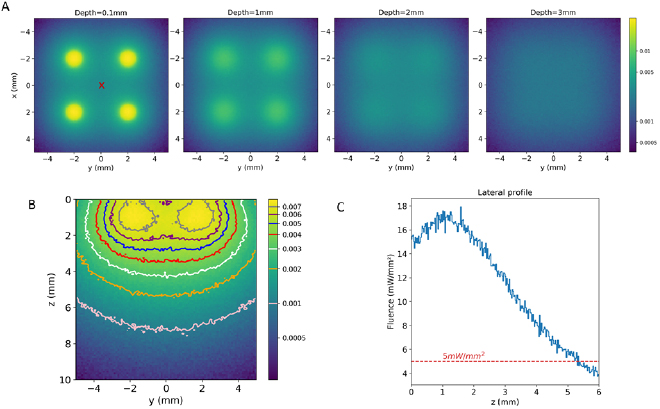
Figure 5. Simulation of the four fibers optodes. (A) Fluence distribution maps in axial planes at increasing depths from the brain surface (0.1, 1, 2 and 3 mm). (B) Normalized relative fluence map of the central coronal plan (light grey on figure (A)) and its corresponding fluence isocontours. (C) Fluence profile as a function of depth at the center of the optode (red cross on figure (A)).
Download figure:
Standard image High-resolution imageSimulation of the thermal effects of the four fibers optode
Figure 6 shows the temperature increase in the axial planes at depths corresponding to the fluence maps of figure 5(A). As expected, the temperature increase is maximum at the tip of each fiber, though it is limited by the use of large diameter and large NA fibers. Temperature increase of 0.65, 0.35 and 0.1 °C are obtained respectively at depths of 0, 1 and 2 mm below each fiber while the temperature increase below the center of the optode is limited to 0,1 °C (profile on figure 6(B)).
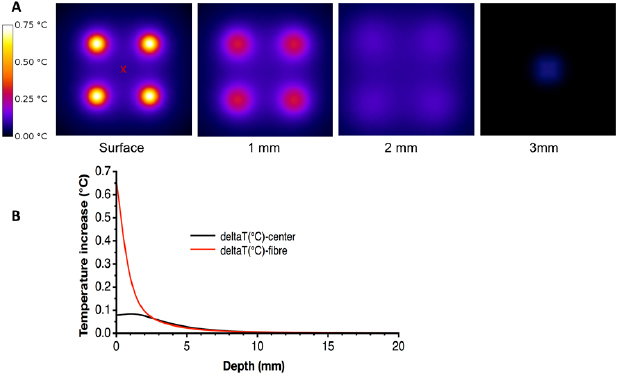
Figure 6. (A) Thermal maps corresponding to fluence distribution from figure 5(A). (B) Temperature increase as a function of depth at the center of the optode (red cross on figure (A)) and below one fiber.
Download figure:
Standard image High-resolution imageSimulation of the motor cortex optical stimulation and heat effect in NHP
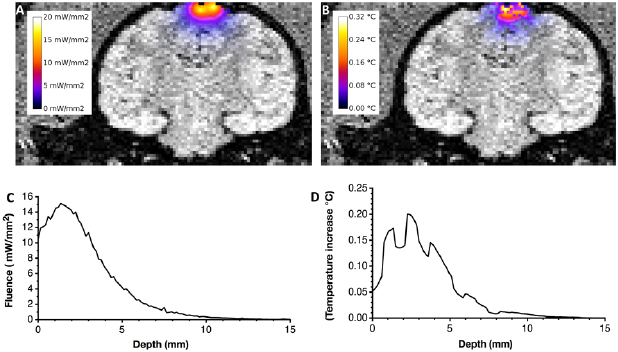
In order to illustrate the ability of the developed simulation tools to provide insights for translational application of optical stimulation, we have used a more realistic input geometry based on segmented MRI images of a non-human-primate brain. The four fiber optode is positioned over the cortex targeting motor cortex tissues assuming to contain neurons transfected with a red shifted inhibitory opsin. Figure 7 shows coronal slices of the brain superimposed with the fluence and temperature increase distributions.
Figure 7. Simulation of the optical stimulation of the motor cortex of the brain of a non human primate using the 4 fibers optode. (A) Fluence distribution superimposed to a coronal slice of the brain primate (through the central axis of the optode) (B) temperature increase superimposed to the same coronal slice. (C) Profile of fluence as a function of depth below the center of optode. (D) Profile of temperature increase as a function depth below the center of the optode. Profiles are calculated in ROI located below the center of the optode within voxels of 0.3 mm × 0.3 mm × 0.15 mm along the z axis.
Download figure:
Standard image High-resolution image
The fluence profile on figure 7(B) is close to the profile observed in the homogeneous geometry though the 5 mW mm−2 threshold is valid only down to 4.65 mm almost 1 mm above the same limit for the homogeneous simulations (figure 6(C)). This threshold corresponds to a volume of activated tissues of 285 mm3 composed 117 mm3 of GM, 151 mm3 of WM and 17 mm3 of CSF (values of V1 are provided in supplemental table 1). The fluence profile is smooth contrarily to the temperature increase profile that reflect the inhomogeneities of photon absorption through the different tissues types. The absorption is very low in CSF, then, as the photons enter the brain they encounter layers of gray and white matters.
Discussion
We carried out MC simulations to establish the optimal design of an easily reproducible optode to perform optogenetics modulation of large NHP cortical volumes. The required specifications include minimal invasiveness (the optode should not penetrate the cortex), and a homogeneous fluence distribution in cortical layers III–VI with a minimal fluence of 5 mW mm−2 and limited heat effects. The use of red light is necessary to noninvasively reach deep cortical tissues since the brain absorbs and scatters less red light compared to lower wavelengths. Thus, red-shifted opsins are required to allow tissues photomodulation down to targeted cortical layers at 3 mm depths, which correspond to the average thickness of NHP cerebral cortex [37]. A growing number of red-shifted opsins are now available and suitable for noninvasive photomodulation of the cortical layers in NHP (e.g. VChR1, C1V1, and ReaChR, Chrimson, Jaws) [38–41].
What are the limitations of the MC simulations?
GATE was used in the present study to obtain fluence and resulting temperature increase maps. Other public MC code are available for the simulation of photon transport Monte Carlo multi layered (MCML), MCextreme or tMCimg [26, 42, 43], but do not allow to simulate thermal effects simultaneously. MCML has been used to simulate the transport and detection of photons in the context of brain neurosurgery for the safe and accurate positioning of electrodes [44] and is limited to semi-infinite layer geometries. tMCimg and MCextreme allow to simulate more realistic geometries based on segmented MRI or CT images but require data to be formatted into meshed files, which are not straightforward to handle for neurobiologists or neurosurgeons. Recently, OptogenSIM, an open-source platform based on mcxyz MC code, has been developed for optogenetic application. However, this platform is limited so far to optogenetics in mice [23]. GATE offers several key features: new materials with optical and thermal properties can be easily added and analytical as well as voxelized phantoms and sources can be used. We believe that the current limitation of MC simulation results mainly from the limited accuracy of the tissues optical and thermal properties. In vivo human brain optical properties measurements are notably scarce in the literature [31, 33, 34, 45]. Here, we used the brain optical properties taken from the only study, to our knowledge, that was carried out in vivo on human brain tissues [31]. Very promising direct local measurement approaches have been recently developed and could enable to improve the accuracy of the simulations [46]. A previous study used MC simulations and a similar bioheat model to quantify the irradiance dosimetry and heat effects during optogenetics in NHP [47]. In this study the stimulation at 473 and 561 nm using an optrode implanted in the brain tissues was considered. Two different fiber diameters were simulated (10 µm and 200 µm) with very short and low power optical stimulation (1 mW, 1 ms). Although carried out at lower wavelength and in a different geometry (single fiber implanted in brain tissues versus four fibers at the brain surface) the results regarding the influence of the fiber diameter are similar to our results. The larger diameter fiber led to lower local heat effects while maintaining the same volume of stimulated tissues. In the configuration simulated (5 mW of 561 nm light injected into a 200 µm diameter fiber) the volume of activated tissues is estimated to be of about 3 mm3 thus supporting the need of red shifted opsins and higher power and several fibers to stimulate large volumes of brain tissue. Supplementary table 1 provides the volume of stimulated tissues for the two fibers and four fibers configuration simulated showing that volumes of tissues of at least 300 mm3 of brain tissues can be stimulated using the four fiber optode.
The data shown on figure 7 show the ability to perform simulations in realistic geometries based on segmented MRI data. The simulation provides with 3D maps of photon absorption and subsequent thermal effect including heat diffusion. Yet, the optical properties available in the literature for primate brain tissues are scarce and scattered over one order of magnitude [31, 33, 34, 47], and the variability of thermal coefficient for specific tissues is not known. Consequently, MC simulations should be considered as general guidance for NHP optodes design and stimulation protocols rather than as absolute quantitative indicators. More experimental work, including the in vivo measurement of tissue dependent opto-thermal properties is required to facilitate the translation of photomodulation techniques to clinical applications.
Which type of fiber should be used?
The impact of NA and core diameter of fiber were evaluated. The results indicate that larger fiber diameters and larger NA allow minimizing the fluence at the cortical surface and subsequent heating. These results are in agreement with previous calculations carried out for optical stimulations in the rodent brain [12, 23, 48]. Plastic optical fibers of 1 mm diameter with a NA around 0.5 are commercially available. They also have the advantage of being mechanically robust and easy to manipulate. Yet, the high-power sources used to provide the required fluence into deep cortical layers will produce a large amount of heat at the laser-fiber interface that would damage plastic fibers. Silica core fibers are a better choice though they are more fragile and usually have smaller diameters and NA between 0.1 and 0.3. To our knowledge, at least one multimode silica core fiber with a diameter of 1 mm and a NA of 0.5 is commercially available off the shelf (FP100ERT Thorlabs) and several fiber manufacturers offer custom fiber design capabilities. Its maximum bend radius of 40 mm without loss is well adapted to the overall geometry of brain tissue stimulation. In addition, the maximum damage threshold of the fiber materials is of about 250 kW cm−2, which is several orders of magnitude above what is required for the stimulation of brain tissues. Finally, such fibers can be easily sterilized and are commonly used in preclinical rodent studies.
How many fibers are required?
The use of a single fiber is not adequate to optically modulate a large volume of brain tissue. It would require a too high fluence to ensure that the opsin threshold is reached millimeters away from the fiber tip. The total volume of optically modulated tissue is limited by the diffusion and absorption of light. The normalized fluence isocontours on figure 3(A) show that, for a fiber with a 1 mm diameter and 0.58 NA, the fluence at the fiber tip has to be 1000 mW mm−2 to obtain a fluence of 5 mW mm−2 down to 3 mm deep in the brain. Large diameter fibers (above 5 mm) could allow reaching the fluence threshold in larger volumes while minimizing the fluence at the brain surface. However, this would require coupling a laser diode with several hundreds of mW into a non-standard and fragile large diameter glass fiber. A much cost-effective approach is to consider an optode composed of several fibers. In this geometry, photons from each fiber can add up locally to ensure that the fluence is above the opsin activation threshold. Basically, this allows dividing the fluence required at the fiber tip by the number of fiber used. Our results indicate that a distance of 3–4 mm between the fibers allows obtaining a broad and homogeneous fluence down to 3–4 mm depths in cortical tissues. A volume of about 300 mm3 is then appropriately stimulated above the 5 mW mm−2 threshold if a fluence of 150 mW mm−2 is injected in each fiber. We considered four fibers, each one coupled to a laser diode. This allows controlling the power output and optical stimulation pattern (duration, frequency, duty cycle) for each individual fiber. This opens the way for complex simultaneous or sequential optical stimulation patterns. In order to validate the feasibility of rapidly designing such multifiber optode we have designed a four fiber optode using off the shelf optical fibers, a surgical grid used in routine neurosurgery in humans and custom designed relay fibers (supplemental figure 1).
What is the expected temperature rise and how may it affect the tissues?
Recent studies have provided simulations and experimental data on the thermal effects following optical stimulation of brain tissues using optogenetics. Most of these data have considered solely the excitation in the blue-green range [23, 48] in the rodent brain. In a previous work, we studied experimentally in vivo in rodents the minimally invasive photostimulation using a fiber (0.4 mm diameter and a 0.48 NA) with 5 ms pulses of 638 nm light with a power varying from 100 to 600 mW mm−2 and a frequency varying from 20 to 60 Hz [49]. We observed a maximum temperature rise of about 0.1 °C to 2.5 °C depending on the experimental parameters. Histological analysis did not show light induced damage at the cellular level when a 200 mW mm−2 continuous power was applied. We also did not observe light induced but opsin-independent neural activity contrarily to others [49]. Considering safety issues for translational research, it is highly desirable to minimize temperature increase which could have more subtle effects such as local vasodilation of blood vessels, or opsin independent increase of neuronal firing rates leading to behavioral alterations [50, 51]. Our simulation data show limited temperature increase at the brain surface with a fluence up to 150 mW mm−2 at the output of each fiber. These temperature increases are within the range of normal temperature increase due to environmental changes or physiological activation [52, 53]. Experimental data showed a linear relationship between the total energy deposition and temperature increase [49]. On this basis, MC simulations can easily be scaled up to reflect the stimulation protocol, thus providing an efficient method to optimize irradiance levels and stimulations parameters such as duration and pulses frequencies for the optical stimulation of large and deep cortical volumes in the primate cortex. Simulations based on segmented MRI images of the brain show the influence of the local inhomogeneities of the optical properties on the heat effects.
Acknowledgments
This research work was supported by University Paris-Sud Student exchange international program. Initial help from Dr Michael Dubow was highly appreciated. Technical supports from A Liege was essential at IMNC lab. This work was partly supported by ANR t-GATE ANR-14-CE23-0008.
Declarations of interest
None