
Abstract
Applying the timing tools of kilohertz quasi-periodic oscillations (kHz QPOs) and cross-correlations, we study the influence of the magnetosphere-disk relation on the X-ray radiation process of GX 17+2. First, as the spectral state track of X-ray emission evolves along the horizontal branch (HB), the magnetosphere-disk radii of the source derived by kHz QPOs shrink from r ∼ 24 km to r ∼ 18 km, while its average X-ray intensities in ≤10 keV and in ≥10 keV show the opposite evolutional trends. Moreover, this branch has been detected with the anti-correlations between the low-/high-energy (e.g., 2–5 keV/16–30 keV) X-rays. We suggest that in HB there may exist an X-ray radiation transfer process at the disk radii near the neutron star (NS), i.e., ∼5–10 km away from the surface, which probably originates from the interaction between the corona or jet with high-energy X-rays and accretion disk with low-energy X-rays. Second, as the source evolves along the normal branch (NB) and along the flaring branch (FB), their average X-ray intensities in all ∼2–30 keV show the monotonously decreasing and monotonously increasing trends, respectively. In addition, these two branches are both dominated by the positive correlations between the low- and high-energy (e.g., 2–5 keV/16–30 keV) X-rays. Moreover, the evolution along NB is accompanied by the shrinking of the magnetosphere-disk radii from r ∼ 18 km to r ∼ 16 km. We ascribe these phenomena to that as the shrinking of the accretion disk radius, the piled up accretion matter around the NS surface may trigger the radiation that produces both the low- and high-energy X-rays simultaneously, and then form the branches of NB and FB.
Export citation and abstract BibTeX RIS
1. Introduction
The observations on neutron star low mass X-ray binaries (NS-LMXBs) have found various spectral states in the X-ray color–color diagrams (CCDs), or equivalently in the hardness-intensity diagrams (HIDs), based on which the sources can be classified as the atoll sources (luminosity ∼ 0.01–0.5 LEdd) and Z sources (luminosity ∼ 0.5–1 LEdd) (Hasinger & van der Klis 1989). For atoll sources, their tracks in CCDs or HIDs are usually named as the extreme island state (EIS), island state (IS), lower (LB) and upper banana (UB) states, while for Z sources the corresponding tracks are called the horizontal branch (HB), normal branch (NB) and flaring branch (FB). Moreover, according to the different directions in branches, Z sources are further identified as the Cyg-like/Sco-like types (Kuulkers et al. 1994). In addition, it is also found that an individual source like XTE J1701-462 can exhibit two tracks of atoll/Z shapes (Homan et al. 2007; Lin et al. 2009; Homan et al. 2010; Fridriksson et al. 2015). The X-ray energy spectra in NS-LMXBs are usually interpreted with the bi-components, where the soft (thermal) component is suggested to relate to either the accretion disk (Mitsuda et al. 1984) or NS surface (White et al. 1986), and the hard (non-thermal) one that may relate to the inverse Comptonization of the soft X-rays in the Compton cloud (i.e., corona, see Church & Bałucińska-Church 2004), or a jet (e.g., Di Salvo et al. 2000, 2002; Migliari & Fender 2006), etc. In particular, the accretion disk corona model usually assumes that there may exist a hot corona that is located around the inner accretion disk.
The Fourier power spectrum is a widely used tool of timing analysis, based on which the Rossi X-ray Timing Explorer (RXTE) has discovered the kilohertz quasi-periodic oscillations (kHz QPOs) among the power density spectra of NS-LMXBs (Strohmayer et al. 1996; van der Klis et al. 1996). These QPOs can exhibit the double peaks (lower/upper of ν1/ν2) that cover the frequency range in ≃100–1300 Hz (van der Klis 2000, 2006). The observations indicate that the frequencies of these QPOs are related to the NS spins (Wang et al. 2018), which also show the monotonically increasing trend along the atoll tracks (e.g., Méndez & van der Klis 1999; Méndez et al. 1999; van Straaten et al. 2000; Di Salvo et al. 2001, 2003; van Straaten et al. 2003; Altamirano et al. 2008), or along the Z tracks (e.g., van der Klis et al. 1996; Wijnands et al. 1997a, 1998a, 1998b; Jonker et al. 1998; Homan et al. 2002; Jonker et al. 2002; Lin et al. 2012). It is widely accepted in theory that kHz QPOs could be associated with the reaction of the accretion disk (Méndez & Belloni 2021; Miller 2021), and their emissions may be affected by the extreme gravitational field (Stella & Vietri 1999; Stella et al. 1999; Abramowicz et al. 2003a, 2003b; Kluźniak et al. 2004; Kluźniak 2005), or the strong magnetic field (Miller et al. 1998; Lamb & Miller 2001; Zhang 2004) around NS.
In the accretion theory of NS-LMXBs, the motion of the plasma around NS in a Keplerian disk obeys the magnetohydrodynamic Euler equation, i.e.,  (Shapiro & Teukolsky 1983; Frank et al. 2002) with the disk accretion rate–
 and inner disk radius (or, the magnetosphere-disk radius)–r = Rm. Then, if assuming the ϕ direction velocity–vϕ
as the Keplerian velocity–vK
and inner disk radius (or, the magnetosphere-disk radius)–r = Rm. Then, if assuming the ϕ direction velocity–vϕ
as the Keplerian velocity–vK
 , and the magnetic field strength of Bz
/Bϕ
as the dipole field (
, and the magnetic field strength of Bz
/Bϕ
as the dipole field ( where Bs is the NS surface field strength and R is the stellar radius), one can obtain a relation of
  . Moreover, the co-rotation radius–Rco of the accreting NSs is the radial distance where the Keplerian orbital frequency of the accretion flow equals the NS spin frequency (i.e., νK = νs). It is noticed that NS is in the spin-up state when Rm < Rco (or νK > νs), while it is in the spin-down state when Rm > Rco (or νK < νs). To explore the magnetosphere-disk structures of NS-LMXBs and kHz QPOs, Wang et al. (2017, 2020) investigated the link of the twin kHz QPOs with NS spin-up state. Moreover, the authors also showed that the magnetosphere-disk radii of HB/NB in Z sources cluster around the range of ∼20–29 km/∼16–20 km, respectively.
The Cross Correlation Function (CCF) is another timing technique in analyzing the correlation and time lag between the signals in the two energy bands detected simultaneously, which has been adopted to explore the X-ray radiation process and accretion disk structure of NS-LMXBs (Brinkman et al. 1974; Weisskopf et al. 1975). The previous CCF studies have detected the anti-correlations and time lags (with timescale spanning from tens to hundreds of seconds) between the soft/hard X-rays in atoll sources (e.g., 4U 1735-44 Lei et al. 2013, 4U 1608-52 Lei et al. 2014 and 4U 1705-44 Malu et al. 2021) and Z sources (e.g., Cyg X-2 Lei et al. 2008, GX 5-1 Sriram et al. 2012, XTE J1701-462 Wang et al. 2014 and GX 17+2 Sriram et al. 2019; Malu et al. 2020; Sriram et al. 2021). In particular, the anti-correlations in atoll sources with time lags are mainly found in UB and IS (e.g., Lei et al. 2013), while those in Z sources are mainly distributed in HB as well as upper NB (e.g., Lei et al. 2008). In addition, it was also found that the sources exhibit the obvious profile variations in the X-ray energy spectra during the observations with the anti-correlations, i.e., presenting the pivoting spectra (e.g., Lei et al. 2008). It was suggested that these anti-correlated time lags in NS-LMXBs may be related to the activity of the accretion disk or corona (e.g., Sriram et al. 2019).
GX 17+2 is classified as a typical Sco-like Z source, located about ∼13 kpc away from the earth (Galloway et al. 2008), and its detected kHz QPO frequencies show a monotonically increasing trend with the Z track branch evolution (e.g., Homan et al. 2002). In addition, this source has also been detected with CCF evolution along the Z track, where the anti-correlations with the long timescale lags between the soft/hard (2–5 keV/16–30 keV) X-rays are distributed in HB and NB (e.g., Sriram et al. 2019). Motivated by the previous studies on GX 17+2, the major purpose of this paper is dedicated to exploring the evolutions of the kHz QPO emission radii, X-ray intensities, and CCFs along the Z track, based on which we then probe the influence of the magnetosphere-disk relation on the X-ray radiation process.
The major contents of the paper are organized as follows: We first introduce the observational data of GX 17+2 and timing tools in Section 2. Then, we analyze the evolutions of the kHz QPO emission radii, X-ray intensities and CCFs along the Z track of the source in Section 3. Last in Section 4, we discuss the results, and further give the theoretical explanations and conclusions.
2. Observations and Data Reduction
2.1. Data Description
We collected the published literature for the detections of kHz QPOs in GX 17+2, and constrain the measurements showing the frequency evolution of QPOs with the track in CCD or HID. Then, we focus on the detection results by Homan et al. (2002), who investigated the RXTE observations of the source GX 17+2 spanning the time from 1997 February to 2000 March. The RXTE satellite is comprised of three onboard instruments, in which the Proportional Counter Array (PCA) consists of five co-aligned Proportional Counter Units (PCUs), each shares an effective area of ∼1250 cm2 and is sensitive in the energy range of 2–60 keV (Bradt et al. 1993; Jahoda et al. 2006). We adopted the same RXTE/PCA data used by Homan et al. (2002) to do the corresponding analysis, and omitted the observations that exhibit the Type I bursts. The data information is shown in Table 1, which contains a total exposure time about ∼540 ks. For the following analysis in this paper, only the corresponding data in PCU 2 are adopted due to the best calibration and longest observational time (Jahoda et al. 2006).
Table 1. RXTE Data of GX 17+2 Used in This Paper
| Start Date | End Date | Exposure | Gain Epoch |
|---|---|---|---|
| (ks) | |||
| 1997-02-02 | 1997-02-27 | 59.5 | 3 |
| 1997-04-01 | 1997-04-04 | 35.2 | 3 |
| 1997-07-27 | 1997-07-28 | 42.9 | 3 |
| 1998-08-07 | 1998-08-08 | 71.0 | 3 |
| 1998-11-18 | 1998-11-20 | 87.5 | 3 |
| 1999-10-03 | 1999-10-12 | 237.6 | 4 |
| 2000-03-31 | 2000-03-31 | 6.9 | 4 |
Download table as: ASCIITypeset image
2.2. Hardness-intensity Diagram
In this work, the HID is used to analyze the spectral state of GX 17+2, as well as its X-ray radiation distribution. To obtain HID, we gain the corresponding light curves (Standard 2 mode with 16 s bin size) from the data in Table 1, and subtract the backgrounds. Then, we take the count rate in 2–16 keV as the X-ray intensity, and further define the hard color as the count rate ratio of the two bands of 9.7–16 keV/6.5–9.7 keV. The dead-time of the light curves is not corrected, which shares the dead-time fractions of ∼3%–6%. Moreover, the data in Table 1 span the two gain epochs of 3 and 4, and we adopt the Crab Nebula to correct the response variations: we calculate the colors and X-ray intensities (the same as defined in GX 17+2) in PCU2 of the Crab Nebula both in gain epochs 3 and 4, and then obtain the correction factors between these two epochs (van Straaten et al. 2000). Furthermore, we convert the corresponding hard colors and X-ray intensities in epoch 4 of GX 17+2, into those in epoch 3 with these factors. Finally, Figure 1 exhibits the corrected HID of GX 17+2.
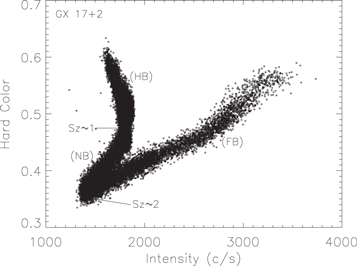
Figure 1. The HID of GX 17+2, where the X-ray intensity represents the count rate in 2−16 keV, while the hard color is taken as the count rate ratio of the two bands in 9.7−16 keV/6.5−9.7 keV. For clarity, the diagram also indicates the corresponding positions of SZ ∼ 1 and SZ ∼ 2 (i.e., HB/NB and NB/FB vertexes) as defined in Homan et al. (2002).
Download figure:
Standard image High-resolution image2.3. KHz QPOs Detected with Sz Parameterization
Here, we adopt the kHz QPOs detected by Homan et al. (2002) to investigate the accretion disk structure of GX 17+2. First, so as to identify the certain position on the Z track of the source quantitatively, Homan et al. (2002) projected all the points in HID onto a bicubic spline, and defined the parameterized value Sz ∼ 1 to the HB/NB vertex, giving the value Sz ∼ 2 to the NB/FB vertex. In this method, the position of each point in the Z track can be parameterized by drawing a smooth curve through the HID points, and projecting the point on to this curve. The smooth curve is defined by choosing, by hand, the normal points in HID. These normal points are ranked, and then two cubic spline fits are made, one for the hard color and the other for the intensity, between the rank and hard color/intensity. Finally, the two resulting splines form a numerical representation of the Z track in the HID plane (Dieters & van der Klis 2000). Then, the authors scaled the other points of the track based on the NB length (see also e.g., Hasinger et al. 1990; Wijnands et al. 1997b). Furthermore, they detected kHz QPOs (both ν1 and ν2) that occupy the different locations in HID parameterized by the Sz values, and found a frequency evolution of QPOs along the Z track. We obtain the measured Sz and ν2 values of GX 17+2 from Homan et al. (2002), which share the corresponding ranges of ∼−0.32–1.76 and ∼618–1087 Hz, respectively. For clarity, Figure 1 also indicates the positions corresponding to the HB/NB and NB/FB vertexes with Sz ∼ 1 and Sz ∼ 2, respectively.
2.4. Cross-correlation Function
In this study, the cross-correlation technique is adopted to probe the radiation transfer process between the low- and high-energy X-rays of GX 17+2, which is carried out by the tool "crosscor" in the XRONOS package. Based on the algorithm of Fourier transform, the command "crosscor" calculates the cross-correlation coefficient (CCC) and time lag between the two light curves, which are detected simultaneously in the different energy bands. Moreover, the obtained CCC is finally normalized to the square root of the light curve good new bin numbers. It is noticed that the positive CCC represents the positive correlation between the two light curves, while the negative CCC may correspond to the negative correlation or anti-correlation.
3. Results
Based on the results combining the evolutions of the kHz QPO emission radii, X-ray intensities and CCFs of GX 17+2 with the Z track, we attempt to explore the magnetosphere-disk structure, as well as the X-ray radiation transfer process of this source.
3.1. Evolution of the kHz QPO Emission Radii
We employ the detected kHz QPOs of GX 17+2 with Sz parameterization by Homan et al. (2002) to probe the evolution relation of the magnetosphere-disk radii with the Z track. As it is found in all kHz QPO sources that the detected ν2 values in twin kHz QPOs are always higher than the corresponding NS spin frequency–νs, i.e., ν2 > νs, which is compatible with the suggestion that the upper kHz QPO frequency is likely to relate to the Keplerian orbital frequency in the inner accretion disk if assuming that the kHz QPOs originate from the NS spin-up state (Wang et al. 2018). Therefore, the frequency of upper kHz QPO–ν2 in the following study is assumed to be equal to that of the Keplerian orbital motion–νK:
in which M and r represent the NS mass as well as kHz QPO emission radius (i.e., inner accretion disk radius or magnetosphere-disk radius), respectively. According to Equation (1), the emission radius–r shares the expression as:

Based on the above equation and average NS mass (i.e., M ∼ 1.6 M⊙, see Zhang et al. 2011 and Özel & Freire 2016 for the statistics of the measured NS masses of the millisecond pulsars), we calculate the kHz QPO emission radii of GX 17+2 with the ν2 values detected by Homan et al. (2002). Meanwhile, Figure 2(a) displays the cumulative distribution function (CDF) curve for the inferred r values, where the corresponding Sz values are also indicated. It can be seen that the source shows the monotonically decreasing r values and monotonically increasing Sz values from HB to NB, and, in particular, HB/NB share the radii ranges of r ∼ 18.1–24.1 km/r ∼ 16.6–18.1 km, respectively. In addition, Figures 2(b) and (c) also show the quality factors of kHz QPOs (lower Q1 and upper Q2) evolving with the Sz parameters, as well as with the inferred kHz QPO emission radii, from which it can be seen that in HB both Q1 and Q2 increase with the decreased kHz QPO emission radii and in NB with r ∼ 16–17 km, the quality factors of the upper kHz QPOs exhibit a drop trend.
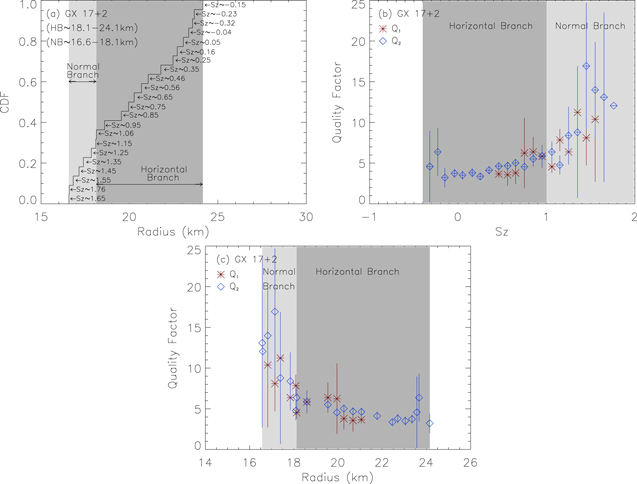
Figure 2. (a) The CDF curve of kHz QPO emission radii in GX 17+2, where the corresponding Sz values are also indicated (see Section 2.3 and Figure 1 for the definition of Sz). (b) The quality factors of the lower-(Q1) and upper-kHz QPO (Q2) evolve with the Sz parameters. (c) The quality factors of the lower-(Q1) and upper-kHz QPO (Q2) evolve with the inferred kHz QPO emission radius. The shaded areas in the figures show the ranges representing HB and NB.
Download figure:
Standard image High-resolution imageMoreover, according to the theory of the accreting NS, the disk accretion rate– is anti-correlated with the magnetosphere-disk radius–Rm (i.e., the inner disk radius–r, see Shapiro & Teukolsky 1983; Frank et al. 2002),
  . Therefore, the shrinking of the disk radius along HB to NB may imply an increase in the disk accretion rate, the result of which is consistent with the suggestion by Hasinger et al. (1990).
3.2. Evolution of the X-ray Intensities
We try to further study the X-ray intensity evolution of GX 17+2 in various energy bands along the Z track. First, we separate the Z track in Figure 3 into intervals by the boxes marked with the number from 1 to 33 (see Figure 3). Then, for the data points in each box, we calculate the corresponding average X-ray intensity–〈I〉 in the energy bands of 2–3.5 keV, 3.5–5.0 keV, 5.0–6.5 keV, 6.5–8.0 keV, 8.0–9.7 keV, 9.7–16 keV and 16–30 keV, respectively. It is noticed that the above X-ray intensities in a certain energy band are corrected for the gain change by the Crab Nebula, like those in Section 2.2. Figure 4 show the evolution of 〈I〉 values in the different energy bands with the box numbers, where the areas representing HB, NB and FB are also indicated. It can be seen that along the Z track, the 〈I〉 values in HB show an increasing trend below ∼10 keV and a decreasing trend above ∼10 keV. On the contrary, NB shows the monotonically decreasing 〈I〉 values in all ∼2–30 keV, while FB shows the monotonically increasing 〈I〉 values in all ∼2–30 keV.

Figure 3. The HID of GX 17+2, where the labeled boxes are used to select the data points to estimate the average X-ray intensity in the different sites of the track.
Download figure:
Standard image High-resolution image
Figure 4. The evolution relations of the average X-ray intensities of GX 17+2 in various of energy bands with the Z track, where the box numbers are defined as those in Figure 3. The positions corresponding to HB, NB and FB are distinguished by the shaded areas.
Download figure:
Standard image High-resolution image3.3. Evolution of the Cross-correlations
The opposite evolution trends of 〈I〉 values below and above ∼10 keV along the HB of GX 17+2 (see Figure 4) imply a possible X-ray radiation transfer process, and we try to adopt the cross-correlation analysis to check this speculation. Following the work by Lei et al. (2008), we gain the light curves (background-subtracted Standard 2 mode with 16 s bin size) in 2–5 keV and in 16–30 keV from the data in Table 1, and then calculate the cross-correlation function between these two light curves with command "crosscor". Moreover, if a light curve in an individual observation is separated into several segments by the gaps, then the cross-correlation analysis is carried out in each segment.
The cross-correlation results are classified as the positive correlation (88 segments), negative correlation (35 segments), and ambiguous correlation (irregular shape of CCF, 48 segments), as listed in Table 2. For clarity, Figure 5 shows the examples of the light curves as well as the corresponding cross-correlation functions of the three types of correlations. In addition, Figure 6 shows the histogram of segments with the positive and negative cross-correlation coefficients, based on which we define the high level correlation as CCC ≥ 0.3 (78 segments) or CCC ≤ −0.3 (21 segments). Moreover, we find that the high level negative correlations are distributed around HB and HB/NB vertex, while the high level positive correlations are mainly distributed in NB and FB.
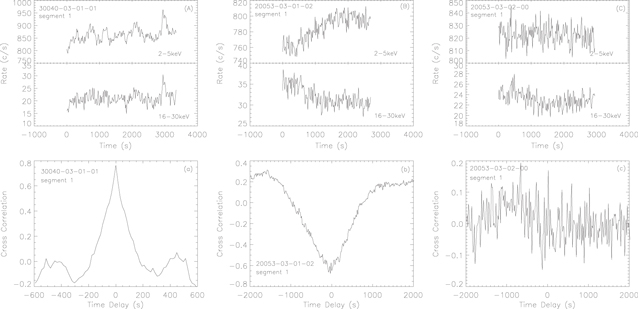
Figure 5. (A)–(C) The examples of the light curves in 2–5 keV, as well as in 16–30 keV (16 s bin size and background-subtracted) showing the positive correlation, negative correlation, and ambiguous correlation, respectively. (a)–(c) The corresponding cross-correlation functions between the two light curves as shown in (A)–(C), respectively.
Download figure:
Standard image High-resolution image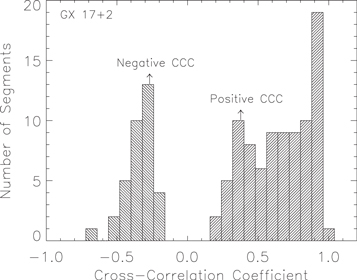
Figure 6. The histogram of segments with the positive and negative cross-correlation coefficients.
Download figure:
Standard image High-resolution imageTable 2. Statistics of the Cross-correlations of GX 17+2
| ObsIDs | Segments | Positive | Negative | Ambiguous | High Level | High Level |
|---|---|---|---|---|---|---|
| Correlation | Correlation | Correlation | Positive Correlation a | Negative Correlation b | ||
| 91 | 171 | 88 | 35 | 48 | 78 | 21 |
Notes.
a The high level positive correlation is defined as CCC ≥ 0.3. b The high level negative correlation is defined as CCC ≤ −0.3.Download table as: ASCIITypeset image
We have detected the time lags between the soft/hard (2–5 keV/16–30 keV) X-rays in the data sets with the positive/negative CCCs. Then, we fit the peak of the cross-correlation function with a Gaussian function to measure the corresponding CCC and time lag. Table 3 lists the statistics of the detected time lags, which shares the timescale spanning from tens to hundreds of seconds.
Table 3. Log of Observations Showing the Time Lags a
| ObsIDs | Date | CCC | Time Lag |
|---|---|---|---|
| (s) | |||
| Positive Correlation | |||
| 30040-03-01-02 Seg.2 | 1998-08-07 | 0.36 ± 0.02 | −105 ± 12 |
| 30040-03-01-02 Seg.5 | 1998-08-07 | 0.58 ± 0.06 | 45 ± 19 |
| 30040-03-02-02 | 1998-11-18 | 0.38 ± 0.03 | −26 ± 15 |
| 40018-01-01-19 | 1999-10-09 | 0.32 ± 0.04 | −33 ± 16 |
| Negative Correlation | |||
| 20053-03-01-00 Seg.2 | 1997-07-27 | −0.42 ± 0.02 | 209 ± 20 |
| 20053-03-01-01 Seg.1 | 1997-07-27 | −0.26 ± 0.04 | −219 ± 44 |
| 20053-03-01-02 Seg.1 | 1997-07-27 | −0.62 ± 0.01 | −69 ± 10 |
| 20053-03-01-02 Seg.2 | 1997-07-27 | −0.38 ± 0.01 | −91 ± 18 |
| 20053-03-03-01 Seg.1 | 1997-04-02 | −0.40 ± 0.01 | −201 ± 16 |
| 20053-03-03-01 Seg.3 | 1997-04-02 | −0.29 ± 0.02 | 46 ± 27 |
| 40018-01-02-03 Seg.1 | 1999-10-05 | −0.36 ± 0.01 | 38 ± 18 |
Note.
a The CCC and time lag are obtained by fitting the peak of CCF using a Gaussian function.Download table as: ASCIITypeset image
4. Discussions and Conclusions
We studied the influence of the magnetosphere-disk relation on the X-ray radiation process of GX 17+2 by analyzing the evolutions of the kHz QPO emission radii, X-ray intensities and CCFs along the Z track of the source in HID.
- 1.As GX 17+2 evolves along the HB, its magnetosphere-disk radii (r) inferred by kHz QPOs shrink from r ∼ 24 km to r ∼ 18 km (see Figure 2), meanwhile, its average X-ray intensities (〈I〉) in ≤10 keV show an increasing trend and those in ≥10 keV show a decreasing trend (see Figure 4). In addition, this branch has also been detected with the anti-correlations, as well as the anti-correlated time lags (see Table 3), between the low-/high-energy (e.g., 2–5 keV/16–30 keV) X-rays. These phenomena imply that in HB the magnetosphere-disk radius evolution drives the X-ray radiation mechanism, i.e., the increase of the disk accretion rate causes the shrink of the magnetosphere-disk radii, resulting in a radiation transfer process and exhibiting the opposite evolutional trends of the low-/high-energy X-ray intensities along HB. Moreover, considering that an NS shares a radius around R ∼ 10–15 km in theory (Miller & Miller 2015), we propose that this kind of radiation transfer process may correspond to the accretion disks with the inner radii ∼5–10 km far from the NS surface. Furthermore, as the source evolves along the NB, its magnetosphere-disk radii inferred by kHz QPOs shrink from r ∼ 18 km to r ∼ 16 km (see Figure 2), meanwhile, its 〈I〉 values in all ∼2–30 keV show a monotonously decreasing trend (see Figure 4). In addition, this branch is dominated by the positive correlations between the low-/high-energy (e.g., 2–5 keV/16–30 keV) X-rays. As for FB, its branch evolution is accompanied by the monotonously increase of 〈I〉 values in all ∼2–30 keV (see Figure 4), and this branch is mainly distributed with the positive correlations between the low-/high-energy (e.g., 2–5 keV/16–30 keV) X-rays. Therefore, we suggest that in NB and FB the source presents the radiation process obviously different from those in HB, while as in NB the corresponding X-ray radiation of the source may be affected by the physical process around NS surface. In fact, as the accretion disk moves inward, it will stop around the NS surface, where the piled up plasma in the strong gravitational field and strong magnetic field region (r ∼ 16–18 km) will affect the X-ray radiation in NB (Wang et al. 2020). The radiation transfer scenario based on the CCF analysis may relate to some possible physical processes. First, according to the decrease of the detected radio emission in GX 17+2 from HB to FB (Penninx et al. 1988), Migliari & Fender (2006) proposed a disk-jet coupling model and suggested when in HB the source produces a core compact jet with the optical thick radio emission, then as the source enters NB, the compact jet is disrupted and exhibits a transient jet and optically thin radio flare, when in FB, the ejection activity is even suppressed. Second, Lin et al. (2012) suggested that the evolution from the top to bottom of HB in this source is due to the decreasing portion of the thermal disk emission Compton scattered by the corona, while in NB and FB the corona shows the less influence on the radiation. Then, the X-ray radiation in HB may relate to the interaction between the inner accretion disk (soft X-rays dominated) and the corona or jet/outflow (hard X-rays dominated), exhibiting the radiation transfer process. Moreover, Lin et al. (2012) also suggest that the component of the disk blackbody in the energy spectra of GX 17+2 shares the upper limit around ∼10 keV, while the Comptonized component dominates the spectra in >5 keV and becomes weak on NB/FB. Therefore, we suggest that the pivoting energy around ∼10 keV in Figure 4 may result from the energy spectral component variation of the disk blackbody and coronal emissions, particularly the changes in the emission mechanism of the power-law component (Lin et al. 2012; Sriram et al. 2019), since both the disk and Comptonization region contribute to the ∼10 keV X-ray emission. Furthermore, it is suggested that the corona or jet exhibits the strong physical influence in HB, however, these two processes become weak in NB (Migliari & Fender 2006; Lin et al. 2012). Then, the corona or jet may be formed during HB with the inner disk radius of r ∼ 18–24 km. While, in NB with r ∼ 16–18 km, the corona or jet is suppressed, which may be due to the influence of the increased disk accretion rate or hard NS surface. In fact, Fender et al. (2004) suggested that the increased accretion rate causes the accretion disk propagate inward, when the inner edge of the accretion disk moves through the last few gravitational radii of the compact object, the jet velocity rises sharply and results in a suppression of the jet.
- 2.Figure 7 exhibits the diagram of the relative positions between the NS surface and magnetosphere-disk radii of GX 17+2, from which we try to interpret its temporal and spectral properties: First, from the top to bottom of HB, the disk accretion rate–
 increases, which results in the increase of disk temperature as well as the soft X-rays intensity from the accretion disk (≤10 keV). Meanwhile, according to the relation , the increase of also cause the shrink of the inner disk radius from r ∼ 24 km to r ∼ 18 km. As it is generally suggested that the hard X-rays (≥10 keV) is originated from the soft X-rays in the accretion disk Comptonized by the corona or jet/outflow. Then, the increased soft X-ray intensity in the accretion disk can cooling the corona or jet/outflow, which reduces the Comptonization efficiency, and further reduces the hard X-rays along HB. As a result, the source manifests the opposite evolutional trends of the average X-ray intensities below and above ∼10 keV along HB, meanwhile, the source also shows the anti-correlations between the low-/high-energy X-rays. Second, as the disk accretion rate further increases, the inner disk radius decreases from r ∼ 18 km to r ∼ 16 km, then the accretion disk moves further inward around the NS surface, another mechanism dominates the X-ray radiation process and produces both the low- and high-energy X-rays simultaneously. This mechanism may be related to the radiation process around the NS surface which is quite different from that in HB. In fact, when the accretion disk moves inward around the NS, it will stop at the NS surface, where the piled up accretion matter under the extreme gravitational and magnetic environment may trigger some kind of X-ray radiation activity producing both the low- and high-energy X-rays. As a result, the source traces out NB and manifests the monotonously decreasing trend of the average X-ray intensities in all ∼2–30 keV along this branch, meanwhile, the source also shows the positive correlations between the low-/high-energy X-rays. As for FB, it shows the monotonously increasing trend of the average X-ray intensities in all ∼2–30 keV along this branch, and the positive correlations between the low-/high-energy X-rays. However, there is no kHz QPO detected in FB, i.e., no inferred magnetosphere-disk radius. Considering the frequencies of kHz QPOs show an increasing trend along the Z track of this source, so if assuming that FB share the higher kHz QPO frequencies than NB, then it can infer that the FB may share the magnetosphere-disk radii even closer to the NS surface than NB. In summary, we suggest that the magnetosphere-disk structure may affect the X-ray radiation process and the formation of the branches of GX 17+2.
 - 3.Lin et al. (2012) analyzed the spectral features of GX 17+2, and assumed the disk accretion rate is proportional to the total disk luminosity, where the total disk luminosity includes the thermal disk emission (the disk blackbody component) and the thermal disk emission prior to Compton scattering (the power law component). Then, the authors argued that the disk accretion rate of the source is almost constant in all the branches, and the formations of the three branches in the Z track correspond to three physical processes. However, it is noticed that the results in Lin et al. (2012) are based on the spectral analysis, and the scenario of the constant mass accretion rate is primarily used to explain the thermal evolution of the accretion disk, which do not explain the influence of the disk accretion rate on the kHz QPO evolution. In this study, according to the relation, we prefer to suggest that the decrease of the kHz QPO emission radii from HB to NB in GX 17+2 may imply an increase of the disk accretion rate along the Z track, and the disk luminosity–Ld inferred by the spectral analysis may not reflect the fact disk accretion rate–. In fact, the increase of the accretion rate can thicken the accretion disk due to the increased radiation pressure and format an approximate spherical accretion around NS, which may share a different radiation component and reduce the observed disk luminosity. Moreover, the accretion matter may escape from the system through the jet/outflow and cannot transfer into the observed disk luminosity. Then, these influence may cause Ld to relate to in a nonlinear form as , where α ≤ 1 and decreases with . As a result, the increase of the disk accretion rate can drive the shrink of the inner disk radii, however, it may not cause the obviously increase of the observed disk luminosity. However, the total accretion rate of the source, which includes the disk accretion rate and non-disk accretion rate, may be almost constant in all the branches of the Z track since its luminosity is near the Eddington limit.
- 4.It should be noticed the temporal and spectral behaviors of GX 17+2 shown in this work are not the particular phenomena, but the common properties of Z sources. First, the detected frequency evolutions of kHz QPOs along the tracks in HID have been reported in other Z sources like Cyg X-2 (Wijnands et al. 1998a), GX 5-1 (Wijnands et al. 1998b; Jonker et al. 2002), GX 17+2 (Wijnands et al. 1997a; Homan et al. 2002; Lin et al. 2012), as well as Sco X-1 (van der Klis et al. 1996), based on which the inferred magnetosphere-disk radii are found to decrease monotonously from ∼30 km to ∼16 km along the Z track evolutions. Meanwhile, the NBs of all these sources share the inferred magnetosphere-disk radii by kHz QPOs clustering around r ∼ 16–20 km (Wang et al. 2020), i.e., near the NS surface. Second, the cross-correlation analysis have also been carried out in the Z sources of Cyg X-2 (Lei et al. 2008), GX 5-1 (Sriram et al. 2012), XTE J1701-462 (Wang et al. 2014), as well as GX 17+2 (Sriram et al. 2019; Malu et al. 2020; Sriram et al. 2021), where the anti-correlations between the low-/high-energy (2–5 keV/16–30 keV) X-rays with time lags are found to distribute in HBs and upper NBs (e.g., Lei et al. 2008). Moreover, these sources are all found to exhibit the obvious profile variations of the energy spectra around ∼10 keV in the observations with the anti-correlations. Therefore, we suggest that the formation of the tracks of Z sources in HIDs may relate to the magnetosphere-disk structure evolution, which is also affected by the X-ray radiation mechanism and radiation transfer process.


Figure 7. The diagram that shows the relative positions between the NS surface and magnetosphere-disk radii of GX 17+2. The inner radii of the accretion disk are inferred by kHz QPOs, which show a decrease trend with the increased Sz values from −0.32 to 1.76 (see Section 2.3 and Figure 1 for the definition of Sz). The marked areas label the inner radius ranges of HB (r ∼ 18.1–24.1 km), as well as NB (r ∼ 16.6–18.1 km). The positions with the positive and negative correlations between the low-/high-energy (i.e., 2–5 keV/16–30 keV) X-rays are also indicated.
Download figure:
Standard image High-resolution image
Acknowledgments
This work is supported by the National Natural Science Foundation of China (Grant Nos. 12163001, U1938117 and U1731238), the Guizhou Provincial Science and Technology Foundation (Grant No. [2020]1Y016).