
Abstract
The effects of Nd doping on the microstructures and magnetic properties of Sm1–xNdx (Co0.695Fe0.2Cu0.08Zr0.025)7.2 (x = 0, 0.3, 0.5, 0.7, 1.0) permanent magnets are studied. The scanning electron microscope (SEM) analysis of the solid solution states of the magnets shows that with the increase of Nd content, the distribution of elements becomes inhomogeneous and miscellaneous phase will be generated. Positive temperature coefficient of coercivity (β) appears in each of the samples with x = 0.3, 0.5, and 0.7. The corresponding positive β temperatures are in ranges of about 70 K–170 K, 60 K–260 K, 182 K–490 K for the samples with x = 0.3, 0.5, and 0.7, respectively. Thermomagnetic analysis shows that spin-reorientation-transition (SRT) of the cell boundary phase is responsible for this phenomenon. On the basis of this discovery, the Sm0.7Nd0.3 (Co0.695Fe0.2Cu0.08Zr0.025)7.2 magnet possessing thermal stability with β ≈ –0.002 %/K at the temperature in a range of 150 K–200 K is obtained.
Export citation and abstract BibTeX RIS
1. Introduction
The 2:17 SmCo permanent magnets are well known to have outstanding magnetic properties such as a high coercivity of above 2.0 T and a high maximum energy product of up to 266 kJ/m3.[1–4] Owing to their high Curie temperatures and thermal stabilities, they are regarded as the most promising candidates for high temperature applications and precise instruments such as sensors, actuators, and accelerometers.[5,6] The remanence of Sm2Co17 magnet mainly arises from Sm2(Co, Fe)17 cell interiors and Sm(Co, Cu)5 cell boundaries, creating strong pinning coercivity on the domain walls.[7] In the application of magnets, the temperature coefficient of the remanence (α) has been the focus of research because the remanence directly affects the strength of the air-gap field. The temperature dependence of remanence can be regulated by alloying techniques, in which Sm is partially substituted by heavy rare earth element Gd.[8,9] Recent studies have found that the temperature coefficient of coercivity (β) can affect the irreversible magnetic flux loss and long-term time stability of magnets.[10,11] Much effort has been made to improve their coercivity thermal stabilities by adjusting the Cu content in the cell boundary phase.[12–15] With spin-reorientation-transition (SRT) phenomenon of the cell boundary phase, an extreme low β magnet was obtained by Sm partially substituted with heavy rare earth element Dy.[11,16,17] The Nd element also has the characteristic of inducing SRT phenomenon in NdCo5 alloy,[18–20] which is a typical hexagonal CaCu5-type structure acting as the cell boundary phase in Sm2Co17 magnet. Besides, Nd is a light rare earth element, its orbital moment is antiparallel to the spin moment, leading to ferromagnetic coupling with Co,[21–23] which is different from heavy rare earth elements reducing the energy product.[24–26] By doping Nd, β is expected to be controlled within a certain temperature range while the temperature coefficient of remanence (α) is expected to remain basically unchanged.[27]
In this work, the 2:17 SmCo permanent magnets with low β are prepared by doping Nd element. The effects of Nd doping on microstructure and magnetic properties of magnets are investigated systematically.
2. Experiment
Five Sm1–x Ndx (Co0.695Fe0.2Cu0.08Zr0.025)7.2 (x = 0, 0.3, 0.5, 0.7, 1.0) magnets were prepared by the powder mixing method. Sm (Co0.695Fe0.2Cu0.08Zr0.025)7.2 and Nd (Co0.695Fe0.2Cu0.08Zr0.025)7.2 alloys were separately prepared by induction melting under argon atmosphere. The ingots were crashed into powders with a mean particle size of 3 μm–5 μm by ball milling process. The as-prepared Sm and Nd powders were mixed in different proportions in a mixing machine for 180 min. Fine powders were aligned and pressed in a magnet field up to 3 T and further compacted under 150 MPa by cold isostatic pressing. The green compacts were sintered at 1494 K for 0.5 h and later homogenized at 1463 K for 3 h, then quenched to room temperature to obtain a solid solution magnet. The magnets were aged at 1103 K for 12 h, followed by cooling down to 673 K with a cooling rate of 0.7 K/min and kept for 3 h, finally cooled down to room temperature.
Phase structures were characterized by x-ray diffraction (XRD) with Cu Kα radiation. Microstructures and compositions of the experimental magnets were obtained by a scanning electron microscope (SEM) equipped with an energy-dispersive spectroscope (EDS) analysis system. The detailed microstructure was investigated by Tecnai F20 transmission electron microscope (TEM). Magnetic properties and the spin reorientation transitions were tested by a Quantum Design SQUID-VSM and a physical property measurement system (PPMS). The dimension of the sample is 1 mm × 1 mm × 3 mm, and the demagnetization factor correction has also been added to the calculation of the demagnetization curve.
3. Results and discussion
The XRD patterns of the powders of as-solution-treated samples are measured, and the results are shown in Fig. 1(a). Almost all diffraction peaks are indexed as the 1:7H phase with a TbCu7 structure. For the samples with x = 0.5, 0.7, and 1.0, weak (204)-2:17R and (203)-2:17H reflections are detected, indicating a minority 2:17R/2:17H phase coexists with the majority 1:7H phase. The phase compositions of aged samples are shown in Fig. 1(b). The diffraction peaks from 2:17H are detected in the x = 0.5, 0.7, and 1.0 samples, indicating that the major phases of the aged samples can be identified as 2:17R, coexisting with the minor 2:17H phase in those samples. The XRD patterns of cubic oriented magnets are shown in Fig. 1(c). For the sample with x = 0, the intensity of (006) is strong while other diffraction peaks are almost undetectable, meaning that the orientation direction of the magnet is [001], i.e., easy axis (EA). For sample with x = 1.0, (006) peak is very weak as (300) peak and (220) peak are detected. These two peaks suggest that the easy magnetization direction of sample with x = 1.0 is in the plane perpendicular to [001] direction, i.e., easy plane (EP). The relative intensity value of I(006)/I(220) of aged cubic sample with x = 0.3, 0.5, 0.7, and 1.0, are 10.63, 9.44, 5.44, and 0.14, respectively. Therefore, as x increases, the degree of orientation of the magnet becomes worse.
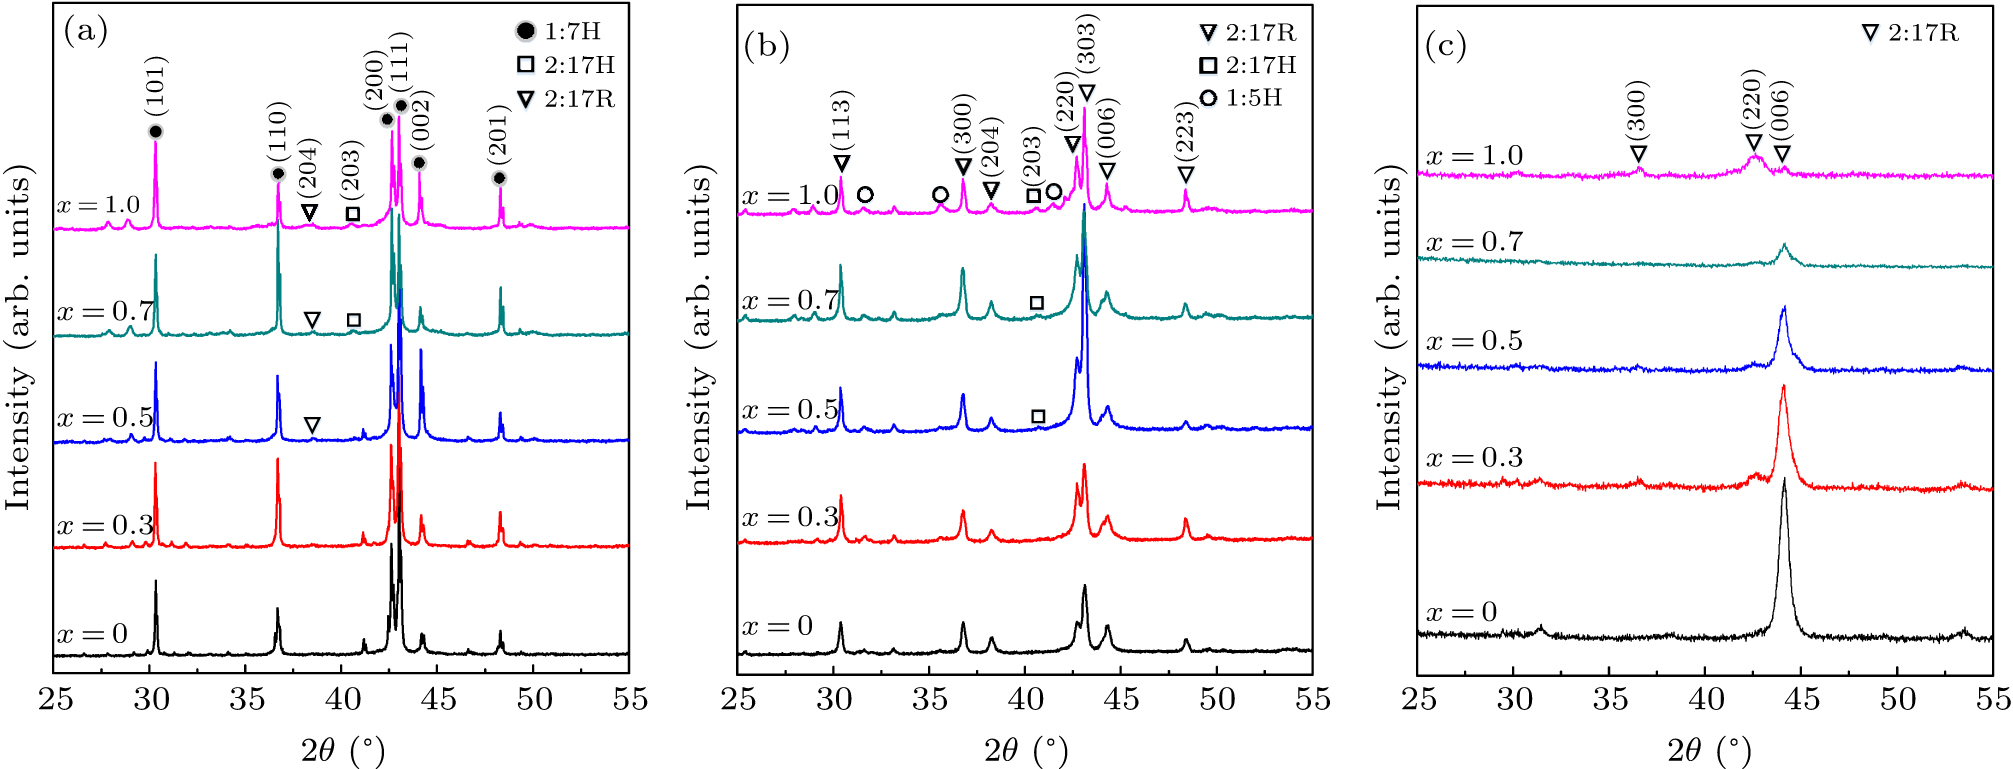
Fig. 1. XRD patterns of powders of (a) as-solution-treated samples, (b) aged samples of Sm1–x Ndx (Co0.695Fe0.2Cu0.08Zr0.025)7.2 magnets, and (c) cubic samples of aged Sm1–x Ndx (Co0.695Fe0.2Cu0.08Zr0.025)7.2 magnets.
Download figure:
Standard imageFigures 2(a)–2(e) show the back-scattered SEM images of samples with various Nd content, which are solution treated. According to the difference in distinct contrast, three types of regions can be distinguished. The dark phase, the dark gray phase, and the light gray phase are marked by +1, +2, and +3 in Figs. 2(a)–2(e), respectively. The white phases, observed in all samples, are rare earth element oxides according to the composition analysis through EDS, which are formed inevitably during ball milling and sintering. The 1 μm–4 μm-sized particle illustrated by the green circle is of the CoFeZr-rich phase.[28] The EDS point detections within different regions of five samples are implemented and summarized in Table 1. On average, the +1 phases contain less content of rare earth element (RE) and Cu element, but more content of Fe element and Co element, while the +2 phases contain more content of RE element and Cu element, but less content of Fe element and Co element. The difference in element content between the dark phase and grey phasefor each of five samples are shown in Fig. 2(f). The differences in RE, Fe, and Co contents in the two phases tend to be larger with the Nd content increasing. Element segregation at the solution-treated stage will lead to inhomogeneous cellular nanostructure after aging process.[29] Moreover, phase +3 emerges in the samples with x = 0.7 and x = 1.0. Phase +3 has the highest content of RE element and Cu element, but much lower content of Co and Fe element than +1 phase and +2 phase as shown in Fig. 3. According to the literature,[30] phase +3 will not evolve into cellular structure after aging process.
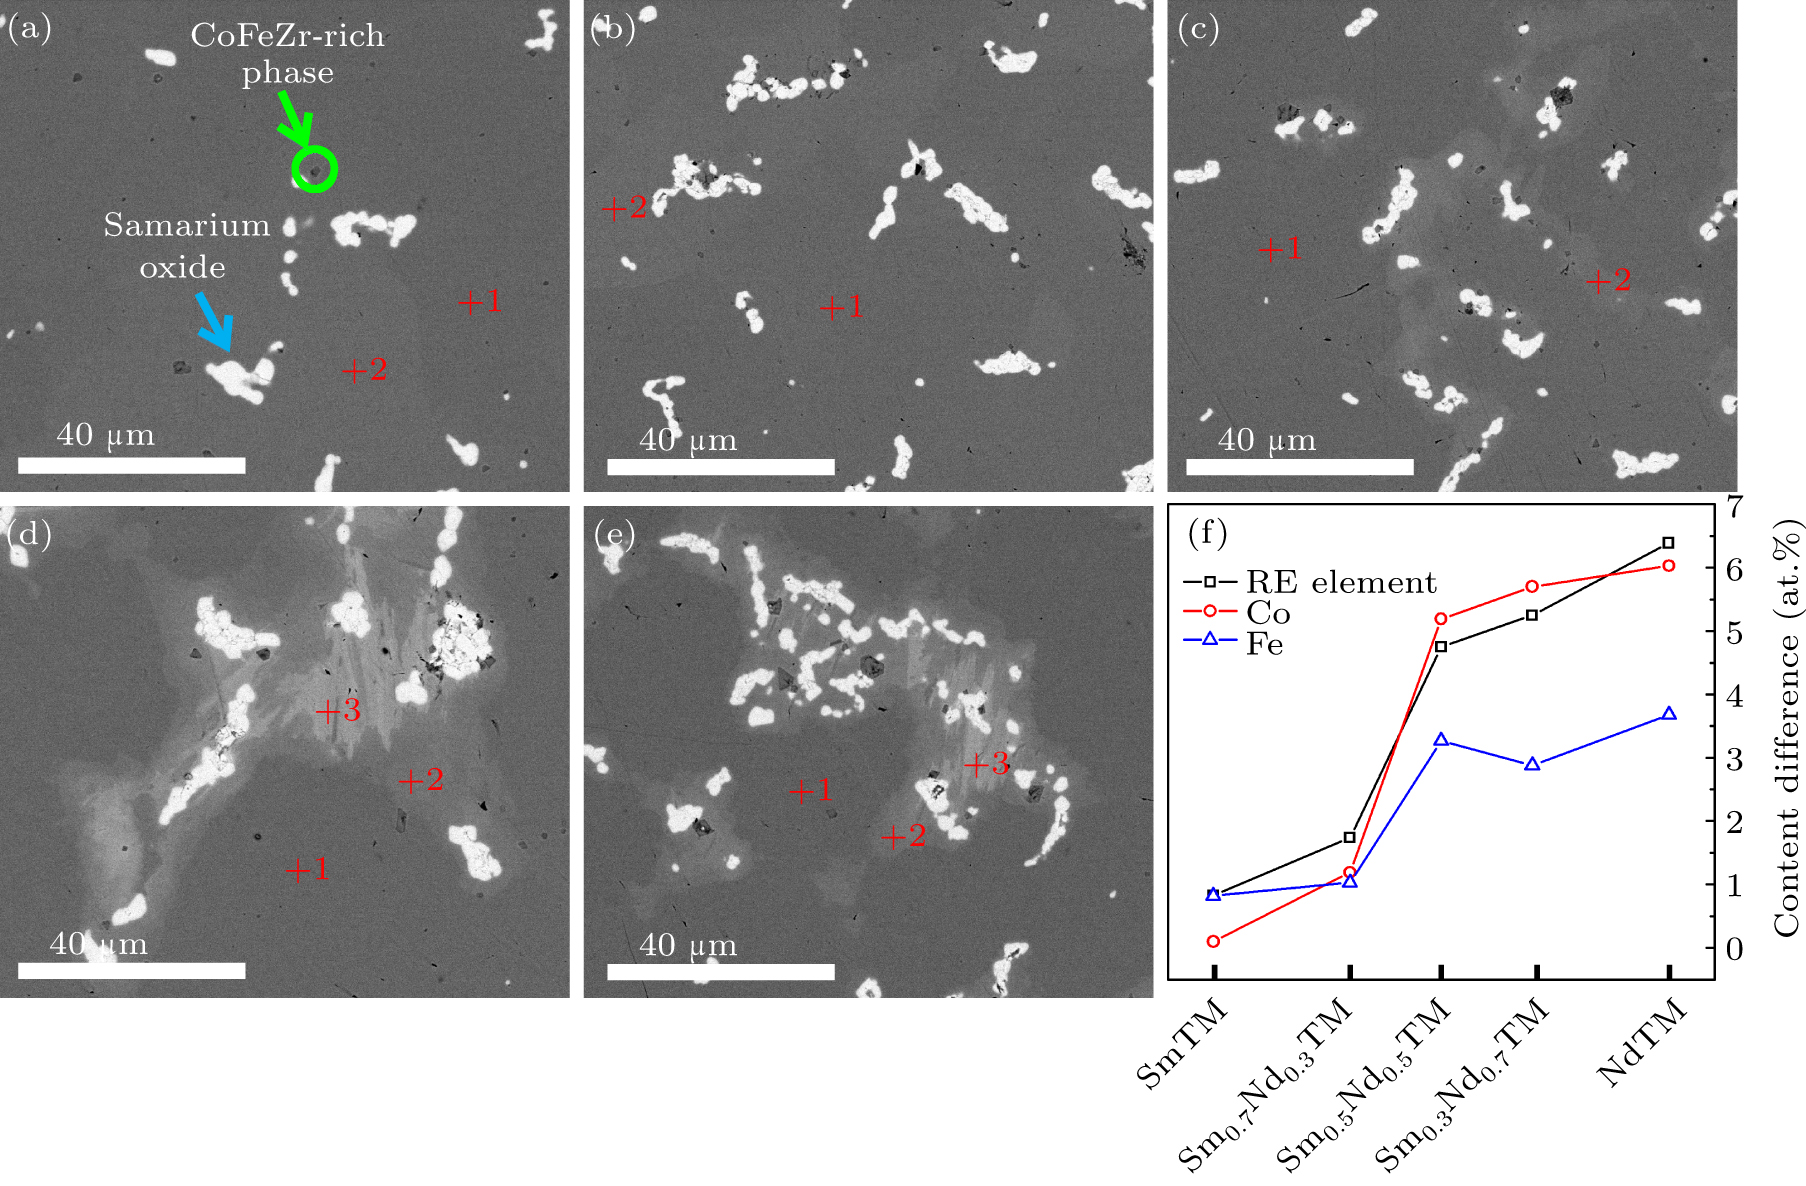
Fig. 2. Back-scattered SEM images of as-solution-treated Sm1–x Ndx (Co0.695Fe0.2Cu0.08Zr0.025)7.2 magnets with various Nd contents: (a) x = 0, (b) x = 0.3, (c) x = 0.5, (d) x = 0.7, and (e) x = 1.0. (f) Variations of difference in content of rare earth elements (Sm + Nd), Co, Fe between +1 phase and +2 phase with Nd content in Sm1–x Ndx TM (TM = (Co0.695Fe0.2Cu0.08Zr0.025)7.2) magnets .
Download figure:
Standard image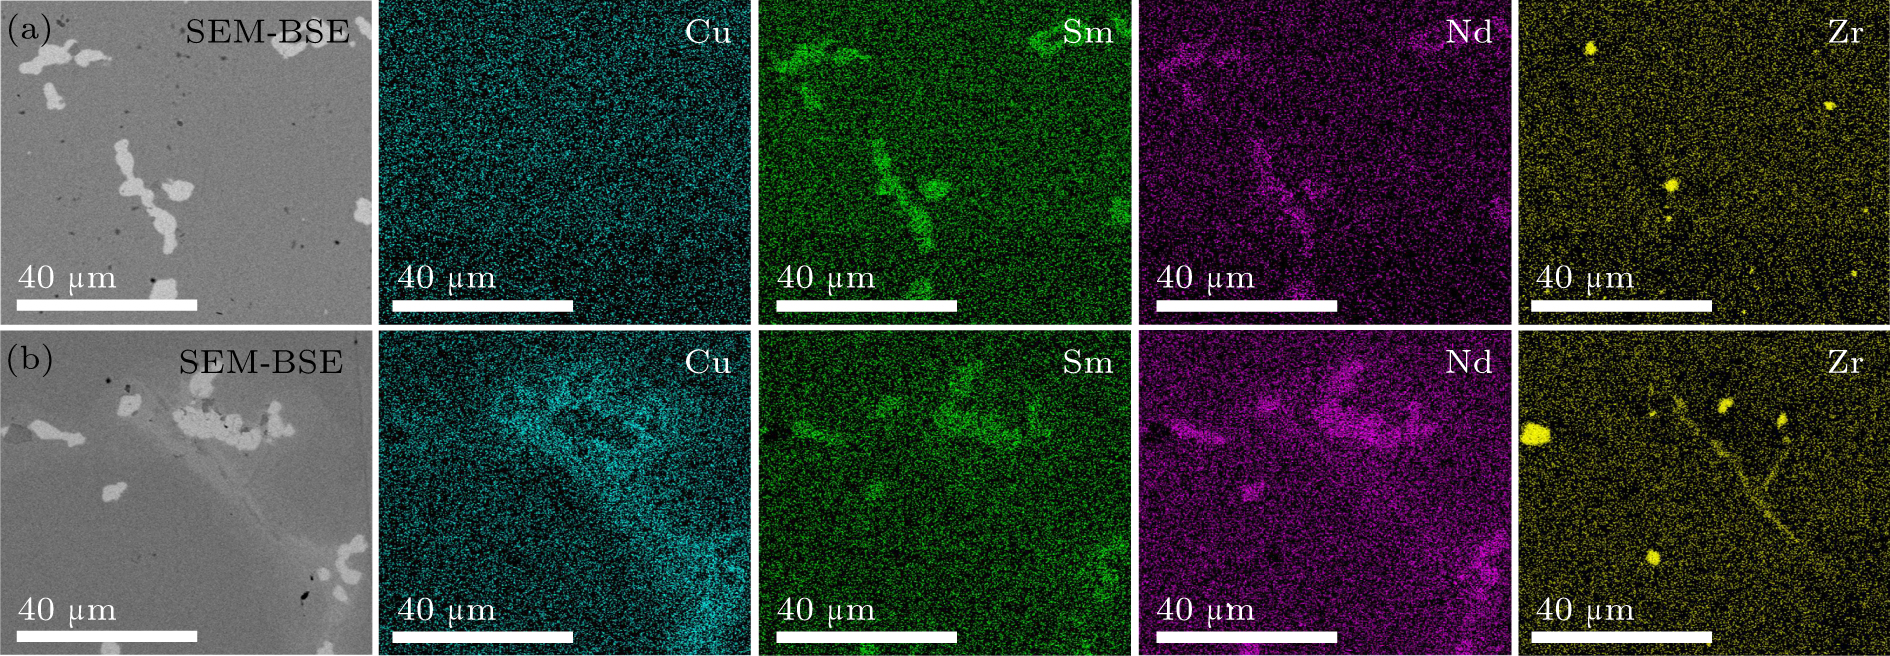
Fig. 3. Back-scattered SEM images of as-solution-treated Sm1–x Ndx (Co0.695Fe0.2Cu0.08Zr0.025)7.2 magnets and the corresponding mapping of Cu, Sm, Nd, Zr elements with Nd contents x = 0.3 (a) and x = 0.7 (b).
Download figure:
Standard imageTable 1. EDX measured element content in different positions in Fig. 2.
| Phase | x | Sm+Nd (wt.%) | Co (wt.%) | Fe (wt.%) | Cu (wt.%) | Zr (wt.%) |
|---|---|---|---|---|---|---|
| +1 | 0 | 23.87 | 51.41 | 14.72 | 6.51 | 2.73 |
| 0.3 | 23.28 | 52.34 | 14.81 | 6.49 | 2.48 | |
| 0.5 | 23.23 | 52.86 | 15.06 | 5.94 | 2.34 | |
| 0.7 | 22.36 | 53.8 | 15.32 | 5.51 | 2.39 | |
| 1.0 | 20.49 | 55.25 | 15.65 | 5.15 | 2.7 | |
| +2 | 0 | 24.7 | 51.31 | 13.9 | 6.93 | 2.55 |
| 0.3 | 25.02 | 51.15 | 13.78 | 6.86 | 2.54 | |
| 0.5 | 27.98 | 47.67 | 11.79 | 9.62 | 2.26 | |
| 0.7 | 27.61 | 48.1 | 12.44 | 8.6 | 2.62 | |
| 1.0 | 26.88 | 49.22 | 11.97 | 8.91 | 2.4 | |
| +3 | 0.7 | 38.05 | 35.93 | 7.25 | 17.01 | 1.05 |
| 1.0 | 37.45 | 39.11 | 7.23 | 14.56 | 0.98 |
Magnetocrystalline anisotropy field, Ha, significantly affects the coercivity.[31] To measure the values of Ha of Sm1–x Ndx (Co0.695Fe0.2Cu0.08Zr0.025)7.2 (x = 0, 0.3, 0.5) magnets, a Quantum Design SQUID-VSM is used to measure the initial magnetization curves of easy and hard magnetization direction of three aged samples. The abscissa of the intersection of the two curves is the value of the Ha. For samples x = 0 and 0.3, we extend the two curves and make them intersect at a point as shown in Figs. 4(a)–4(c). As Nd content increases from 0 to 0.5, the Ha decreases monotonically.
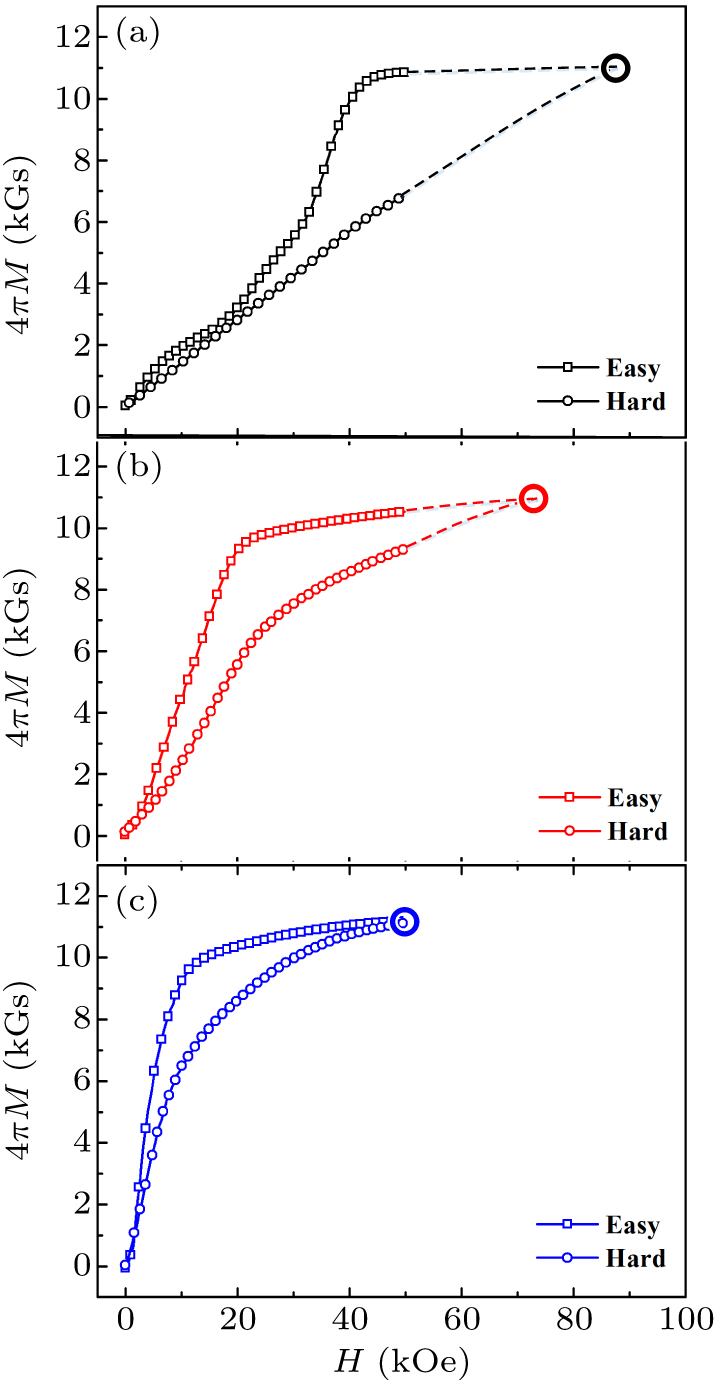
Fig. 4. Initial magnetization curves of easy and hard magnetization directions of aged samples with Nd contents x = 0 (a), 0.3 (b), and 0.5 (c).
Download figure:
Standard imageFigure 5(a) shows the cellular microstructure of the Sm0.7Nd0.3 (Co0.695Fe0.2Cu0.08Zr0.025)7.2 magnet, which is the same as that of the conventional magnet.[32] Figure 5(b) shows the demagnetization curves of the aged samples at room temperature, and the corresponding magnetic properties are listed in Table 2. During the test, the magnetic field strength increases from 0 Oe (1 Oe = 79.5775 A⋅m−1) to 5 × 10⁴ Oe, and then decreases from –5 × 10⁴ Oe, and data points are collected in steps of 500 Oe. The magnetic polarization (4πM (kGs), 1 Gs = 10−4 T) is calculated from the magnetization (M (emu⋅g−1)), then the flux density (B (kGs)) is obtained by summing magnetic polarization and magnetic field, the product of flux density and magnetic field is the yielded magnetic energy. The largest BH is selected as the maximum magnetic energy product, (BH)max, in the demagnetization curve part. When x increases from 0 to 0.3, the Hcj decreases from 34.22 kOe to 14.72 kOe. As the Nd content increases to 1.0, the sample has a weak magnetic property. Nd doping will lead to inhomogeneity in the solid solution state, which makes it more difficult to generate a perfect cell structure after aging process. At the same time, the Ha of the main phase of the magnet decreases. The above results suggest that the coercivity decreases rapidly as Nd content increases. Meanwhile, the decrease in the degree of orientation of the cube leads to a decrease in remanence. The combined effect of coercivity and remanence results in an immensely decrease in the magnetic energy product.
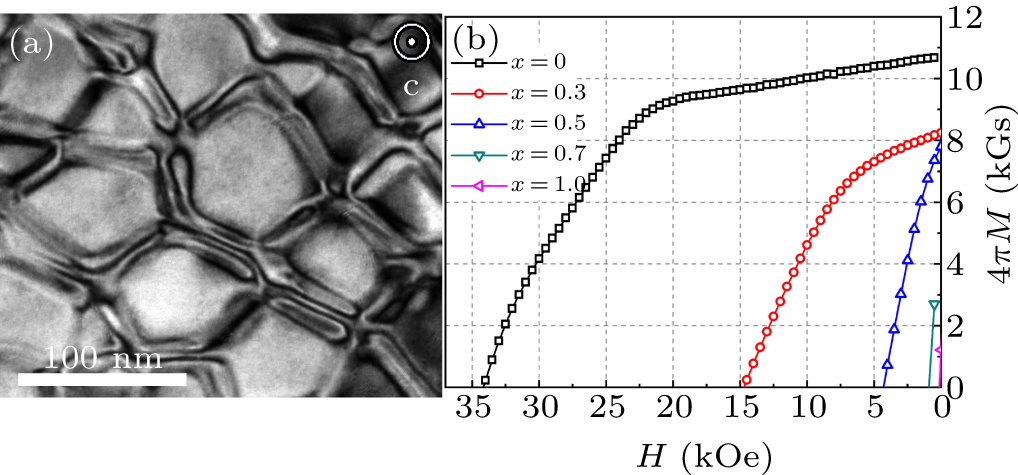
Fig. 5. (a) The TEM image of cellular microstructure of aged Sm0.7Nd0.3 (Co0.695Fe0.2Cu0.08Zr0.025)7.2 magnet. (b) Demagnetization curves of aged Sm1–x Ndx (Co0.695Fe0.2Cu0.08Zr0.025)7.2 (x = 0, 0.3, 0.5, 0.7, 1.0) magnets at room temperature.
Download figure:
Standard imageTable 2. The magnetic properties of aged Sm1–x Ndx (Co0.695Fe0.2Cu0.08Zr0.025)7.2 (x = 0, 0.3, 0.5, 0.7, 1.0) magnets at room temperature.
| x | Br (kGs) | Hcj (kOe) | (BH)max (MGOe) |
|---|---|---|---|
| 0 | 10.67 | 34.22 | 26.99 |
| 0.3 | 8.24 | 14.72 | 14.57 |
| 0.5 | 7.79 | 5.31 | 7.86 |
| 0.7 | 3.81 | 0.76 | 0.47 |
| 1 | 1.18 | 0.12 | – |
A typical magnetic characteristic, ac susceptibility χ', for each of Sm1–x
Ndx
(Co0.695Fe0.2Cu0.08Zr0.025)7.2 (x = 0, 0.3, 0.5, 0.7, 1.0) magnets is tested by using a PPMS. The parameters for the measurement include an external field of 5 Oe, a frequency of 1000 Hz and a temperature rise at a rate of 3 K per min in a range from 5 K to 320 K. The curve of the real part of χ' versus temperature is shown in Fig. 6(a). Note that there are sharp peaks in the χ'–T curves of samples with x = 0.5 and 0.7. The corresponding temperatures of these peaks are the SRT of the cell boundary phase (SRT-CBP) temperatures  of the magnet,[17] and their values are 60 K and 170 K, respectively. The easy magnetization direction of cell boundary phase is easy plane at a low temperature and turned into easy axis at high temperature[11,16,33] as illustrated in Fig. 6(b). The transition type of cell boundary is from easy plane to easy axis (EP → EA) as temperature increases. The χ'–T curve of the sample with x = 0.3 only has half a peak, indicating that the easy magnetization direction is easy cone at the starting temperature of the test. As temperature increases, the easy magnetization direction of cell boundary phase of sample with x = 0.3 turns into easy axis (EC → EA). There is no peak in the χ'–T curve of the sample with x = 0, meaning that there is no SRT-CBP.
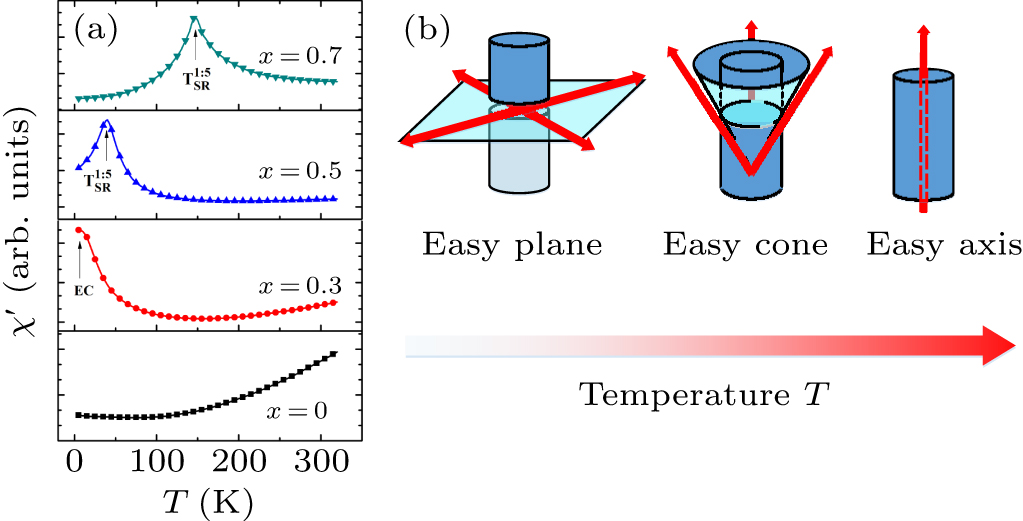
Fig. 6. (a) Temperature-dependent curves of real part of ac susceptibility, χ', of aged Sm1–x Ndx (Co0.695Fe0.2Cu0.08Zr0.025)7.2 (x = 0, 0.3, 0.5, 0.7) magnets. (b) Schematic diagram of spin-reorientation-transition transformation process of cell boundary phase with temperature increasing.
Download figure:
Standard imageThe coercivity temperature dependent Sm1–x Ndx (Co0.695Fe0.2Cu0.08Zr0.025)7.2 (x = 0, 0.3, 0.5, 0.7, 1.0) magnets are measured as shown in Fig. 7(a). The coercivity of the sample with x = 0 decreases monotonically with increasing temperature, same as traditional magnets, and the same is for the sample with x = 1.0.[34] Unlike the samples with x = 0 and 1.0, the samples with x = 0.3, 0.5, and 0.7 exhibit particular coercivity behaviors. Taking sample with x = 0.3 for example, a coercivity (corresponding temperature 5 K) decreases slowly to its local minimum coercivity (corresponding temperature T(Hlo-min)). Then, positive temperature coefficient of coercivity (β) phenomenon appears until the temperature reaches its local maximum coercivity (corresponding temperature T(Hlo-max)). When the temperature is higher than T(Hlo-max) and continues to rise, the coercivity decreases again. The temperature ranges with a positive β are about 70 K–170 K, 60 K–260 K, 182 K–490 K for the samples with x = 0.3, 0.5, and 0.7, respectively. It can be found that the values of T(Hlo-min) of samples with x = 0.5 and 0.7 are in good agreement with their SRT-CBP temperatures as shown in Table 3. However, the T(Hlo-min) is not matching in the sample with x = 0.3 because the SRT-CBP type of the cell boundary phase is EC → EA. The temperature ranges with a positive β expands from 100 K to 300 K, and the T(Hlo-max) point shifts from 170 K to 490 K as x increases from 0.3 to 0.7, and the results are shown in Fig. 7(b).
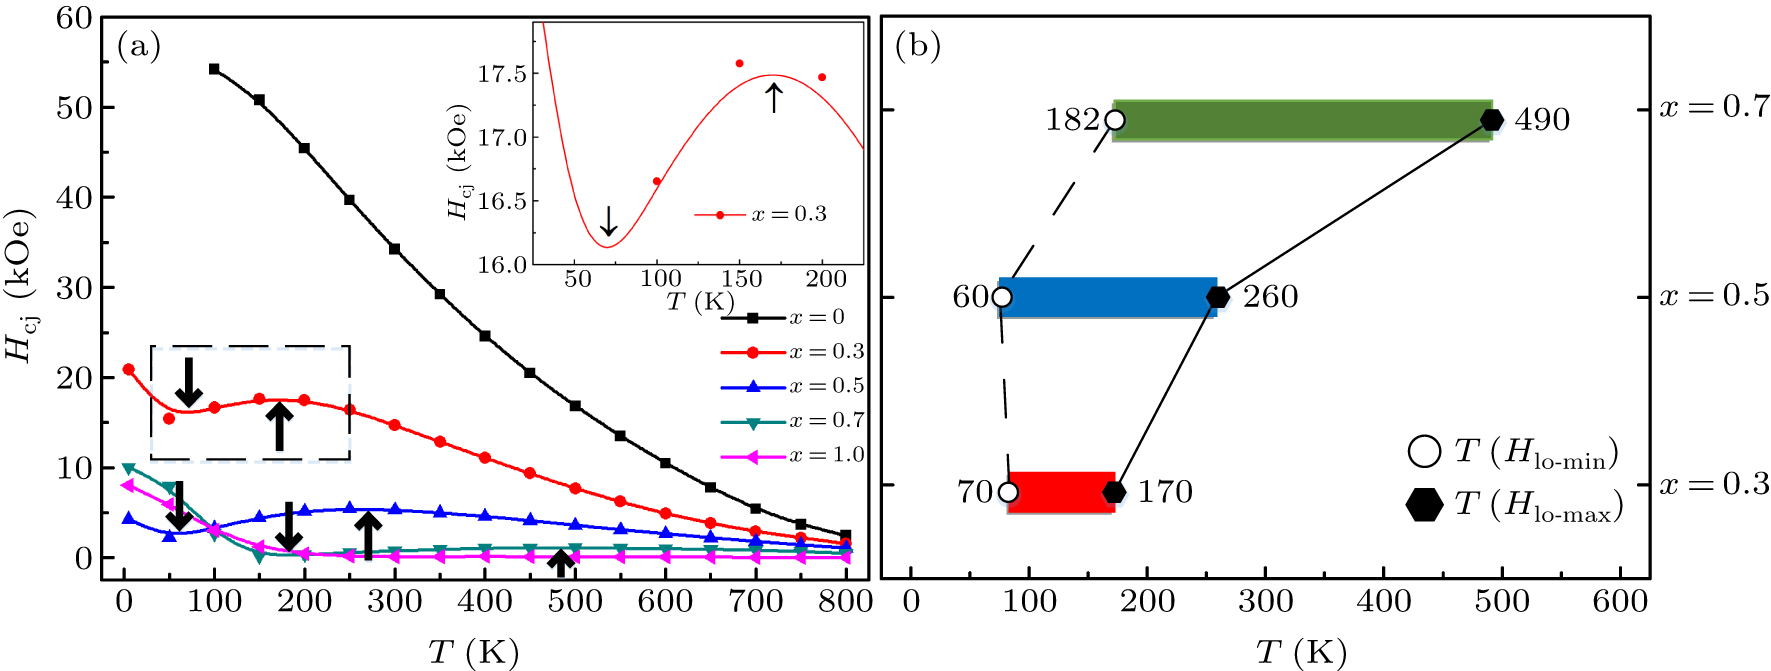
Fig. 7. (a) Plots of temperature-dependent coercivity of aged Sm1–x Ndx (Co0.695Fe0.2Cu0.08Zr0.025)7.2 (x = 0, 0.3, 0.5, 0.7, 1.0) magnets in a temperature range of 5 K–800 K with inset showing an enlarged view of the part of the curve in the dashed box. (b) Abnormal coercivity temperature ranges of aged Sm1–x Ndx (Co0.695Fe0.2Cu0.08Zr0.025)7.2 (x = 0.3, 0.5, 0.7) magnets in a range of 5 K–600 K.
Download figure:
Standard imageTable 3. The SRT-CBP temperatures and temperatures corresponding to local minimum/maximum coercivity of aged Sm1–x Ndx (Co0.695Fe0.2Cu0.08Zr0.025)7.2 (x = 0.3, 0.5, 0.7) magnets.
| x |
 (K) (K) | T(Hlo-min) (K) | T(Hlo-max) (K) |
|---|---|---|---|
| 0.3 | – | 70 | 170 |
| 0.5 | 60 | 60 | 260 |
| 0.7 | 170 | 182 | 490 |
It is worth noting that the coercivity around T(Hmin) and T(Hmax) are stable, which makes the magnets have a wide range of applications in high stability devices. As shown in the inset of Fig. 7(a), the coercivity temperature curve near T (Hmax) is smoother than that near T(Hmin), presenting a higher coercivity and a wider temperature smoothing range. Based on this feature, an Sm0.7Nd0.3 (Co0.695Fe0.2Cu0.08Zr0.025)7.2 magnet is obtained as shown in Fig. 8. The magnetic properties of Sm0.7Nd0.3 (Co0.695Fe0.2Cu0.08Zr0.025)7.2 magnet at 150 K are Br = 8.69 kGs, Hcj = 17.51 kOe, (BH)max = 16.29 MGOe, β (150 K–200 K) = –0.002%/K as shown in Table 4. Compared with the β (150 K–200 K) ≈ –0.236%/K in a conventional magnet, the β in this work is improved by two orders of magnitude.
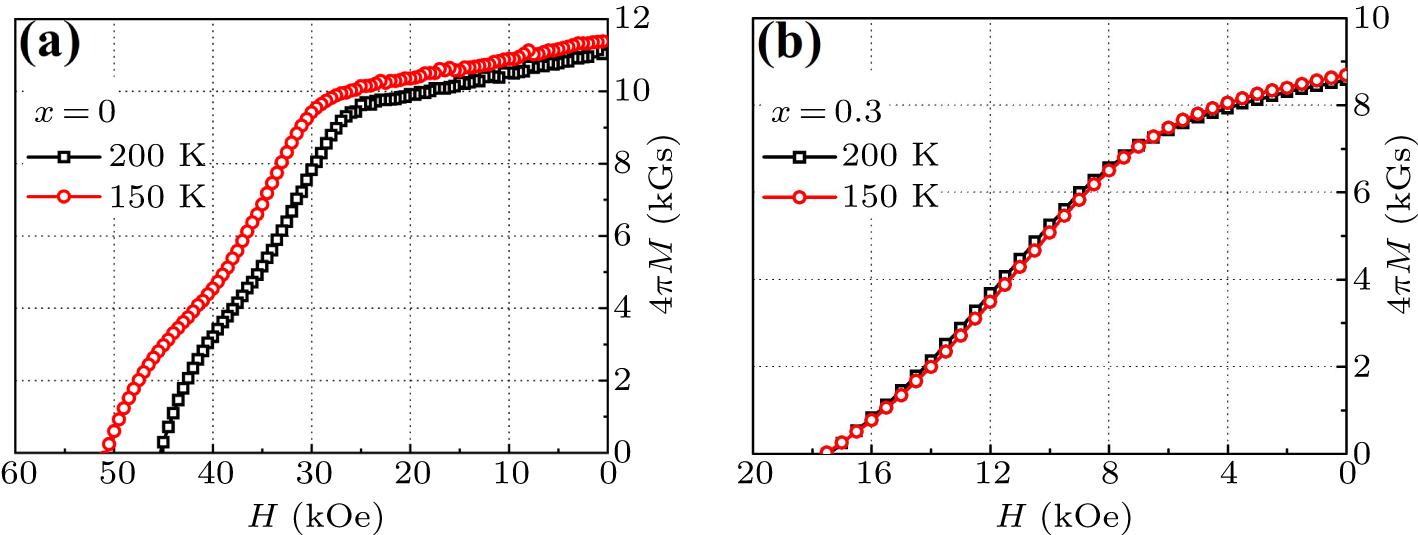
Fig. 8. Demagnetization curves of (a) aged Sm (Co0.695Fe0.2Cu0.08Zr0.025)7.2 magnet and (b) Sm0.7Nd0.3 (Co0.695Fe0.2Cu0.08Zr0.025)7.2 magnet at 150 K and 200 K.
Download figure:
Standard imageTable 4. Magnetic properties of aged Sm1–x Ndx (Co0.695Fe0.2Cu0.08Zr0.025)7.2 (x = 0, 0.3) magnets at 150 K and 200 K.
| x | T (K) | Br (kGs) | Hcj (kOe) | (BH)max (MGOe) | β (150 K–200 K) (%/K) | α (150 K–200 K) (%/K) |
|---|---|---|---|---|---|---|
| 0 | 150 | 11.38 | 50.81 | 30.98 | –0.236 | –0.032 |
| 200 | 11.03 | 45.44 | 28.91 | |||
| 0.3 | 150 | 8.69 | 17.51 | 16.29 | –0.002 | –0.025 |
| 200 | 8.58 | 17.49 | 15.91 |
4. Conclusion
The effects of Nd doping on the microstructures and magnetic properties of Sm1–x Ndx (Co0.695Fe0.2Cu0.08Zr0.025)7.2 (x = 0, 0.3, 0.5, 0.7, 1.0) permanent magnets are studied. The solid solution state samples with x = 0.7 and 1.0 have a minority 2:17R/2:17H phase coexisting with the majority disordered 1:7H phase, which deteriorates the integrity and homogeneity of the cellular structure after the aging process. The Ha decreases, and the degree of the orientation of the magnets becomes worse with Nd content increasing. These above reasons lead magnetic performance to decrease as Nd content increases in each of the Sm1–x Ndx (Co0.695Fe0.2Cu0.08Zr0.025)7.2 (x = 0, 0.3, 0.5, 0.7, 1.0) magnets. Positive temperature coefficients of coercivity (β) are found in the Sm1–x Ndx (Co0.695Fe0.2Cu0.08Zr0.025)7.2 (x = 0.3, 0.5, 0.7) samples, which result from the spin-reorientation-transition phenomena in the cell boundary phases. The corresponding positive β temperature ranges are about 70 K–170 K, 60 K–260 K, 182 K–490 K for the samples with x = 0.3, 0.5, and 0.7, respectively. The Sm0.7Nd0.3 (Co0.695Fe0.2Cu0.08Zr0.025)7.2 magnet is obtained with Br = 8.69 kGs, Hcj = 17.51 kOe, (BH)max = 16.29 MGOe at 150 K, possessing thermal stability β ≈ –0.002 %/K at a temperature range of 150 K–200 K.
Acknowledgments
Project supported by the National Key Research and Development Program of China (Grant Nos. 2021YFB3803003 and 2021YFB3503101), the Major Project of "Science and Technology Innovation 2025" in Ningbo, China (Grant No. 2020Z044), the Zhejiang Provincial Key Research and Development Program, China (Grant No. 2021C01172), and the National Natural Science Funds of China (Grant No. 51601209).