

Abstract
The half-life of the first 6+ state in 136Ce has been measured as T1/2 = 41(12) ps using the γ-ray fast-timing technique with the ν-ball spectrometer at the ALTO Tandem Accelerator, Orsay, France. The states of interest in 136Ce have been populated via the 128Te(12C,4nγ) fusion-evaporation reaction. A comparison is made between the value obtained for the reduced transition probability  = 0.55(21) W.u. and the systematics of the region. In this work, half-lives for the
  ,
,  and
and  states in 136Ce were also determined.
Export citation and abstract BibTeX RIS
1. Introduction
The determination of reduced transition probabilities in nuclei close to a shell closure is well established test for the Shell model within a constrained basis set. Additionally, these probabilities can be utilized to extract information about the effective charges, which serve as input parameters to the model. Following [1] were an assertion that nuclei with neutron numbers around N = 80 acts as a good test for the Shell model for nuclei containing protons above Z = 50, we suggest that this assertion is valid for broader region of neutron numbers around N = 82. Such nuclei would have their low lying states described well within Shell model by well-defined configurations of particles and holes. However, in the N = 80 isotone chain, very low values for the reduced transition probabilities have been measured for the isotopes 136Ba [2] and 138Ce [1]. Theoretical calculations performed with different versions of the Shell model suggested significant changes in the structure of nuclei observed in the transition from  to
to  states [3].
Figure 1 illustrates the evolution of the experimental  transition probability with neutron number for all Barium and Cerium isotones for 68 ≤ N ≤ 82. In Cerium isotopes within this range, the values are slightly higher but comparable to those in the corresponding Barium isotones. Notably, in 134Ce, the
  transition probability starts to decrease [6], and in 138Ce [1], it falls below the reported value for 136Ba. However, in the semi-magic nuclei 140Ce and 138Ba, the initial trend is reinstated, with the
  transition probability of 140Ce [7] surpassing that of 138Ba. Such crossings for Cerium and Barium isotopes with N = 76 and 78 is not yet established due to lack of experimental data. For comparison, if we examine the variation in the values for the reduced transition probabilities in the same two chains for the transition from the first excited 4+ to the first excited 2+ state (see figure 2), it becomes evident that we do not observe such crossing for N = 76. Unfortunately, data is missing for two nuclei in the Barium isotope chain 132,136Ba, but the available data align well with the behavior of the corresponding values for the Cerium isotopes, which suggests a similar trend in evolution. The discrepancy in the behavior of the B(E2) values between the two chains for the 6+ to 4+ and 4+ to 2+ transitions further indicates a structural change for these nuclei around the 6+ state. Measuring the unknown lifetimes of the 6+ states for 132,134Ba and 136Ce nuclei would contribute to a better understanding of the significant difference in the structure of the 6+ and 4+ states in those nuclei. To address this gap in the experimental data, we conducted an experiment to measuring the lifetime of the
  state in 136Ce. This paper presents the results of this measurement.
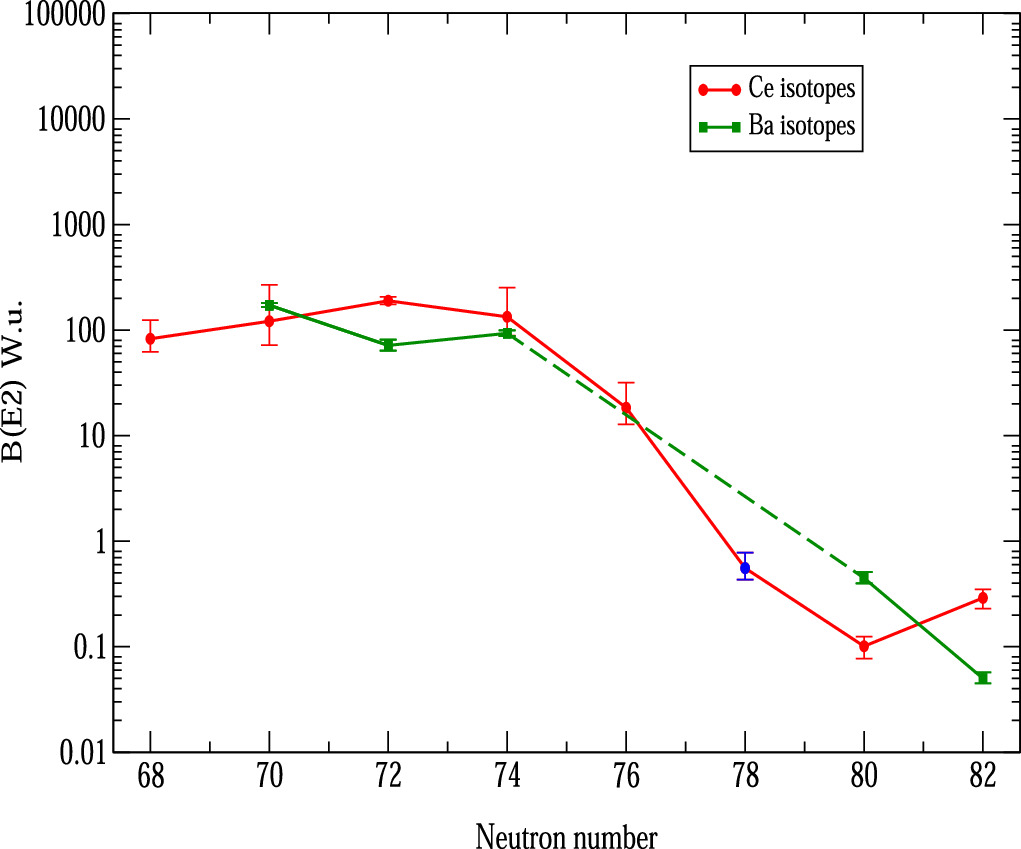
Figure 1. Comparison of experimental  values for Ce and Ba isotopes, 126Ce [4],128Ce [5],130,132,134Ce [6], 136Ce - (blue symbol—current study), 138Ce [1], 140Ce [7], 126Ba [8], 128Ba [9], 130Ba [10], 136Ba [2], 138Ba [11]. The dashed line is drawn to guide the eye for the expected behavior in the range where no experimental data is available.
Download figure:
Standard image High-resolution image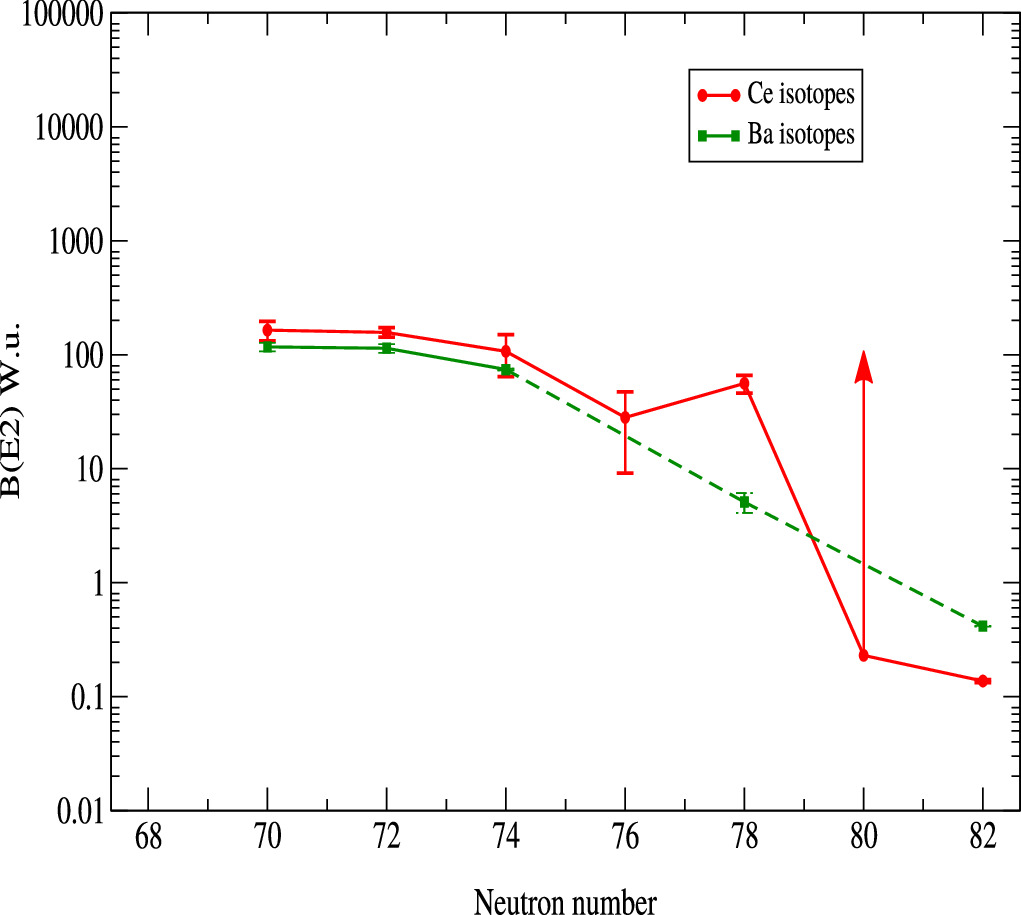
Figure 2. Comparison of experimental  values for Ce and Ba isotopes, 128Ce [5], 130,132,134,136Ce [12], 138,140Ce [1] (lower limit for 138Ce), 126Ba [8], 128Ba [9], 130Ba [10], 134Ba [13], 138Ba [14]. The dashed line is drawn to guide the eye for the expected behavior in the range where no experimental data is available.
Download figure:
Standard image High-resolution image2. Experimental details and data analysis
2.1. Experiment details
The experiment was performed at the ALTO Tandem Accelerator Facility in Orsay, France. The states of interest in 136Ce were populated via the 128Te(12C,4nγ) fusion-evaporation reaction at a beam energy of 60 MeV and 5 pnA current on target. The target was a 95% isotopically enriched 128Te foil of 2.6 mg cm−2 thickness on a 20 mg cm−2 Pb backing. The estimated production cross section of 550 mb for 136Ce was calculated using the PACE4 code.
Our experiment was part of the first ν-ball campaign, for which the ν-ball Detector System [17] was constructed. The ν-ball spectrometer is a hybrid array combining high-purity co-axial Germanium detectors (HPGe), clover detectors and lanthanum bromide LaBr3(Ce) scintillator detectors. This coupling allows us to combine the excellent energy resolution of the Germanium detectors together with the excellent time resolution of the LaBr3(Ce) detectors. The achieved total photopeak efficiency at 1.3 MeV was 6.7%, and the peak-to-total ratio for the Germanium part of the array was 50%. The clover Germanium detectors were placed in two rings of twelve detectors at 75.50o and 104.50o with respect to the beam axis. The LaBr3(Ce) detectors were placed in two rings of ten, at 46.5o and 34o with respect to beam axis and at 11 cm and 15 cm away from the target, respectively. These detectors were previously used in the FATIMA spectrometer [15] and were operated with PMTs (photomultiplier tubes) set to an anode output of 1 V/MeV, which corresponds to approximately 1400 V (PMT supply voltage). As shown in figure 3 of [16], the energy response of the FATIMA LaBr3(Ce) detectors has been found to be linear for energies below 3 MeV. For higher energies the unfolding non-linearity is relatively weak.

Figure 3. The PRD curve of the setup measured with a 152Eu source [19].
Download figure:
Standard image High-resolution imageUsing the digital acquisition system FASTER [17], the achieved time resolution was about 250 ps for LaBr3(Ce). That system makes the ν-ball a fully digital large fast-timing spectrometer with time resolution similar to analogue electronics.
2.2. Analysis
The aim of the experiment was to measure the unknown lifetime of the  state in 136Ce. The expected value for the reduced transition probability between the first excited 6+ and 4+ states in 136Ce is
  0.0046 W.u., which corresponds to T1/2 < 5 ns. Assuming that the
  in 136Ce is 1 W.u., the value will be between the known from the literature values for 138Ce and 134Ce [1, 6]. This corresponds to a lifetime of 27 ps for the
  state of 136Ce. Lifetimes in the range between 5 ns and 27 ps are well within reach of the fast-timing technique.
Lifetimes of interest were extracted using the Generalized Centroid Difference (GCD) method [18]. This method uses two distributions (delayed and antidelayed) of the time difference ΔT between two successive γ rays, the feeding and decay transitions of the level of interest. The delayed time spectra distribution labeled as (D) is obtained when a transition which feeds the state provides the start signal and a decay transition from this state provides the stop signal for the ΔT. In the reverse case, the resulting ΔT distribution is labeled as antidelayed (AD). Swapping the start and stop detectors is equivalent to swapping the sequence of the feeder and decay transitions of the cascade and gives mirror-symmetric distributions. The mean lifetime of the state of interest can be determined from the difference between the centroids of these time spectra CD and CAD :

In this equation, PRD (Prompt Response Difference) describes the mean time walk characteristics of the experimental setup [19]. A 152Eu calibration source, which covers the energy range starting from 121keV up to 1408keV, was used to obtain the PRD curve. Both time spectra—delayed and antidelayed were produced by selecting several feeder-decay combinations for states with well-known lifetimes from the calibration source. By measuring the centroid differences ΔC and using equation (1), the PRD is obtained. The data points are then fitted using the function [16, 20]:

as it is shown in figure 3. The precision of the PRD fit is defined as two times the standard root-mean-squared deviation.
The lifetimes of interest were extracted by analyzing triple-γ coincidences. The coincidences were formed by using γ-γ data in LaBr3(Ce) detectors which are in an additional coincidence with a chosen energy registered in the HPGe detectors. The latter coincidence condition improves the peak-to-background ratio in the LaBr3(Ce) detectors and reduces the influence of possible contaminants. A schematic representation of the levels of interest in 136Ce is shown in figure 4.
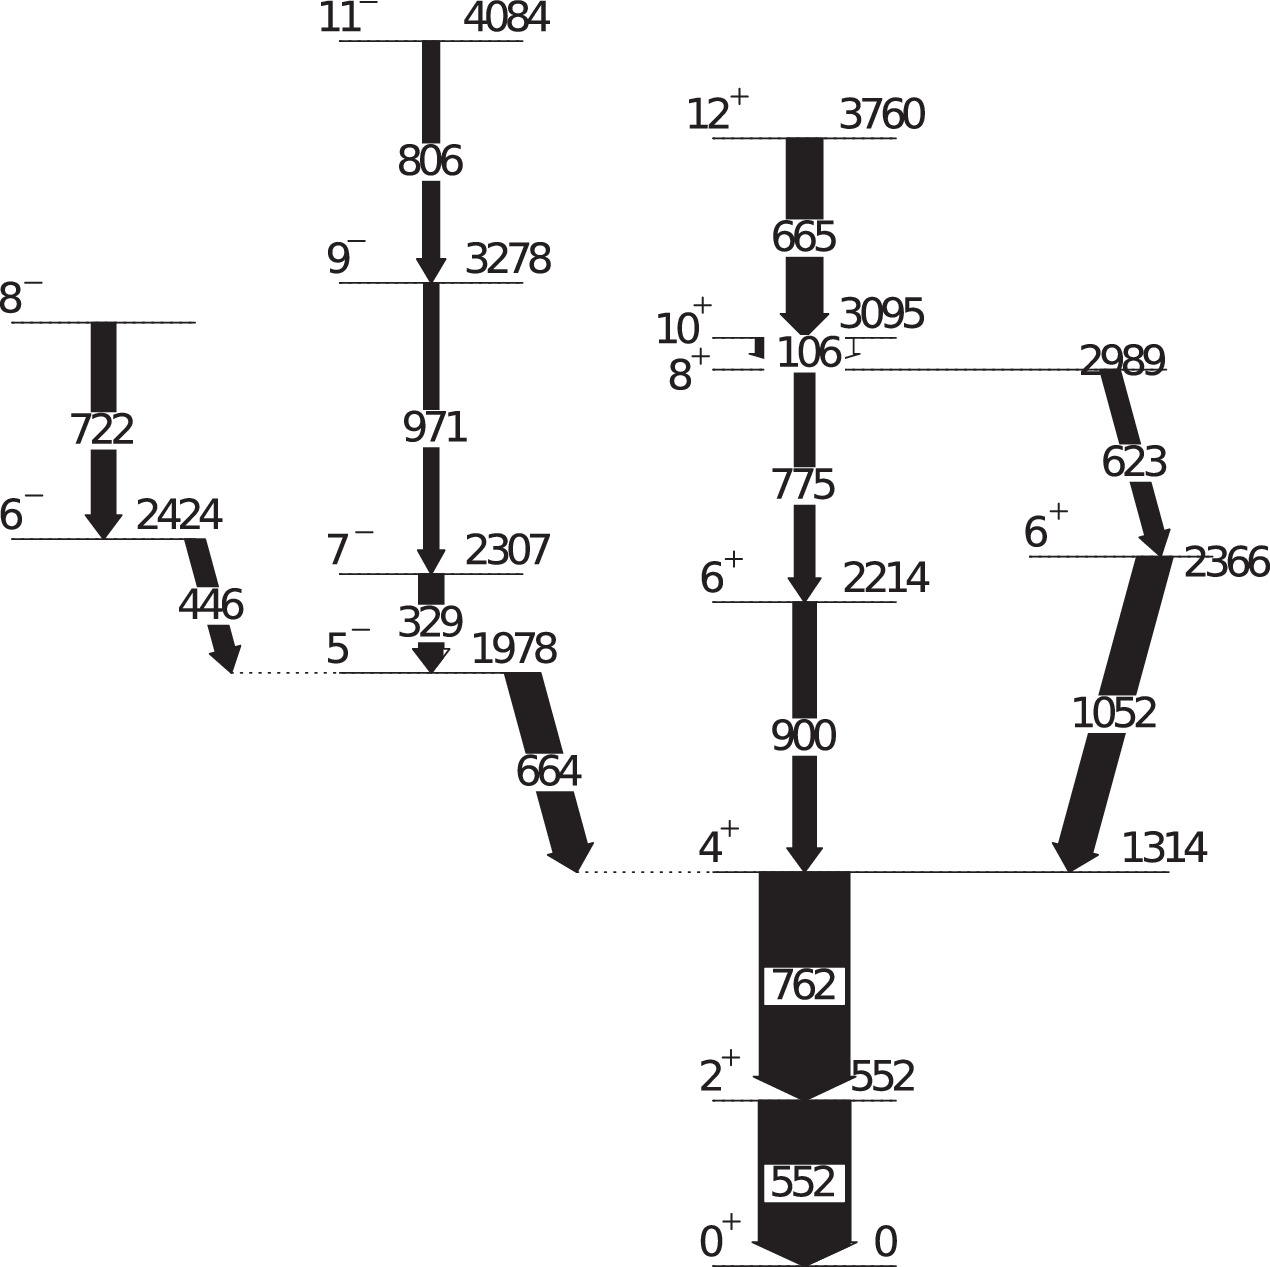
Figure 4. Partial level scheme of 136Ce [21].
Download figure:
Standard image High-resolution imageTo determine the lifetime of the  state we set a cleaning gate on the γ-ray transitions directly populating the
  state (see figure 4) and measured the centroid difference between the delayed and antidelayed time distributions obtained with the 775 keV–900 keV coincidence in LaBr3(Ce) detectors. The time-difference spectra obtained are shown in figure 5 together with the corresponding double gated LaBr3(Ce) and HPGe projections. On panel (a) are shown projections of the lanthanum bromide scintillator and high purity germanium detectors energy spectra, generated after applying double HPGe-LaBr3(Ce) gates on the triple gamma HPGe-LaBr3(Ce)-LaBr3(Ce) and HPGe-HPGe-LaBr3(Ce) matrices. The gate on LaBr3(Ce) is set on the transition populating the level of interest. The scaling factor between spectra from germanium detectors and the generated LaBr3(Ce) spectra is 3.3. The blue lines show the gate width used for the depopulating transition, set on the LaBr3(Ce) to produce the time difference spectra. The peak to background ratio for the depopulating transition is equal to 2.7(2). The green lines indicate the regions where the gates used to extract the centroid difference of the background were placed which is a necessary correction step [22] before using equation (1). The red line represents the linear fit of the background centroid difference below the full energy peak of the decay transition (ΔC
 ). The PRD curve of the experimental setup is shown in blue. The green points correspond to the experimentally obtained centroid difference. On panel (b) is shown the time difference distributions (delayed and antidelayed) for the 775–900keV pair transitions used to extract the lifetime of the
  state. The panel (c) is the same as panel (a) with the LaBr3(Ce) gate set on the depopulating transition, with the red line used to extract ΔC
 for the feeder determined in analogues way as ΔC
 . The scaling factor for the generated LaBr3(Ce) spectra is 3.1 and the peak to background ratio value is 3.9(3).
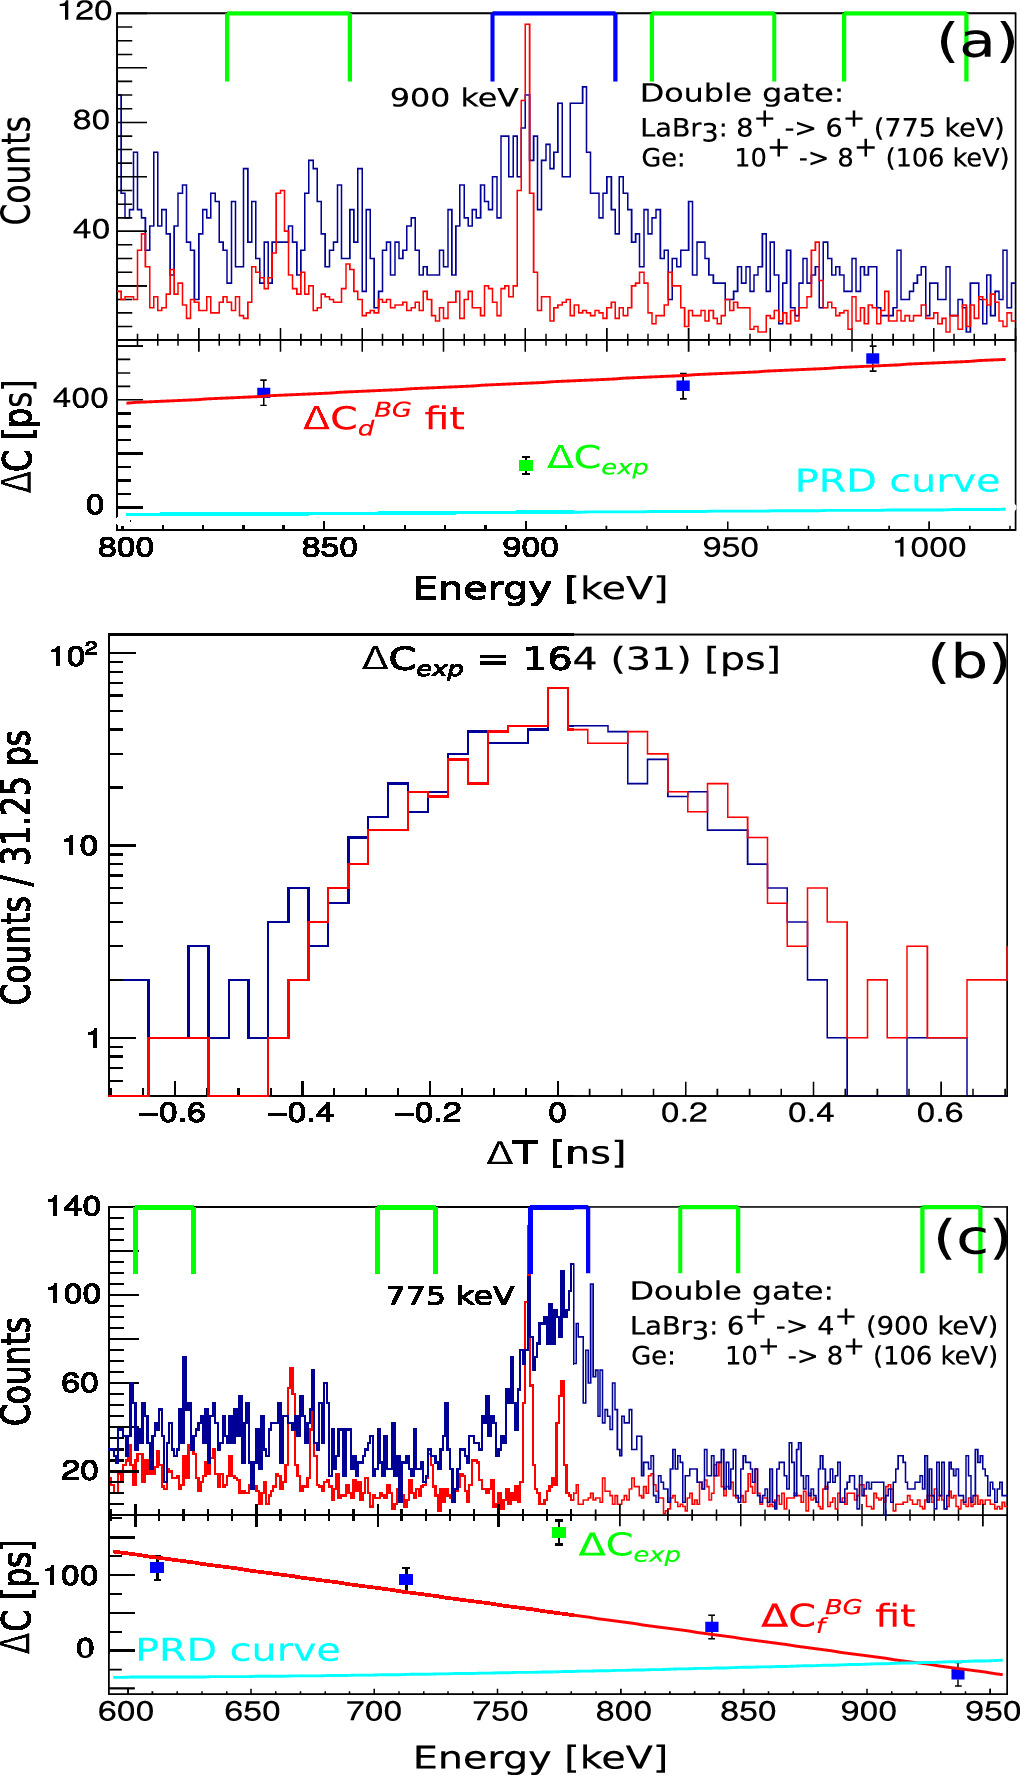
Figure 5. (a) Projections of the scintillator and germanium detectors energy spectra, generated after double HPGe-LaBr3(Ce) gates on the triple gamma HPGe-LaBr3(Ce)-LaBr3(Ce) and HPGe-HPGe-LaBr3(Ce) matrices, respectively. (b) The time difference distributions (delayed and antidelayed) for the 775-900 keV pair transitions used to extract the lifetime of the  state. (c) The same as figure (a) with the LaBr3(Ce) gate set to the depopulating transition.
Download figure:
Standard image High-resolution imageThe determined centroid difference between the delayed and antidelayed distributions is equal to ΔCexp =164(31) ps. The centroid difference ΔCFEP corrected for background is defined by [23, 24]:

where


The calculated centroid difference ΔCFEP is 110(32) ps and equation (1) becomes [25]

The final value for the lifetime of the  state in 136Ce is determined to be
  = 60(17) ps (T1/2 = 42(12) ps), with the corresponding
  (0.55(21) W.u.).
Additionally, we measured the well-known lifetimes for the yrast  and
and  states in 136Ce [26, 27] (see table 1). In the case of
  the experimental half-life of T1/2 = 306(20) ps was determined by taking the time difference between the 971 keV (9− → 7−) and 329 keV (7− → 5−) transitions in the LaBr3(Ce) detectors with a cleaning gate on the 806 keV (11− → 9−) transition detected in a HPGe detector (see figure 6). In figure 7 is shown the time distribution spectrum of the Iπ
= 5− yrast state. The resulting half-life value of T1/2=493(18) ps was determined by using the time difference spectra between the 446 keV (6− → 5−) and 664 keV (5− → 4+) transitions in the LaBr3(Ce) detectors with a cleaning gate on the 552 keV (4+ → 2+) transition and partial exponetial fit (see figure 7). The agreement with literature of the lifetime values of these two low-lying
the experimental half-life of T1/2 = 306(20) ps was determined by taking the time difference between the 971 keV (9− → 7−) and 329 keV (7− → 5−) transitions in the LaBr3(Ce) detectors with a cleaning gate on the 806 keV (11− → 9−) transition detected in a HPGe detector (see figure 6). In figure 7 is shown the time distribution spectrum of the Iπ
= 5− yrast state. The resulting half-life value of T1/2=493(18) ps was determined by using the time difference spectra between the 446 keV (6− → 5−) and 664 keV (5− → 4+) transitions in the LaBr3(Ce) detectors with a cleaning gate on the 552 keV (4+ → 2+) transition and partial exponetial fit (see figure 7). The agreement with literature of the lifetime values of these two low-lying  and
and  states serves as validation for the obtained value of
  = 60(17) ps in 136Ce.
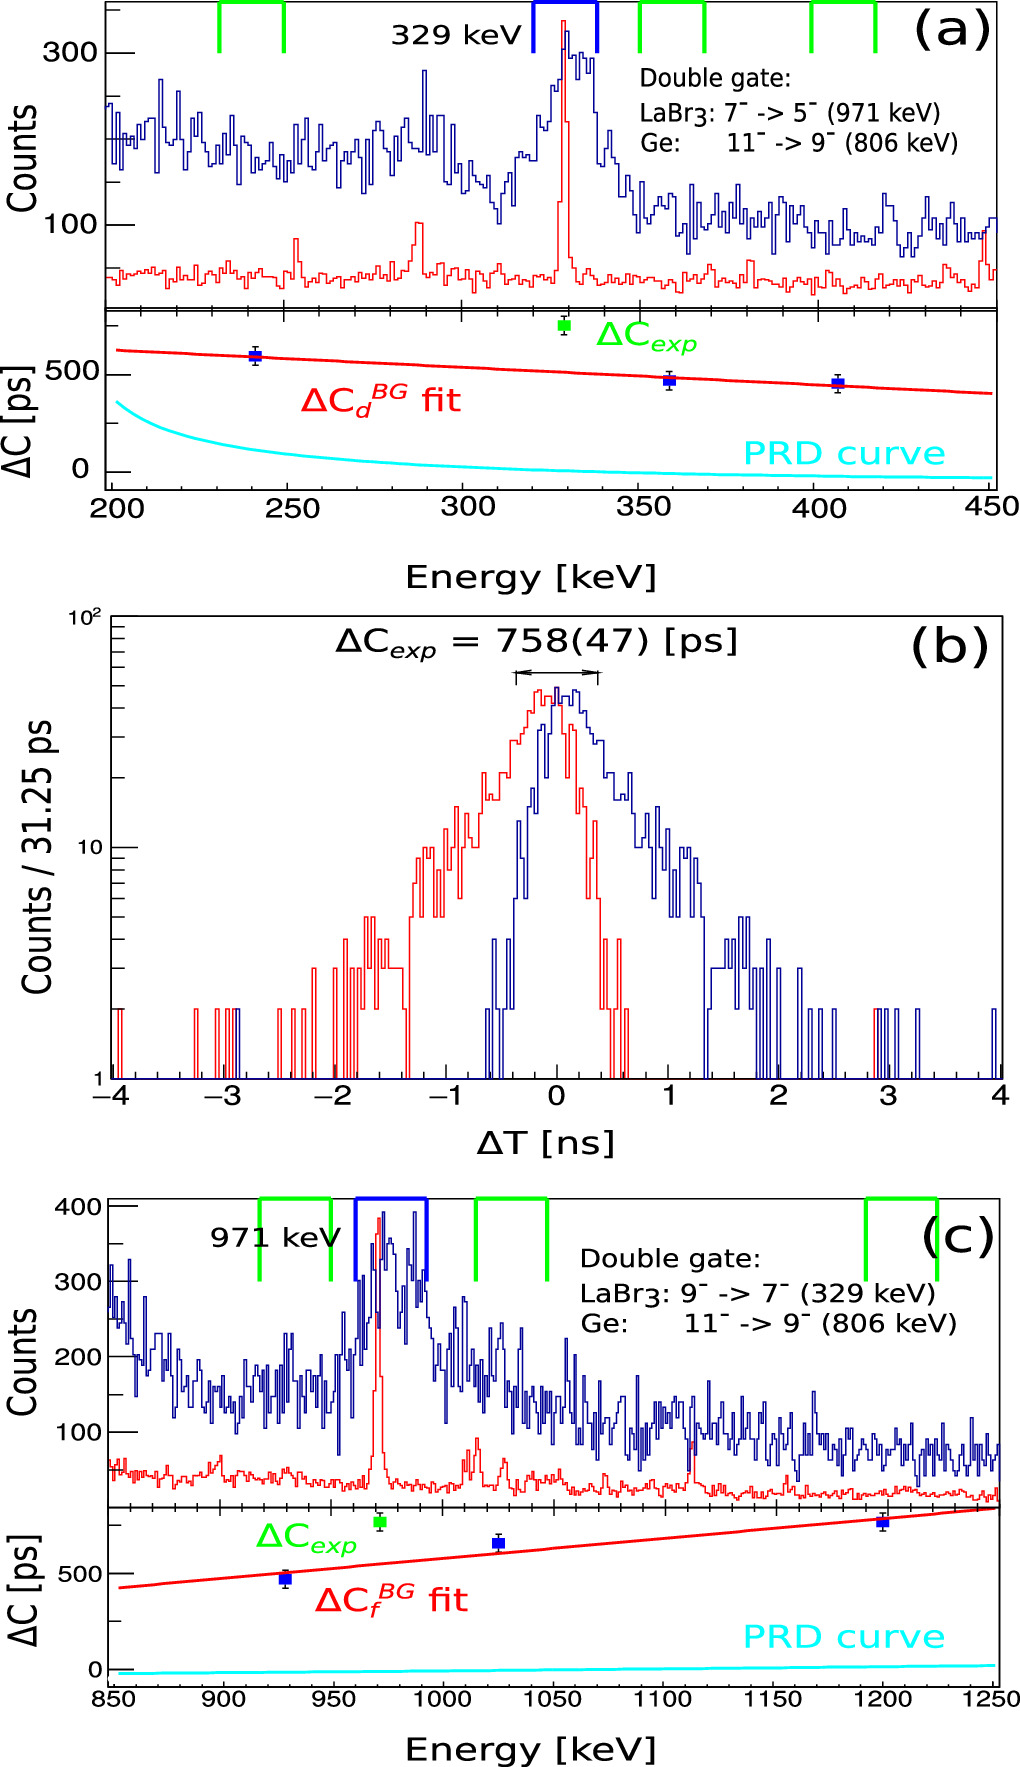
Figure 6. The procedure of extracting the lifetime of the  state in 136Ce. The figure is analogous to figure 5. The corresponding peak-to-background ratios are 2.1(1) and 2.2(1).
Download figure:
Standard image High-resolution image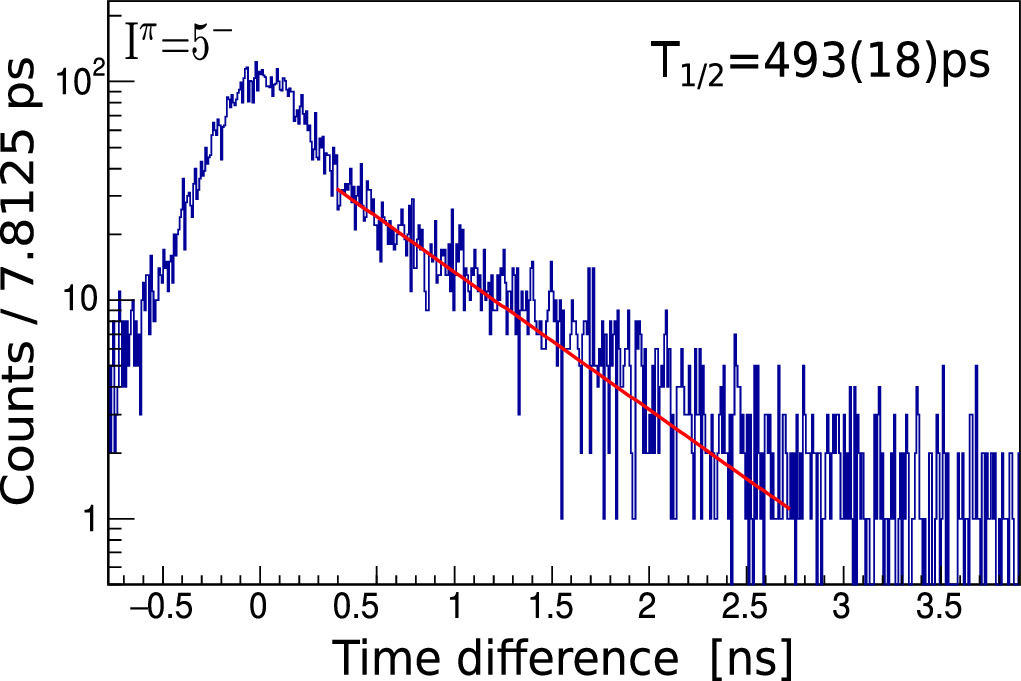
Figure 7. Time distribution spectrum of the Iπ = 5− yrast state obtained in 136Ce. The resulting half-life of T1/2 = 493(18) ps is determined from the time difference spectra between the 446 keV and 664 keV transitions with a cleaning gate on the 552 keV transition.
Download figure:
Standard image High-resolution imageTable 1. The T1/2 values of the excited states in 136Ce measured in the current study.
| Elev | Iπ | Eγ | T1/2 | T1/2(lit.) a | λ L | B(λ L)exp | B(λ L)IBM1 |
|---|---|---|---|---|---|---|---|
| [keV] | [keV] | [ps] | [ps] | [W. u] | [W. u] | ||
| 1978 |

| 644 | 493(18) | 496(23) | E1 | 0.193(1)×10−5 | |
| 2214 |

| 900 | 42(12) | E2 | 0.55(21) | 54.72 | |
| 2307 |

| 329 | 306(20) | 270(24) | E2 | 11.1(7) | |
| 2366 |

| 1052 | 27(8) | E2 | 0.39(12) |
a Taken from [27].
In the present experiment the lifetime of the  state in 136Ce was also measured (figure 8). The half-life of T1/2 = 27(8) ps was determined by taking the time difference between the 1052 keV
  and 623 keV
  transitions in the LaBr3(Ce) detectors with a cleaning gate on the 106 keV
  transition. The T1/2 values for all measured states in 136Ce in the current study are summarized in table 1.
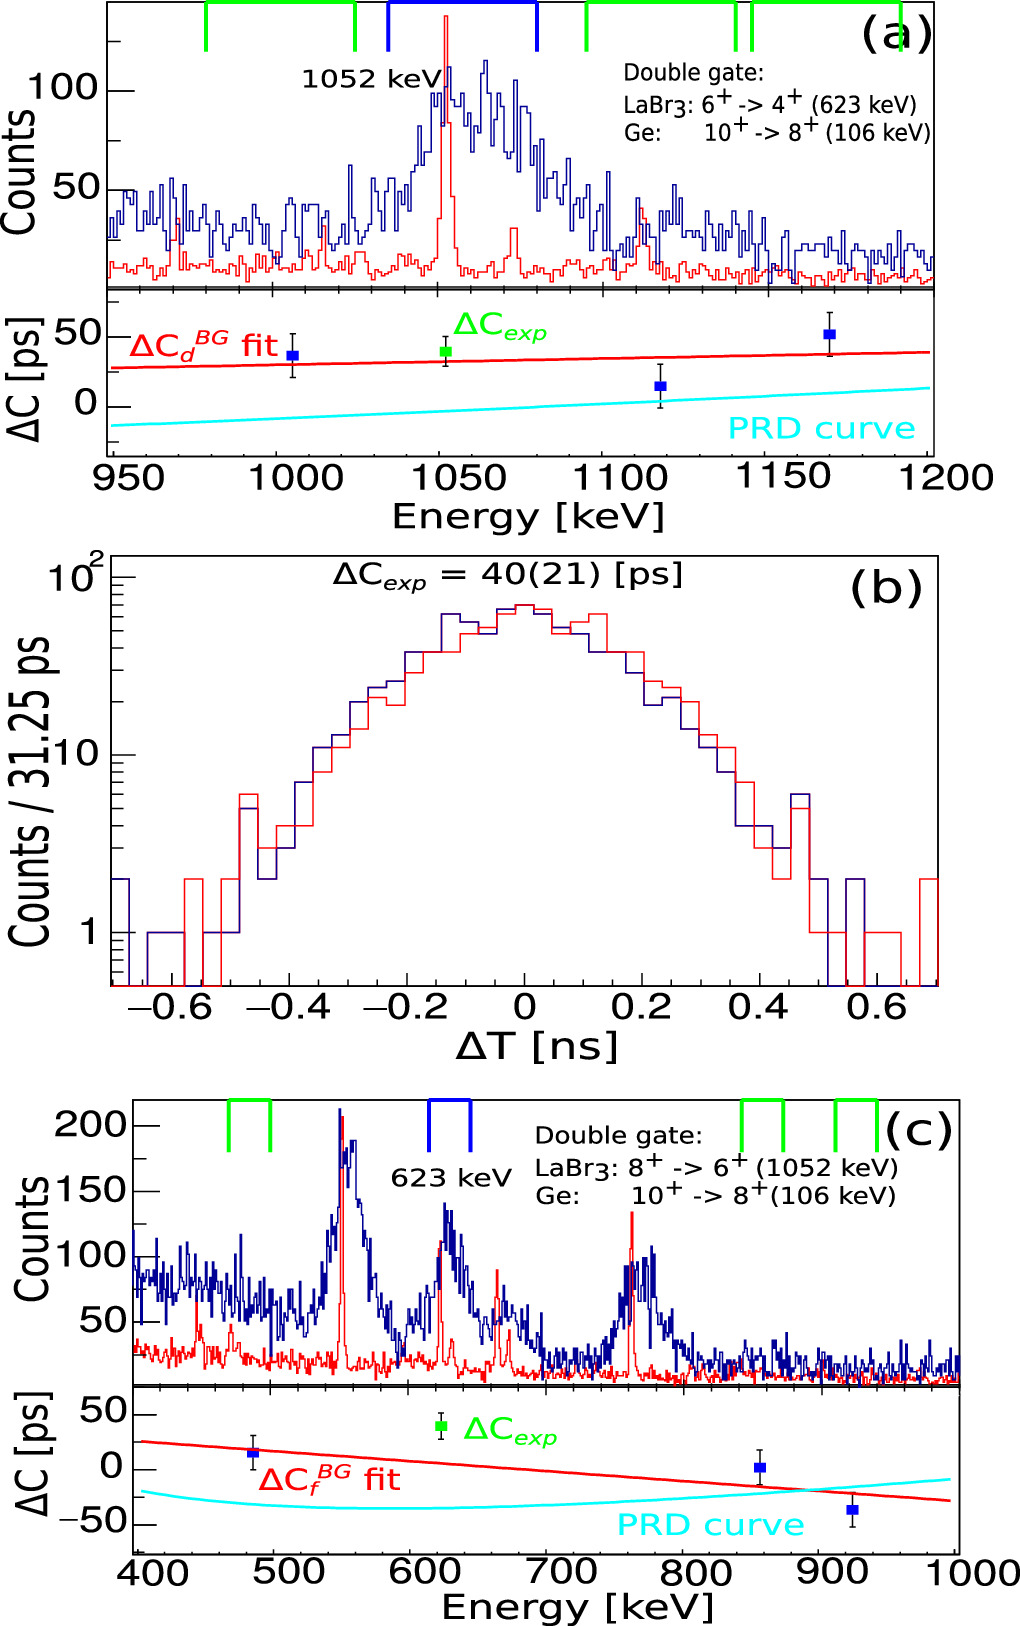
Figure 8. The procedure of extracting the lifetime of the  state in 136Ce. The figure is analogous to figure 5. The corresponding peak-to-background ratios are 4.0(3) and 3.3(2).
Download figure:
Standard image High-resolution image3. Discussion
To address the observed low experimental values obtained for the reduced transition probabilities in the heavy Barium and Cerium isotopic chains we applied two theoretical models—the IBM1 [28, 29] and the Shell model [30].
3.1. IBM1 calculations
The values for reduced transition probabilities from the theoretical calculations using the IBM1 model for Cerium isotopes are taken from [31]. The calculated values for the energy levels of the excited states generally match the experimental data below the 10+ state well, with a larger deviation observed for the heavier Cerium isotopes with mass numbers A = 136 and A = 138. However, the model only reasonably well describes the reduced transition probabilities for the lighter Cerium isotopes (figure 9). Beyond 130Ce, the theoretical values significantly surpass the experimentally measured values. For 136Ce and 138Ce, the discrepancy reaches 2-3 orders of magnitude.

Figure 9. Comparison of experimental  values for Ce and Ba isotopes and IBM1 model calculation [31, 32].
Download figure:
Standard image High-resolution imageSimilar calculations using the IBM1 model have been carried out for the isotonic Barium chain [32]. The energy levels of the excited states from the yrast band for the lighter isotopes with mass number less than A = 132 are well reproduced. The experimental values for the reduced transition probability  are also well described. Unfortunately, experimental information is lacking for the isotopes 132Ba and 134Ba, which does not allow us to compare the behavior of this isotonic chain with that for Cerium. However, experimental information on the reduced transition probabilities for the heavier 136Ba and 138Ba is available and we observe a discrepancy with the model predictions of 2-3 orders of magnitude, as in the case of the heavy Cerium isotopes.
From the comparisons made, it can be observed that for the light isotopes in the Barium and Cerium isotopic chains the IBM1 model reproduces the reduced transition probabilities and the energy levels reasonably well. However, it completely fails in describing the behavior of the heavier isotopes.
3.2. Shell model calculations
The successful application of the Shell model strongly depends on the total size of the configuration space, which for nuclei with mass numbers around 130 exceeds 1011, far surpassing the number of configurations that can be handled with the available computing power.
Calculations for Cerium isotopes are notably challenging due to their distance from the closed proton and neutron shells, and theoretical data are only available for the isotopes 138Ce and 140Ce [1] for which the NUSHELLX@MSU code [33] was used. Similarly to the IBM1 model, the Shell model reproduces the energies of the low lying levels of the yrast band below the 10+ state. However, the discrepancies between calculated and experimental values for the reduced transition probabilities between the excited  state and the
  state still persist, although they are an order of magnitude better than those obtained with the IBM1 model calculations.
Shell model calculation for the isotope of interest 136Ce could not be carried out due to lack of available computing power.
Barium isotopes contain two protons fewer than Cerium isotopes, which significantly reduces the degrees of freedom and allows calculations using the Shell model. Calculations carried out for Barium isotopes with mass numbers between 132 and 138 [30] show good agreement for the values of the energies of the excited levels from the yrast band below the 8+ states. In figure 10, it is clearly seen that for 136,138Ba the calculated values for the reduced transition probabilities follow the behavior of the experimental ones but are strongly overestimated. Unfortunately, there is a lack of experimental data that would allow for comparison of the behavior of the reduced transition probabilities at 132Ba and 134Ba.

Figure 10. Comparison of experimental  values for Ce and Ba isotope and Shell model calculation [1, 30].
Download figure:
Standard image High-resolution image
Based on the results from the two models, new experimental data for 132Ba and 134Ba would definitely allow for the models to fully explore the evolution of the reduced transition probabilities for the entire Barium and Cerium isotonic chains.
4. Summary
Lifetime of  = 60(17) ps for the first excited
  state in 136Ce was measured. Its reduced transition probability contributes to a notable evolution trend of the reduced transition probabilities of the Cerium and Barium chains but such trend could not be reproduced by Shell model and IBM1 calculations due to various limitations including lack of data for 132,134Ba. Clearly, measurements for the first excited 6+ states in 132,134Ba isotopes are needed.
Acknowledgments
This study is finaced by the European Union-NextGenerationEU, through the National Recovery and Resilience Plan of the Republic of Bulgaria, project No BG-RRP-2.004-0008-C01. This work was support by the Bulgarian National Science Fund (BNSF) under Contract No. KP-06-N48/1 and Science, within the National Roadmap for Research Infrastructures (object CERN).
Data availability statement
All data that support the findings of this study are included within the article (and any supplementary files).