

Abstract
This research addresses the pressing demand to enhance energy density and power in energy storage devices, including batteries, fuel cells, and supercapacitors. Here, NiMn2O4 is synthesized using the urea combustion method. Characterization techniques, including powder x-ray diffraction, field emission scanning electron microscopy, and BET analysis, are employed to investigate its properties. The diffraction peaks showed that NMO had a face-centered tetragonal structure, and the Scherrer equation was used to figure out the average crystallite size (t) as 8.73 nm. Its electrochemical behavior is extensively evaluated through cyclic voltammetry and galvanic charge–discharge measurements. The findings indicate that the fabricated NiMn2O4 electrodes exhibited remarkable specific capacitance and exceptional cycling stability, retaining 97% of their initial performance over 10000 cycles. The specific capacitance of the electrode from GCD was obtained 80 F g−1 at a current density of 0.25 A g–1. This study highlights the potential of NiMn2O4 as an electrode material for high-performance electrochemical supercapacitors, offering a viable solution for advancing energy storage technologies.
Export citation and abstract BibTeX RIS
1. Introduction
In response to the evolving global landscape, energy has taken center stage for major world powers and the scientific community. The quest for more efficient energy storage devices has garnered substantial interest. Among these devices, supercapacitors have seen significant development in the last decade and have the potential to bring about major advances in the field of energy storage [1–5]. Current research and development patterns predominantly feature the use of carbonaceous materials in supercapacitor fabrication because of their excellent cycling stability and high specific capacitance [6–9]. However, they suffer from limitations in specific energy density and cell voltage. These limitations can potentially be mitigated through the utilization of metal oxides and conducting polymers [10–15].
Metal oxides, known for their high conductivity, have been explored as electrode materials, with a primary focus on ruthenium oxide. Ruthenium oxide-based pseudocapacitors have shown promise in achieving higher energy and power densities compared to conventional electric double-layer capacitors (EDLCs) and conducting polymer pseudocapacitors [16, 17]. Nevertheless, the prohibitive cost of ruthenium oxide has hindered its widespread adoption, necessitating further research into alternative metal oxides that can deliver cost-effective performance. In light of the high cost of RuO2, cost-effective and environmentally friendly electrode materials, such as manganese-based oxides, have gained popularity. Additionally, it is a fact that the electrochemical performance is highly reliant on the morphology, specific surface area, and pore size distribution of the active material [18–20].
In this context, nickel magnetite, in particular spinel nickel manganese oxides (NiMn2O4), emerges as a promising electrode material in comparison to Ni-Mn binary oxides and Mn3O4 materials [21]. NiMn2O4 (NMO) offers advantages like structural stability, low cost, good conductivity, and relatively high specific capacitance [22]. Recent research efforts have strived to simplify the synthesis process of NMO, making it more amenable for industrial applications. For instance, Huan Pang et al synthesized NMO using oxalate precursors calcined at 450 °C for one hour [23]. Similarly, Miao Zhang et al employed an epoxide-driven sol–gel process, which involved a rigorous twenty-hour procedure followed by calcination at 300 °C for five hours [24]. This complexity underscores the need for a simpler, time-efficient, and scalable method; it is where the combustion method stands out.
Surya et al have studied the pseudocapacitivity of NiMn2O4 nanoparticles as an electrode for high-powered hybrid supercapacitors. The capacitor for configuration 2M NaOH NiMn2O4 delivers a capacitance of 51 F g−1 in the potential window of 0.0 to 1.6 V. It also exhibited a density of 5.33 Wh kg−1 and power density of 4601.62 W kg−1. NiMn2O4 with 2M with 2M LiOH exhibited the specific capacitance of 110 F g−1, the specific capacitance decreased for electrolyte H2SO4 to 87 F g−1 [25]. In this study, NMO is synthesized via the combustion method, yielding high-purity metastable products with uniformly distributed nanoparticles and a porous structure, in a significantly reduced time. Recent research data supports the potential of this method for cost-effective and industrially scalable NMO electrode production.
2. Experimental details
2.1. Preparation of spinel nickel magnetite
The synthesis of NMO is accomplished by utilizing the urea combustion technique which is a well-established method in materials science. This approach involves the precise amount of various chemical reagents to yield the desired product. Here, metal nitrates, namely Ni(NO3)2.6H2O 98.0% pure (obtained from Rankem), and Mn(NO3)2.4H2O 98.0% pure (obtained from Acros), are dissolved in a minimal quantity of distilled water. This solution is then subjected to 80 °C for half an hour and continuously stirred to ensure the homogeneity of solution.
To initiate the combustion process, urea 99.0% pure (obtained from Hi-Media) is added to the nitrate solution. The resulting mixture is subsequently placed into a preheated muffle furnace, with the temperature set at 300 °C. The introduction of heat prompted the ignition of the reaction, leading to the evolution of smoke within a remarkably short span of approximately 10 min. The smoke eventually dissipates, leaving a malleable substance that is later mechanically crushed using a mortar and pestle. To enhance the properties and crystallinity of the resulting material, it is further subjected to calcination at 400 °C. This critical step is essential for characterizing and fine-tuning the structural attributes of NMO. By following this procedure, high-quality NMO nanoparticles are produced. The entire process is depicted in figure 1.

Figure 1. The flow diagram depicting the synthesis process of NMO via the urea combustion method.
Download figure:
Standard image High-resolution image2.2. Experiment details
The structural analysis is performed through x-ray diffraction (XRD) using a D8 Focus x-ray diffractometer from Bruker (United States), which employed CuKα radiation. To assess the surface morphology of the prepared sample, a field emission scanning electron microscope (FESEM) MIRA3 Tescan (Czech Republic) is utilized. The thermal gravimetric analysis (TGA) was carried out using thermal analyzer (TGA, SII EXSTAR 6300) to check the thermal stability of the material. Furthermore, the specific surface area is quantified utilizing the Brunauer–Emmet–Teller (BET) method with a Quantachrome ASiQwin (Florida) instrument. The sample underwent a meticulous degassing process, which lasts for 6 h at a temperature of 300 °C under a continuous flow of nitrogen prior to surface area determination. These characterization methods are employed to obtain the NMO's structural and morphological properties.
2.3. Electrode preparation and electrochemical characterization
Electrochemical investigations are performed to examine the nanostructured NMO (nano-NMO). It is conducted through a three-electrode configuration arrangement. In this arrangement, nano-NMO is employed as the working electrode, an Ag/AgCl electrode serves as the reference electrode, and a platinum wire functions as the counter electrode. The electrolyte consisted of a freshly prepared 2 M potassium hydroxide (KOH) aqueous solution, which is prepared using double distillation of water.
The working electrode is prepared by blending 70% by weight of nano-NMO, 15% conducting carbon, and 15% polyvinylidenefluoride (PVdF). This composite mixture (slurry) is added to N-Methyl-2-pyrrolidone (NMP), and the mixture is subjected to agitation for duration of 12 h. Subsequently, this slurry, containing an active material content of approximately 1.05 mg, is coated onto a graphite substrate with a surface area of 1.0 cm2. Following this coating process, the electrodes are subjected to a drying process at a temperature of 80 °C for 12 h in an ambient air oven. The electrochemical evaluation comprises cyclic voltammetry (CV) with different voltage scan rates and galvanostatic charge/discharge (GCD) cycling performed at different current densities. Electrochemical Impedance Spectroscopy (EIS) is conducted, employing a voltage signal of 5 mV across a wide frequency range of 1 MHz to 10 mHz. The EIS measurements are performed utilizing a multichannel Potentiostat/Galvanostat from AUTOLAB MAC-80039.
2.4. Parameters used for electrochemical kinetics calculation of electrodes
The specific capacitance of the electrode and device was determined by calculating the CV profile

Where CS,  m and s represent the specific capacitance, area under the CV curve, mass of loaded material, and scan rate, respectively. The GCD profile was used to calculate the specific capacitance of the electrode and device.

where, I/m, ΔV, and Δt are current density, voltage window, and discharge time [26, 27].
The calculation of the areal energy density and areal power density for the transparent symmetric supercapacitor device is obtained by equations (3)–(4)


where (E) areal energy density (Wh cm−2), ΔV working potential window (V), P areal power density (W cm−2), and (t) time of discharge [28].
3. Results and discussion
3.1. Thermal, structural, morphological and surface characterization
To investigate the calcination temperature at which NMO was formed, the TGA of NMO was carried out at a ramping rate of 5 °C min−1 and corresponding result is shown in figure 2(a). The regions for weight loss for NMO is divided into two regions: small weight loss in the range of 30 to 160 °C and prominent weight loss in the range of 160 °C to 400 °C. The first weight loss (∼4%) in the range of 30 °C to 160 °C may be attributed to the absorbed moisture in the samples. Further, significant weight loss (∼73%) in the range of 160 °C to 400 °C may be ascribed to the decomposition of metal precursors. After complete decomposition, there is no further weight loss observed in before calcination material which shows that the outcome product is thermally stable up to 800 °C. This constant weight reveals the fact that the respective metal precursor is converted to the desired metal oxides [29]. Further, NMO powder was calcinated at a slow heating rate of 0.5 °C min−1 in a nitrogen atmosphere. However, pure phase formation of NMO could only be obtained at 400 °C. Further, XRD is performed for analyzing crystalline materials. The crystallite size determined by examining the diffraction peaks. The study also helps to identify the different phases present in a sample by matching the obtained diffraction pattern with known crystallographic databases. The XRD pattern, as depicted in figure 2(b). It elucidates the presence of a tetragonal spinel structure. It concurs well with the findings in the existing literature [23]. The diffraction peaks within this pattern can be readily associated with a face-centered tetragonal structure of NMO. It possesses the Fd3m space group (JCPDS card # 00-001-1110). The distinct diffraction peaks as ascertained through XRD analysis are indicative of a particle-like structure [24]. The weak reflections observed at 2θ values of 18.5°, 29.9°, 42.9°, and 54.2° correspond to (111), (220), (400), and (422) planes, whereas strong reflections observed at 35.0°, 57.12° and 63.50° correspond to (311), (511), and (440) planes, respectively. The crystallite size of NMO was further calculated with the help of Scherrer's formula t = 0.9λ/βcosϴ by taking most intense peak (311) plane [30]. Here β is the full width half maxima (radian), ϴ is the scattering angle of most intense peak and λ is the wavelength of Cu-Kα radiation [27]. The average crystallite size (t) is calculated by Scherrer equation to be 8.73 nm.
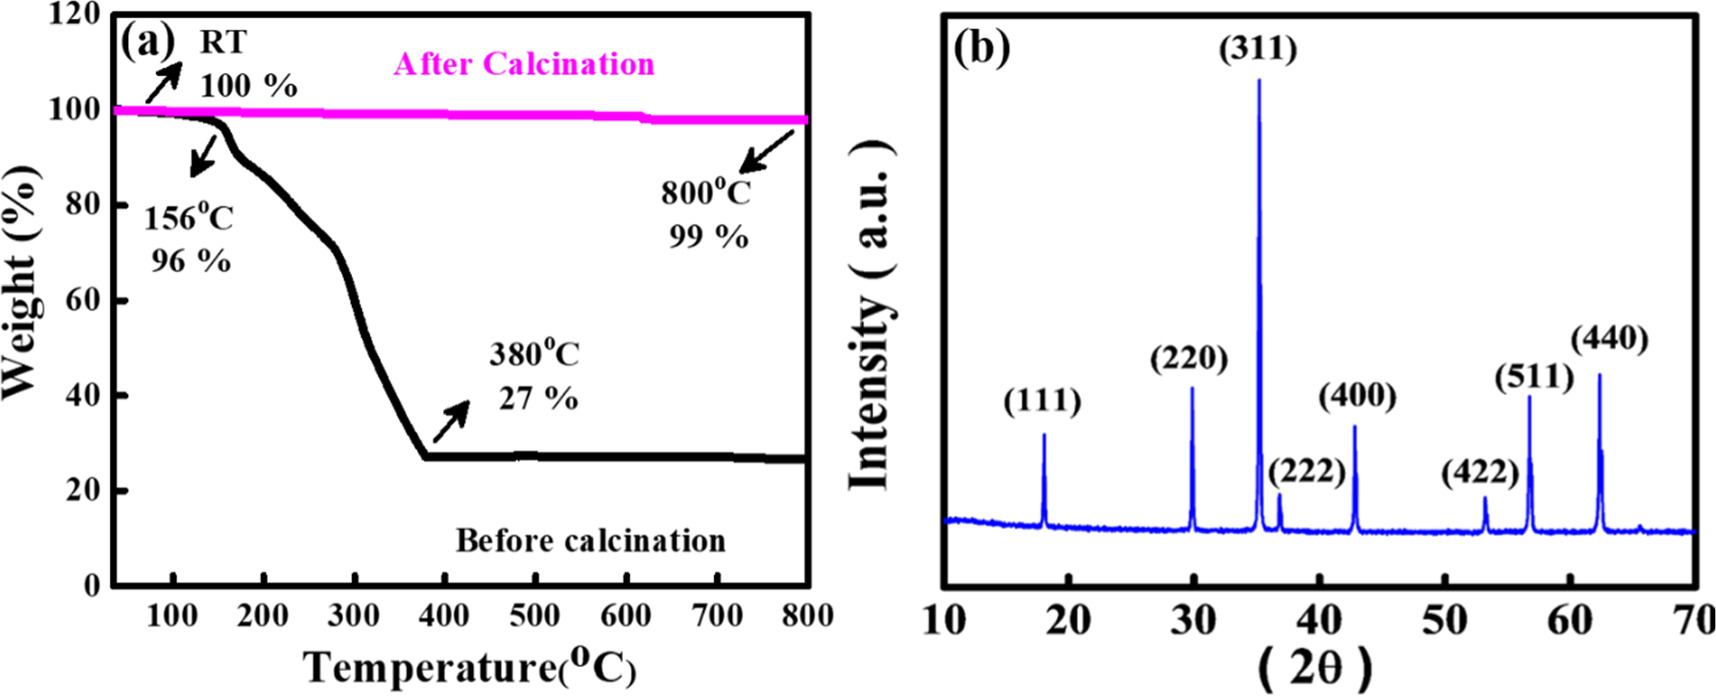
Figure 2. (a) TGA of NMO before and after calcination with temperature (b) x-ray diffraction pattern of the NMO.
Download figure:
Standard image High-resolution imageFurther, the morphological examination is performed via FESEM. It is well-established that enhanced electrochemical performance is attainable when the electrode comprises a substantial proportion of poorly crystallized compounds. Since crystallized structures exhibit increased interlayer spacing and pore volume. It facilitates the facile insertion of electrolyte protons and cations. This increases the interfacial reaction area between the electrolyte and electrode active material.
Figure 3 presents a typical top-view surface morphology of NMO, as observed through FESEM. It reveals the formation of spherical nanoparticle structures. These NMO nanoparticles are anticipated to exhibit an exceptional morphology with a high surface area and stable structure. As a result, they hold the promise of yielding a substantial specific capacitance by virtue of the facile accessibility of active materials during the redox processes at the interface. Figure 4(a) shows the case of the N2 adsorption/desorption isotherm of NMO nanoparticles. The presence of a marked hysteresis loop in the isotherm strongly indicates the existence of mesopores formed among the particles. The specific surface area of NMO stands at 66.2 m2 g–1, with the pore falling within the size range of 4 nm to 8 nm, as delineated in figure 4(b).

Figure 3. FESEM micrograph of NMO.
Download figure:
Standard image High-resolution image
Figure 4. (a) Nitrogen adsorption—desorption isotherms and (b) pore size distribution plots for NMO.
Download figure:
Standard image High-resolution image3.2. Electrochemical analysis
The CV technique is employed to assess the electrochemical double-layer capacitor (EDLC) behavior of nanoflakes of material NMO in a conventional supercapacitor cell. To check the suitable voltage window and appropriate electrolyte we have performed CV analysis of NMO electrode at a scan rate of 3 mV s−1 in KOH, LiOH, Na2SO4, and H2SO4 which is shown in figure 5. From this analysis, we have found that KOH shows highest capacitance in comparison of other electrolytes. The calculated capacitance for all these are shown in the table 1.
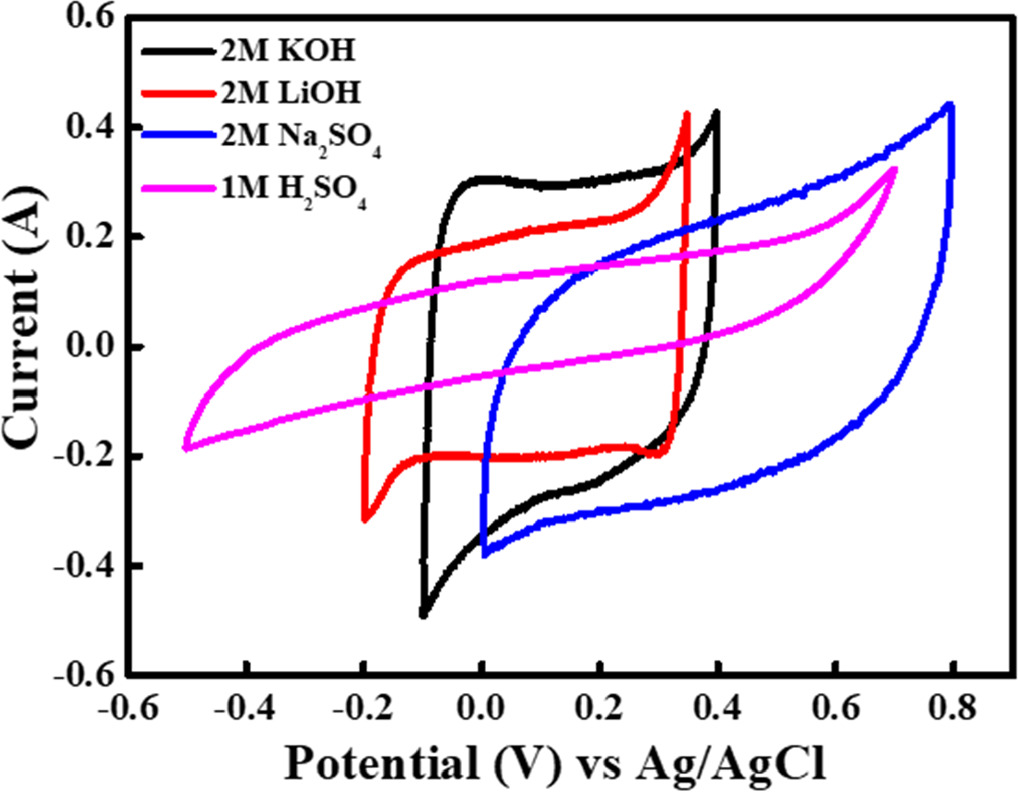
Figure 5. Cyclic Voltammetry analysis at 3 mV s−1 at various electrolytes.
Download figure:
Standard image High-resolution imageTable 1. CV analysis at 3 mV s–1 scan rate at various electrolytes.
| Electrolyte | Capacitance (F g–1) |
|---|---|
| 2M KOH | 132.6 |
| 2M LiOH | 119.9 |
| 2M Na2 SO4 | 121.4 |
| 1M H2 SO4 | 97.1 |
Further the whole analysis of CV is conducted within a potential range of −0.1 to 0.6 V, using a 2 M KOH solution behaving as an electrolyte at various scan rates. This is depicted in figure 6(a). Notably, all the CV curves exhibited an almost ideal symmetric rectangular profile. The specific capacitance values for the conventional supercapacitor cell are determined to be 131.10, 75.81, 66.52, 53.75, 42.65, and 30.56 F g−1 at scan rates of 3, 5, 10, 25, 50, and 100 mV s−1, respectively, as illustrated in figure 6(c). This observed EDLC behavior can be attributed to the aggregation of ions on the electrode surface. The presence of substantial open pores and porous diffusion channels in the architecture serves as an ion reservoir. This ensures a consistent supply of OH− ions and facilitates rapid and effective electrolyte access to each active site on the electrode, at high rates.
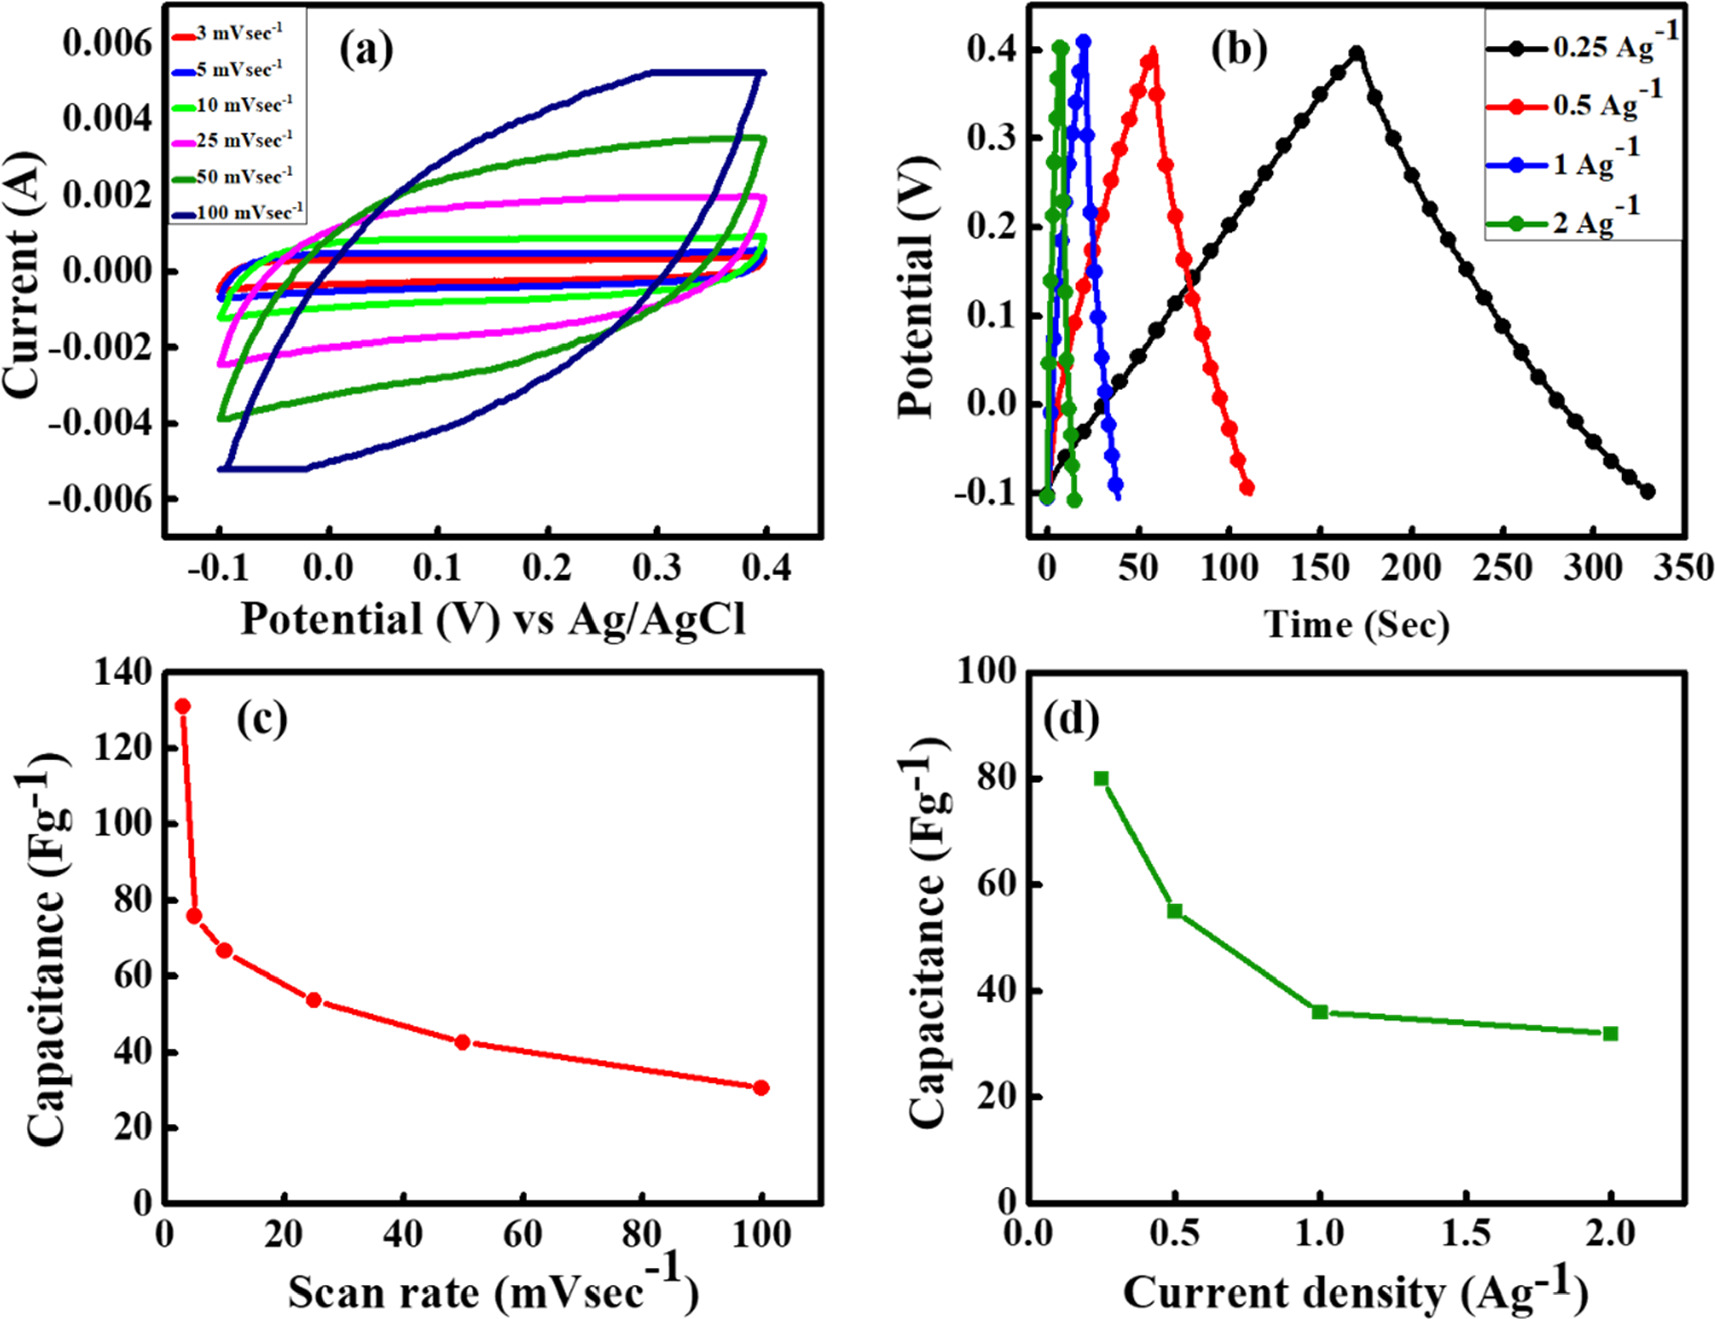
Figure 6. (a) CV curves for NMO in 2 M KOH obtained at different voltage scan rates (b) GCD curves obtained at different current densities (c) Specific capacitance versus voltage scan rate plot. (d) Specific capacitance versus current density plot.
Download figure:
Standard image High-resolution imageConsequently, it enhances the adsorption promoting efficient energy storage [27, 31]. The enhanced electrochemical performance of the electrode may be attributed to differences in the individual electronic transitions of Mn2+, Mn3+, Ni2+, and Ni3+, or a combined effect involving the transition states of Mn2+/Mn3+ and Ni2+/Ni3+, which are strongly influenced by the unique morphology and crystallinity. It is evident that specific capacitance decreases with an increase in the scan rate, a phenomenon attributed to the reduced utilization of active material sites at higher scan rates [31].
Rate capability is a critical factor in assessing the suitability of supercapacitors for power-related applications. GCD analyses are conducted for the supercapacitor cell assemblies to evaluate the charge storage capacity, cycling durability, and various electrical parameters at current densities of 0.25, 0.5, 1, and 2 A g–1. Figure 6(b) displays the typical charge–discharge profiles for these conventional supercapacitor assemblies of NMO as the electrode material in a 2 M KOH aqueous solution. In this analysis, a voltage range of −0.1 to 0.4 V is employed to assess the supercapacitive performance. It is noteworthy that the charge–discharge profiles deviate from the standard linear voltage-versus-time variation commonly exhibited by EDLCs. The specific capacitance of the electrode from GCD is calculated using equation (2) and the calculated value of capacitance at 0.25 A g–1 current density is 80 F g−1. Moreover, with the increase of current density the capacitance tends to decrease and follow the same pattern as the capacitance follows in CV with scan rate. The reason behind is same as in the CV. Basically, it signifies that at slower current density, more OH− ions can infiltrate inside the electrode pores at a longer time scale as low scan rate gives sufficient time for the ions migration.
However, it should be noted that these graphs (CV and GCD) do not exhibit the typical behavior of an EDLC (Electric Double-Layer Capacitor) curve. Instead, they demonstrate a combination of EDLC and pseudo supercapacitor. Although literature suggests that the behavior of any electrochemical supercapacitor can be figured out on the basis of their charge storage mechanism (charge adsorption/charge transfer through redox reaction) by which one can easily determine whether the graph contributes more towards double-layer and/or pseudo-capacitance contribution. In this regard, the current measured from the CV graph can be plotted with respect to the scan rate (refer figure 7(b)) using power-law equation [32].

Here a and b are the adjustable constants where the value of b is evaluated from the linear curve of log I versus log V (as shown in figure 7(a)) and distributes information about whether the process is surface controlled (b = 1.0) or if it is occurring through intercalation/de-intercalation (when b = 0.5). Here the calculated value of b for NMO is shown in the inset of figure 7(a). However, the b value is in between 0.5 to 1.0 which means that NMO electrode shows mixed control storage. In order to estimate the contribution of capacitive and diffusive controlled processes from the total current, the following equation can be utilized [33, 34]

where  and
and  represents the capacitive and diffusive moderated storage, respectively. To calculate contribution in an easier way, equation (6) is rearranged in the following manner,

The values of  and
and  are calculated from
  versus
  plot by using slope and intercept of the linear fit for each sample (illustrated in figure 7(c)). After putting these values of
  and
and  in equation (7), one can calculate the quantitative contribution of surface-controlled and intercalation-controlled current to the overall current at a specific scan rate. The percentage of EDLC and pseudo-controlled contribution for NMO at various scan rates is well presented in figure 7(d) and table 2, respectively. From all the results, it is clear that as the scan rate increased, pseudocapacitive behavior turned to EDLC. This may be due to the fact that the interaction between the electrode surface and the electrolytic ions decreases as the scan rate is increased.

Figure 7. (a) log–log plot of current versus scan rate, (b) current measured from cyclic voltammetry versus scan rates, (c) I/ν1/2 versus ν1/2 plots and (d) Bar graph representation of EDLC and pseudo contribution of NMO electrode with scan rate.
Download figure:
Standard image High-resolution imageTable 2. A comparative study of EDLC and pseudo controlled contribution of NMO electrode.
| Scan rate (mV s−1) | NMO electrode | |
|---|---|---|
| EDLC (in %) | Pseudo (in %) | |
| 3 | 33.88 | 66.12 |
| 5 | 39.81 | 60.19 |
| 10 | 48.33 | 51.67 |
| 25 | 59.66 | 40.34 |
| 50 | 67.65 | 32.35 |
The EIS data is analyzed via Nyquist plots. They portray the frequency response characteristics of the electrode/electrolyte system. As illustrated in figure 8, the Nyquist plots of before and after measurements exhibited a common pattern, featuring a semicircular at high frequencies. As the frequency decreases, there is a gradual transition to linearity following this. Notably, these plots also exhibit a slope of approximately 45° at lower frequencies, which is indicative of a characteristic element known as Warburg impedance. This distinctive behavior is attributed to the frequency-dependent nature of ion diffusion and transport within the electrolyte [35]. Impedance measurements serve as a valuable means to extract essential information pertaining to the equivalent series resistance (ESR) and the maximum power density (Pmax) of a supercapacitor. The point of intersection of these plots at the x-axis corresponds to the ESR of the electrode. ESR is a critical parameter that governs the charge–discharge rates of the electrode. The complex plane impedance plots for NMO at various potentials are depicted in figure 8. The deviation from the linear trajectory along the imaginary axis signifies the non-ideal polarization nature of the electrode, which indicates its dependence on the scan rate. The calculated ESR before and after the experiments is 6.73 ohm and 7.96 ohm, respectively. This reduction in resistance is attributed to the contraction of the depletion layer present at the electrode–electrolyte interface.

Figure 8. Nyquist plot obtained for as prepared NMO electrode (after 500 GCD cycles).
Download figure:
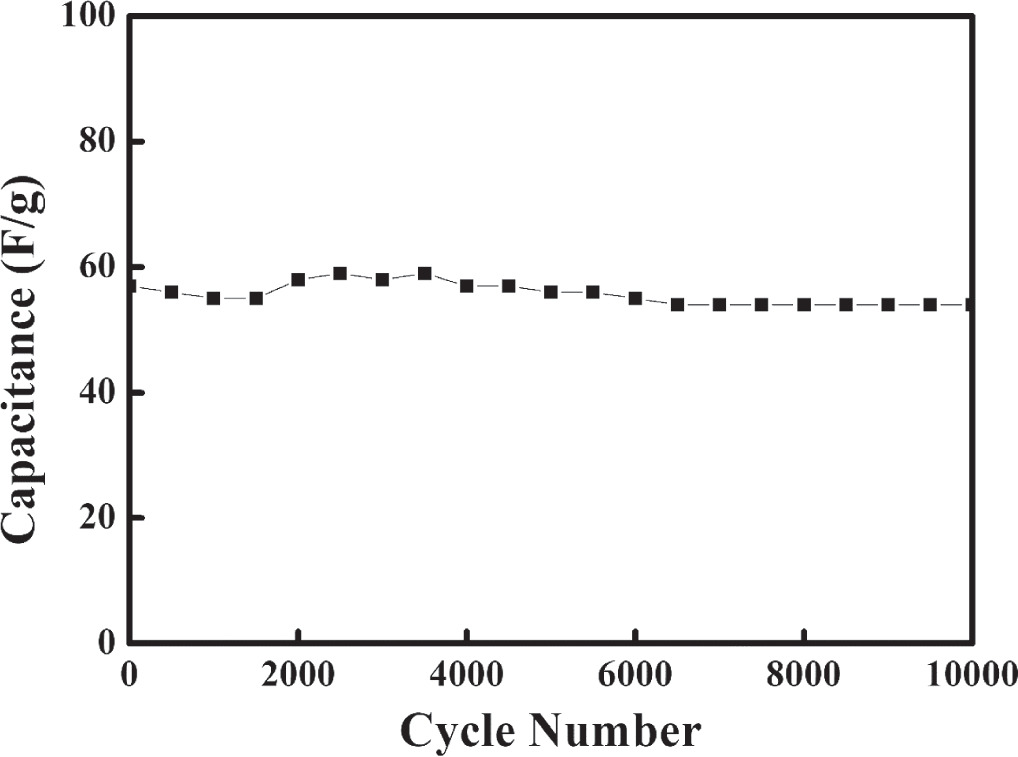
Standard image High-resolution imageIt is worth noting that the decrease in resistance is primarily ascribed to the NMO interface, which can be attributed to two primary factors: firstly, an enhanced charge accumulation at the electrode–electrolyte interfaces, and secondly, an augmentation in the effective surface area. The response of EIS with regard to the capacitive behavior of symmetric NMO can be delineated as follows: at high frequencies, the magnitude (Z) remains independent of frequency, and the phase angle is notably small. In the intermediate frequency range, the ion diffusion processes occurring within the pores of the NMO nano-flakes framework significantly contribute to the capacitive behavior. Finally, in the low-frequency regime, the behavior transitions towards that of a pure capacitor. The energy density (E) and power density (P) of NMO supercapacitor electrode are calculated using the equations (4) and (5) which are 10 Wh K−1 g−1 and 223 W K−1 g−1, respectively. Figure 9 shows that NMO electrodes maintain consistent and reliable performance throughout 10000 cycles of charging and discharging. This indicates the stable and long-lasting behavior of NMO electrodes, making them a promising choice for energy storage applications.
Figure 9. Capacitance measured for 10000 charge–discharge cycles.
Download figure:
Standard image High-resolution image
4. Conclusions
This work reported the successful synthesis of NMO nanoparticles with well-defined morphology via the urea combustion method. Their crystalline nature has been corroborated through x-ray diffraction analysis. The achieved high capacitance coupled with excellent cyclability underscored the promising suitability of NMO as a compelling material for supercapacitor electrode applications. Specifically, the material exhibited a notable specific capacitance of 131 F g−1 at a scan rate of 3 mV s−1, in conjunction with high values of specific power and specific energy, measured 223 W kg−1 and 10 Wh kg−1, respectively. While the reported capacitance and cyclability showcase the potential of NMO as a supercapacitor electrode material, however the long-term stability is under extended cycling conditions. More research in this area could look into how to improve the synthesis method to make the structural and electrochemical properties of NMO better, which could lead to even higher capacitance values and better cycling.
Acknowledgments
The authors extend their appreciation to the Deputyship for Research & Innovation, Ministry of Education in Saudi Arabia for funding this research work through the project number ISP23–104.
Data availability statement
The data cannot be made publicly available upon publication because no suitable repository exists for hosting data in this field of study. The data that support the findings of this study are available upon reasonable request from the authors.
Declaration of competing interest
The authors declare no conflict of interest.