

Abstract
Photocatalytic degradation failure is a significant environmental pollution problem. Therefore, this article emphasizes the in-depth photocatalytic degradation of methylene blue (MB) by UV light irradiation using ZnO photocatalysts nanoparticles every 30 min of a time interval and examines the improvement in the irradiation period. The sol-gel co-precipitation route produces the photocatalyst ZnO nanoparticle to eliminate MB dye. The characterization studies of ZnO photocatalysts are explored by x-ray diffraction, scanning electron, and UV visible spectroscopic techniques. The XRD study elucidates a lesser crystallite size of the order 24.71 nm with a small microstrain, and dislocation density boosts the ZnO nanoparticle to act as dilapidation of 10 ppm of MB colourant. The SEM photographs of Zinc oxide nanoparticles reveal the nanospeck dimension of 32 nm. The EDX and Elemental mapping explore the composition of the ZnO photocatalyst. The syntheses of ZnO nanoparticles have low overpotential for HER (Hydrogen Evolution Reaction). A very low slope of 41.2 mV/dec represents the Volmer-Tafel mechanistic pathway for the HER process. Chronopotentiometry was conducted, and the amount of hydrogen collected during these experiments was 21 ml for the ZnO nanoparticles.
Export citation and abstract BibTeX RIS
1. Introduction
For many years, despite many environmental regulatory acts, the textile industry's pollution towards the environment has become a significant problem [1, 2]. The textile industry's wastewater contains approximately ca. 30%–40% residual dye released into the Earth's surface before proper care. This fabric colouring can be extraordinarily carcinogenic and mutagenic, containing organic and inorganic salts, heavy metals, and corrosive acids [3, 4]. Synthetic dyes have complex molecular structures and are typically difficult to degrade in water. Diverse water treatment techniques like flocculation, coagulation, purification, and ion altercation extract residual colourants starting treated water to resolve health issues. An aromatic heterocyclic chemical is known as methylene blue (MB). Cotton, wool, and silk are frequently dyed using a cationic dye known as MB. The base and this dye do not mix because of their stability. The negative consequences of this dye's presence in wastewater might include eye burns, nausea, vomiting, diarrhoea, and other unpleasant symptoms. Inhalation and skin contact with it both have the potential to be toxic. As a result, removing such dangerous dye from industrial wastewater is important before it contaminates the neighbouring freshwater streams [5, 6]. Many methods are introduced, but high running costs are less desirable, unrealistic, and highly economical [7]. Out of the techniques mentioned above, photocatalysis is a prominent method for reducing dyes in residual water [8]. The procedure involves a lot of potential highly intense photo irradiation and an appropriate oxidizing agent to produce a neutral form of the hydroxide ion, as oxidation is the key mechanism. The coupling of electrons and holes is replenished by obliterating the photocatalytic activity employing highly energetic illumination to create hydroxyl radicals liable for dye degradation. Out of many nanoparticles, Titanium oxide (TiO2) remains the superlative photo catalyst to convert a comprehensive variety of pollutants to CO2 and H2O [9, 10]. Apart from these, TiO2 also have some exceptional features such as good electric, photo absorbing properties, conduction characteristics, and is highly economical. Nevertheless, the precincts of TiO2 [11] include the reduced activity in the visible range of the electromagnetic spectrum, the extraordinary recombination rate i.e., pairing of electrons and holes under the presence of visible light, in their recuperation and reutilization having shortened stability, and is carcinogen to humans [12].
Many metal oxide nanoparticles have been synthesized and used in diverse applications such as in the field of medicine, energy, textiles, etc [13–23].
The synthesis of different semiconductor nanoparticles for removing textile pollutants from wastewater has emerged as one of the most interesting research areas in recent years. The excitation of electrons from the valence band to the conduction band, which produces electrons and holes, occurs when the semiconductor nanomaterial absorbs more energy than its bandgap energy. While the electron combines with oxygen molecules to produce superoxide radicals, the valence band holes react with water molecules and hydroxide ions to form hydroxyl radicals. These free radicals are potent organic dye oxidizers that may target and break down organic colours into CO2 and H2O. In this view, Zinc oxide (ZnO) is a promising semiconducting nanomaterial for degrading dyes because of its versatile properties such as the large energy gap order 3.36 eV, photosensitivity, high thermal stability, low cost etc [24–26]. The irradiation of UV photons on the ZnO nanoparticles stimulates the conduction band to occupy an electron out from the top of the valence band leaving behind the positive charge holes. The generated electron-hole duos interact with H2O and O2 to create volatile oxygen classes. This photon-induced electron-hole pair also generates reactive oxygen ion superoxide (•O2−), hydrogen peroxide (H2O2), dioxidene (1O2), and also it creates hydroxyl radical (•OH). Apart from these, the residual water's organic dyes are ultimately tarnished by the ZnO nanomaterial into the smaller non-toxic organic compound such as water and carbon dioxide by reducing the pollution in the wastewater.
Due to the depletion of conventional fossil fuels and the deterioration of the environment, methods for utilizing prospective clean, renewable energy sources must be developed. Hydrogen is a very effective and environmentally friendly energy medium because of its superior theoretical mass-energy density (120 mg kg1) and absence of greenhouse gas emissions [27–29]. With the help of stable catalysts, hydrogen can be produced electrochemically from water effectively. It is essential to enable cost-effective, large-scale practical applications [30].
The efforts to combine the characteristics of semiconductor nanostructures with suitable materials have significantly increased in recent years [31, 32]. Among several semiconductor oxide photocatalysts, anatase TiO2 has become a promising material for hydrogen synthesis because of its long-term durability for photo- and chemical corrosion [33, 34]. Numerous ZnO materials and gadgets from them have undergone extensive research and analysis [35–37]. Numerous ZnO nanostructures have been investigated for the electrochemical generation of H2 [38–41].
Due to the high cost of the procedure, only 4% of H2 was created by water electrolysis despite repeated attempts [42]. These are all caused by the significant energy losses in electrolysis, the absence of cutting-edge electrodes, and the main obstacles preventing the widespread application of water electrolysis. ZnO is one of the most significant photocatalysts because of its distinct optical property, low cost, and lack of toxicity. Its two main drawbacks are the quick recombination of photo-generated carriers and ZnO's poor responsiveness to visible light. Several techniques have been used to increase the ability of semiconductors to absorb light in the visible spectrum, including doping with a transition metal or non-metal ions, depositing noble metals and nanocarbon materials, and merging the semiconductor with another.
In this paper, we report the research study for synthesized ZnO catalyst photocatalytic analysis (PCA) to verify the photocatalytic factor's existence. Using the sol-gel co-precipitation method, ZnO nanoparticles are created. This sol-gel co-precipitation method is advantageous over other synthesis methods due to its low cost, quick storage, ambient operating temperatures, and large-scale production. Further, the photocatalytic degradation efficiency of the catalyst ZnO on Methylene blue (MB) pigment liquid was exposed to UV light each 30 min of time intervals. The profound value of 64.32% of degradation within 390 min explains the ZnO photo catalyst's degradation. These characteristics of ZnO nanoparticles as consistent photocatalytic material for the degradation of MB dye are expected to entice fabric manufacturing companies.
2. Materials and methods
2.1. Materials
The chemical reagents such as Zinc nitrate, Potassium hydroxide to synthesize the Zinc oxide (ZnO) nanomaterial are procured from Sigma Aldrich, Germany. In this preparation precursor is Zinc nitrate, and KOH act as a precipitating agent. The chemicals used for the preparation are of analytic grade and used without purification.
2.2. Synthesis of ZnO nanoparticles
The sol-gel co-precipitation method was used to synthesize ZnO nanoparticles. Deionized water dissolves 0.2 M of zinc nitrate and 0.4 M of KOH solutions. To a zinc nitrate solution that has been heated to 40 °C and held on a hot plate with stirring at 350 rpm for two hours, the KOH solution is added drop by drop until a white precipitate has formed. The deposit is further centrifuged at 4000 rpm, and residues are washed with distilled water until the filtrate's pH is neutral. Then the residue is calcinated at 450 °C for 4 h.
2.3. Photocatalytic degradation of methylene blue (MB) under UV (wavelength 250 nm) irradiation
MB photocatalytic degradation was performed using a circular container vessel mounted on the contrary side of the case. Photocatalytic analysis (PCA) experiments were performed to determine the photocatalytic property of the ZnO catalyst. A stock solution of the MB dye was established primarily, and 10 ppm of 250 ml was extracted for the analysis from that stock solution. 60 mg of the prepared ZnO photocatalyst was transferred to a circular reactor vessel with extracted dye concentration. The photocatalytic degradation efficiency of the catalyst ZnO on MB dye is analyzed through a UV–vis spectrophotometer (Shimadzu UV-2600) for a frequency range every 30 min intervals. The degraded proportion of the dye is explored using,

Where 'C0' represents the initial MB dye concentration whereas 'C' signpost to the concentration after irradiation, all analyses were performed at the natural pH (5 to 6) of the solution, SEM pictures of synthesized ZnO nanoparticles are explored using Hitachi S-4800-Type-IISEM, Hitachi High Technology Corporation.
2.4. Electrochemical studies
The electrochemical cell polarised the ZnO nanoparticles cathodically and was created to measure hydrogen quantitatively. The test electrode was made of ZnO nanoparticles produced using the sol-gel co-precipitation route, and the counter electrode was a platinum electrode with a large surface area. The reference electrode was a saturated calomel electrode (SCE). The current study's potentials are all presented in terms of SCE and converted to a typical hydrogen electrode (SHE).
Using computer-controlled electrochemical workstations (compactostat. h 10800 from Ivium Technologies, Netherlands), researchers investigated the electrochemical behaviour of ZnO nanoparticles in a 0.1 M KOH medium using linear sweep voltammetry and chronopotentiometry. The cell has a graded gas collector where the released hydrogen can refill the appropriate solution. The ability to relate the amount of gas released at a specific time for electrode materials placed at a specific current density is provided by this feature. Figure 1 shows the setup's schematic diagram.
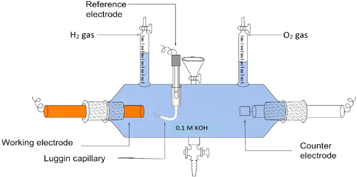
Figure 1. Tubular three-electrode glass cell used to measure the electrocatalytic activity of the ZnO nanoparticles in terms of H2 released on the surface of the electrode.
Download figure:
Standard image High-resolution image3. Experimental
3.1. XRD studies
Figure 2 fingerpost the XRD spectra of synthesized sol-gel ZnO nanoparticles. The diffraction peak witnessed at the 2θ = 31.9°, 34.43°, 36.26°, 47.41°0°, 56.57°0°, 62.86°0°,68.1°, 67.93°,69° and 72.7° incarnates the (100), (002), (101), (102), (110), (103), (200), (112), (201), and (202) the crystal plane of hexagonal wurtzite ZnO nanoparticles (ICDD file #98-002-9272) [43, 44]. The crystalline size of ZnO nanoparticles was calculated using the Scherer relationship [45] by using the full-width half limit (FWHM) of the peak intensity table 1,

Where 0.9 signpost shape factor, 'λ' represents the wavelength of the incident x-ray, 'β' is FWHM, and 'θ' is Bragg's diffraction angle. The microstrain generated are estimated using the relation for the ZnO nanoparticles [46],

The dislocation density (δ) generated inside the ZnO nanoparticle is obtained using relation [47],

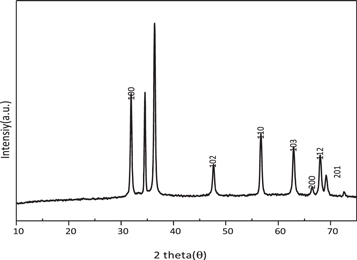
Figure 2. XRD pattern of ZnO nanoparticles.
Download figure:
Standard image High-resolution imageTable 1. Crystalline parameters of synthesized ZnO nanoparticles.
| CrystallitesizeD(nm) | Macrostrain ε (mm) | Dislocation density δ (1015 lines/m2) |
|---|---|---|
| 27.41 | 9.24 | 1.331 |
Thus lesser crystallite size with small microstrain and dislocation density boost the ZnO nanoparticle in MB (10 ppm) dye to act as a degradation of a particular pollutant.
3.2. SEM and TEM morphology of ZnO nanoparticle photo catalyst
The SEM images of the Synthesis ZnO nano photocatalyst are shown in figures 3(a), (b). A well-separated and homogenous continuum is seen in the SEM picture of ZnO. The synthesized ZnO signpost mixed form bearing spindle shape and flattened spherical morphology particles. The average grain size estimated by the Image J program's SEM micrographs is approximately 32 nm [48]. From the SEM picture, the nanoparticle's dimension detected almost approaches the size measured in XRD analysis. The reduced ZnO photocatalyst particle diameter having a large surface area symbiotically facilitates MB (10 ppm) dye degradation. The TEM image is shown in figures 3(c), (d), which shows some white flake-like structures.
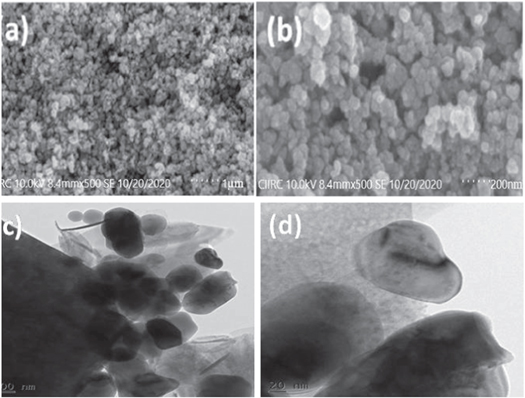
Figure 3. (a), (b) SEM images (c), (d) TEM images of synthesized ZnO nanoparticle.
Download figure:
Standard image High-resolution imageEDX spectrum exposed the presence of Zn, C, and O elements. No elemental impurity was spotted in the ZnO spectrum, signposting the synthesized ZnO nanomaterial purity. Figure 4 explores the compositional analysis peaks of ZnO nanomaterial by EDX characterization. Elemental mapping of the composition of synthesized ZnO nanoparticles is analyzed employing SEM. Figure 5 confirms the elemental mapping in various colours, such as Zn (green), O (red), and C (grey), respectively.
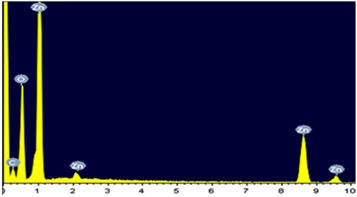
Figure 4. EDX analyses of ZnO nanoparticles.
Download figure:
Standard image High-resolution image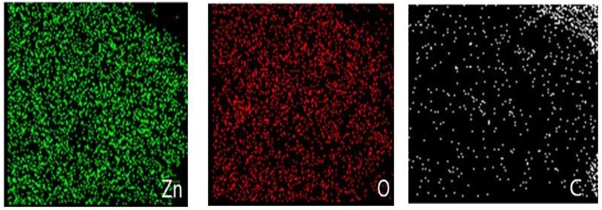
Figure 5. Elemental mapping of synthesized ZnO nanoparticle.
Download figure:
Standard image High-resolution image3.3. UV absorption studies
The UV absorption spectra of the sample signpost the excellent absorption efficiency of UV light. The electron's optical transmission change achieved a very well-excitonic absorption peak from the valence to the conduction band [49]. Using the absorption peak, the optical bandgap energy (Eg) of the sample is obtained using the relation,

Where 'h' is Planck's constant, 'c' represents the velocity of light and 'λ' signpost the wavelength of light used.
Figure 6 shows the UV absorbance spectra of MB (10 ppm)/ZnO under UV light. The observation in figure 6 suggests the rise in UV light's irradiation period reduces the solution's optical energy gap. The absorbance data attained from UV-Visible spectroscopy provides the value of absorption coefficient 'α' concerning photon energy by the following equation,

Where A is absorbance and d is the thickness of the prepared sample. Classical Tauc's expression identifies the relation with the absorption coefficient α and the optical band gap Eg. The UV–visible absorption spectra's translation into Tauc's plot gives the optical energy bandgap's value. Thus, the absorption spectrum is translated into Tauc's plot by considering the frequency-dependent absorption coefficient assumed by Mott and Devis [50].

Where β is a constant and the exponent r is an empirical index. The value of r = 2, 1/2, 2/3 and 1/3 corresponds to indirect, direct, indirect forbidden and direct forbidden allowed transition responsible for optical absorption in the quantum mechanical sense. The linear nature of the curve is obtained by plotting a graph of the product of absorption coefficient with photon energy (αhν) 0.5 versus the photon energy (hν) at room temperature shows the MB (10 ppm)/ZnO allows only an indirect transition. The optical energy bandgap (Eg) estimation is achieved by extrapolating a linear portion of the curve to a point (αhν) 0.5 = 0. Here, the allowed indirect transition is considered between the valence and conduction bands.
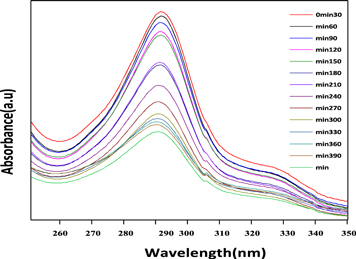
Figure 6. Absorbance spectra of degradation of MB by using ZnO as a catalyst.
Download figure:
Standard image High-resolution imageFor t = 0 min, the optical energy gap value of Eg = 3.28 eV, and as time progresses for t = 390 min, Eg = 3.22 eV decreases. For instance, ZnO interacts with MB dye molecule, and h+ on the surface reacts with OH− or H2Ogenerating hydroxyl radical. Similarly, e− interacts with O2 forming O2−. These OH and O2− active species interact and oxidize the organic pollutants to carbon dioxide and water [51]. The enhancement in the irradiation period leads to a lesser energy gap, thereby creating a concentration of h+ and e− by enhancing ZnO's photocatalytic performance.
3.4. Photocatalytic degradation of methylene blue (MB)
The Photocatalytic activity (PCA) of ZnO nanoparticles for the degradation of MB is performed for UV irradiation for every interval of 30 min. Exploits the variation of concentration ratio C with irradiation co time of MB (10 ppm) in the presence of ZnO photocatalyst. It is observed that as the irradiation time advances, the oxidization of the pollutant also enhances. For irradiation time 390 min, the concentration ratio CCo reaches 0.356768 values with 64.32% degradation signposting the enhancement in the photocatalytic performance of ZnO. Figure 7 exposes the rapport between C and irradiation time' in addition to the linear relationship of degradation of MB, which resembles the first-order kinetics of response [52, 53]. The initial linear portion of the curve observed in figure 6 symbolizes the absorbing capacity of MB dye on the exterior of ZnO nanoparticles (photocatalyst), which further destroys the dye into intermediate yields. It is observed that from figure 6, 50% of MB dye got degraded within 249 min.
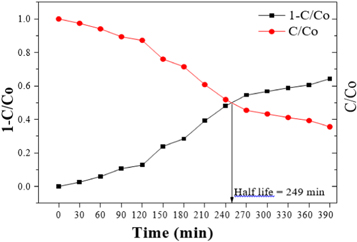
Figure 7. Half-life plot of MB (10 ppm)/ZnO nanoparticle.
Download figure:
Standard image High-resolution imageAdditionally, the second upper half of the curve in figure 6 corresponds to the transformation of intermediate yields into colourless products. Above 250 min of irradiation, the half-life plot for ZnO photocatalyst under UV light is for MB's decolourization. Figure 7 suggests that within 390 min, about 64.32% of the dye is degraded by the ZnO photocatalyst figure 8.
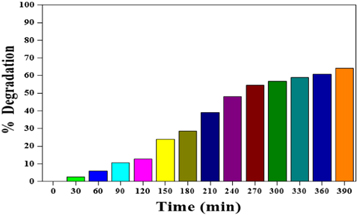
Figure 8. Percentage Degradation of MB (10 ppm) by using ZnO.
Download figure:
Standard image High-resolution imageThe deterioration of the MB dye could be due to the function of the photocatalytic process suggested below. The dye is accumulated on the catalyst surface to preserve the adsorption/desorption equilibrium without light. The moment dye absorbs the UV photons that ignite the electrons (e−) to occupy the conduction band (CB) from the top of the valence band (VB), producing vacancies (holes, h+) in the valence band (VB). The VB-produced h+ has extraordinary oxidative potential, which creates direct organic molecule/ion oxidation to hydroxyl radicals. These hydroxyl radicals support the degradation of the organic substrate. Thus, the interaction of h+ with H2O and OH− ions or the interaction of O2 and e− leads to the formation of hydroxyl radicals. This superoxide radical delivers an impulse to degrade the MB dye.
To conclude, the dye's interaction by the production of radicals which breaks the dye molecules to get the decolorization property [54]. The photocatalytic activity (PCA) results also show that the 10 ppm of methylene blue dye (MB-10 ppm) concentration decreased by only 2% in the dark condition using the ZnO catalyst. This suggests weak adsorption of the dye molecules on ZnO. In the absence of ZnO, the MB dye concentration decreased by about 1% after 1 h of UV light irradiation. This indicates that only photolysis cannot degrade the dye completely. Therefore, the reduction of dye concentration is primarily caused by the photocatalytic reaction.
The observation of photo activity in the presence of visible light is also attributed to an electron density transfer by the excited electrons in π* states formed after irradiation on the photo sensible ZnO nanoparticles in 10 ppm of MB [55]. Photocatalytic recycling experiments suggest the reusability performance and stability of ZnO photocatalysts. After each run, the photocatalyst was recycled by systematically water showering and drying at the appropriate temperature. For successive repetitions, a portion of decolourization remains intact, and a minor significant change was witnessed in the percentage of decolorization in the following cycle. As a result of various tests, it could further have concluded that the photocatalytic activity of ZnO proved steadily suitable to be employed in comparable circumstances.
3.5. Effect of catalytic dose
Using a dye solution with a pH of 7 and a concentration of 5 ppm, figure 9 demonstrates the effect of catalytic dosage varying from 10 to 40 mg on the photodegradation of methylene blue dye for ZnO nanoparticles. The obtained results show that raising the catalyst dose increases the ability to degrade up to 30 mg of ZnO nanoparticles due to the number of active sites on the surface growing as the catalytic load increases, resulting in increased methylene blue dye absorption, but in the 40 mg of catalytic lode, there is a decrease in the photocatalytic activity due to the formation of turbidity due to more amount of catalyst and blocking of the active sites.
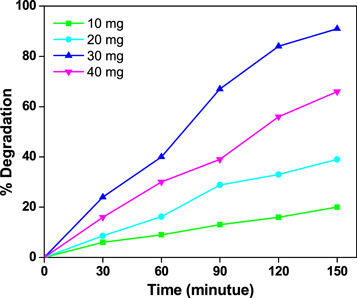
Figure 9. Photocatalytic degradation of MB with different catalytic load of ZnO nanoparticles.
Download figure:
Standard image High-resolution image3.6. Effect of dye concentration on photocatalytic degradation
Figure 10 shows the influence of dye concentration varying from 5 to 20 ppm of dye while keeping the catalyst concentration at 30 mg at pH 7. Because dye molecules are present on the catalyst's surface, degradation ability decreases as dye concentration rises. Because increased dye concentration lowers light penetration, the active sites of the catalyst decline, resulting in a slower degradation rate. As a result, a 5 ppm dye solution has stronger catalytic activity than a larger concentration.
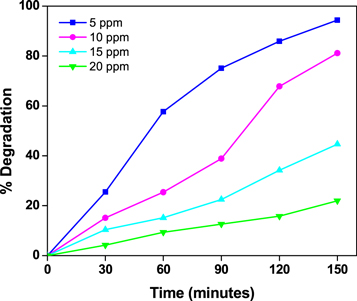
Figure 10. Photocatalytic degradation for different concentrations of MB dye under UV-light with ZnO nanoparticls.
Download figure:
Standard image High-resolution image3.7. Effect of pH on photocatalytic degradation
The effect of pH on the photocatalytic degradation of methylene blue for ZnO nanoparticles is shown in figure 11. As a result, it may be stated that the basic medium is pH-12 has greater photocatalytic degradation ability than acidic media. This study closely resembles the papers mentioned. The surface properties of ZnO are changed when the pH changes, which increases the dissociation of organic dye. A greater amount of hydroxyl radicals are produced at higher pH, resulting in an increased breakdown.
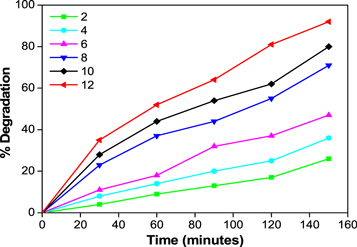
Figure 11. Photocatalytic degradation of MB at by varing pH (2–12 pH) by using ZnO nanoparticles.
Download figure:
Standard image High-resolution image3.8. Effect of scavenger studies on the photocatalytic degradation
Various scavengers were used to identify active species that evolved during the degradation process. During the procedure, tetra butyl alcohol (TBA) was utilized as an (OH°) scavenger, ascorbic acid (AA) as an O2− scavenger, ethylene diamine tetra acetic acid (EDTA) as an H+ scavenger, and potassium dichromate (K2Cr2O7) as an e-scavenger. In the presence of the scavengers, a 5 ppm dye solution was used in the reaction. Figure 12 demonstrates that the AA scavenger causes 89 percent photodegradation, EDTA causes 85 percent photodegradation, K2Cr2O7 causes 82 percent photodegradation, and the TBA scavenger causes 89 percent photodegradation. The lack of e−, i.e., K2Cr2O7 as a scavenger, results in a lower degradation percentage, as seen in the above data. As a result, electrons are the most important species in photocatalytic degradation.
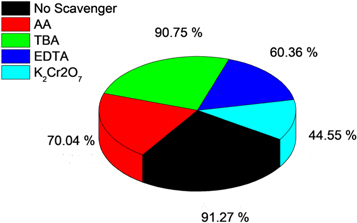
Figure 12. Photocatalytic activity of the ZnO nanoprticles for the degradation of MB in the presence of different scavengers.
Download figure:
Standard image High-resolution image3.9. Kinetics study on photocatalytic degradation
A kinetic investigation of photocatalytic degradation of methylene blue was performed, as shown in figure 13. These nanomaterials followed the pseudo-first-order rate rule for dye degradation, and the rate constant was calculated using.

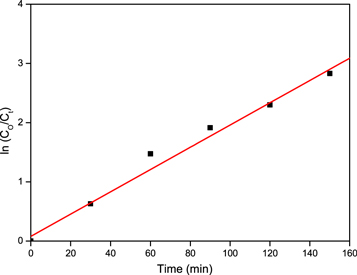
Figure 13. Rate constant of MB in the presence ZnO nanoparticles.
Download figure:
Standard image High-resolution imageThe rate constant for ZnO nanoparticles was calculated to be around 1.379 × 10⁻² min−1. The dye concentration was 10 ppm, the pH was 5, and the catalytic dose was 100 mg/100 ml.
4. Hydrogen evolution reaction
4.1. Linear sweep voltammetry
As illustrated in figure 14, the electrocatalytic activity of ZnO nanoparticles was initially assessed for H2 evolution in a basic media. The hydrogen evolution reaction in ZnO nanoparticles is good. ZnO produced by the sol-gel co-precipitation technique exhibits an extremely low hydrogen evolution overpotential, with an overpotential comparable to pure Pt for HER. The sample of ZnO nanoparticles exhibits a 0.55 A cm−2 current. These outcomes attest to the sample's superior performance. It was anticipated that ZnO nanoparticles made using the sol-gel co-precipitation approach would have a high HER activity level. In fact, with the sample produced using this technique, the synthesized ZnO electrode showed a catalytic start at almost zero overpotential and the catalytic current surged quickly. Further cathodic sweeping revealed vibrant H2 bubble growth and discharged from the surface [56].
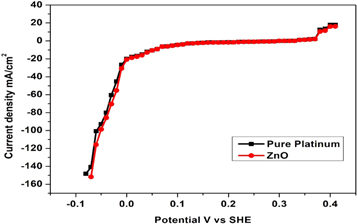
Figure 14. LSV curves for HER on the surface of the ZnO nanoparticles.
Download figure:
Standard image High-resolution imageTafel plots were used to assess the catalytic activity of ZnO nanoparticle electrocatalysts, as seen in figure 15. The Tafel slopes shed light on the HER process's mechanism. Electrocatalytic HER's kinetics parameter is expressed in terms of either the Volmer-Tafel or Volmer-Heyrovsky mechanistic pathways. Table 2 displays the 38.0 and 43.2 mV/dec Tafel slopes for pure platinum and ZnO nanoparticles. ZnO nanoparticles' extremely low Tafel slope of 43.2 mV/dec indicates improved electrocatalytic performance, comparable to that of the pure platinum electrode. The desorption of hydrogen atoms is the rate-determining step in the Volmer-Tafel reaction, according to the low Tafel slope of 41.2 mV/dec [57, 58].
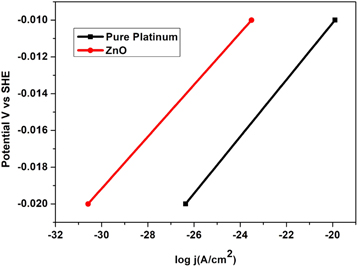
Figure 15. Tafel plots for various electrodes in 0.1 M KOH.
Download figure:
Standard image High-resolution imageTable 2. The Tafel slopes obtained for the different electrodes.
| SL. no. | Electrode sample | Slope value mV/dec |
|---|---|---|
| 01 | Pure Platinum | 38.0 |
| 02 | ZnO nanoparticle | 43.2 |
4.2. Chronopotentiometry
When applied for a considerable amount of time, the simplest method to determine the electrodes' electrocatalytic activity is to monitor the electrode potential at constant current density. The chronopotentiometry investigation for the development of hydrogen on ZnO nanoparticles prepared using the sol-gel co-precipitation method was conducted for 36 000 s at a constant current of −0.35 mA cm−2. Figure 16 describes the chrono-potentiostats for the ZnO nanoparticles. The amount of H2 liberated in the first 180 s of this ZnO nanoparticle synthesis was measured to assess the electrocatalytic activity, as shown in figure 17. The HER potential of the electrodeposited catalysts is stable and consistent. The development of hydrogen bubbles on the electrode's surface is thought to cause these phenomena.
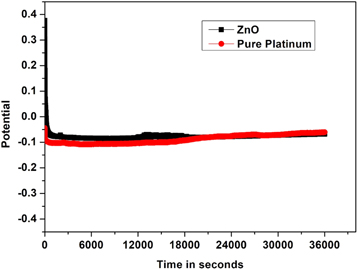
Figure 16. Chronopotentiometry curves measured in 0.1 M KOH.
Download figure:
Standard image High-resolution image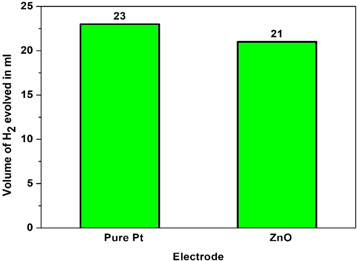
Figure 17. Volume of hydrogen liberated in first 180 s.
Download figure:
Standard image High-resolution image
Coating with uniform grain size and porosity gives more hydrogen evolution reactions. In electrolysis, formed hydrogen gas detached from the cathode only after it became bigger. During this time, contact between cathode and electrolyte was seized, reducing the hydrogen evolution. If the sample has more uniform pores, these gas bubbles avoid the ohmic resistance and enhance the catalytic activity of the coating [26]. It may be seen that the ZnO nanoparticles give more hydrogen evolution volume. This sample has more porosity with a uniform coating, enhancing the catalyst's hydrogen generation activity.
5. Conclusions
In this analysis, using ZnO nanoparticle photocatalysts synthesized employing the sol-gel co-precipitation method, MB dye is eliminated. The XRD studies elucidate lesser crystallite size of the order 24.71 nm with small microstrain, and dislocation density boosts the ZnO nanoparticle in MB (10 ppm) dye to act as a degradation of a particular pollutant. ZnO's SEM image explores the particle size of 32 nm, which matches with XRD results. The EDX and elemental mapping explore the chemical composition of ZnO nanoparticles. The UV visible absorption studies show for t = 0 min, the value of Eg = 3.28 eV also, as time progresses for t = 390 min, the value of Eg = 3.22 eV reduces. The UV absorption studies also explore the enhancement in the irradiation period, which leads to a lesser energy gap, thereby creating a concentration of h+ and e−, thus augmenting the photocatalytic performance of ZnO. Photocatalytic activity (PCA) results show that for irradiation time 390 min and the concentration ratio reaches 0.356768 values with 64.32% degradation signposting the enhancement in the photocatalytic performance of ZnO. The results of linear sweep voltammetry show that the potential of produced ZnO nanoparticles is zero and that pure platinum coatings produce higher current. The Volmer-Tafel reaction process for the HER is followed by small Tafel slopes, which confirm the effectiveness of the catalysts. Chronopotentiometry values, which provide a greater volume of hydrogen collection during electrolysis, once again validate the findings. This work has the potential to be made available commercially for industrial uses.
Acknowledgments
This work was funded by the University of Jeddah, Jeddah, Saudi Arabia, under grant No. (UJ-22-DR-78). The authors, therefore, acknowledge with thanks the University of Jeddah for its technical and financial support.
Data availability statement
All data that support the findings of this study are included within the article (and any supplementary files).
Funding
This work was funded by the University of Jeddah, Jeddah, Saudi Arabia, under grant No. (UJ-22-DR-78).