
Abstract
Fuzzy regression is an attractive application due to its ability to solve problems in the absence of accurate mathematical models. In this study, rheological properties of a bio-nanocomposite were predicted using fuzzy regression. The aim of study is to introduce the methodology and application of fuzziness in detail for handling uncertainty in the experimental data. In this context, rheological properties of green eggshell bio-nanocomposites are investigated using different operating parameters. Since the determination of surface tension is prone to experimental errors, a novel fuzzy-hybrid model is proposed in addition to a crisp model. Statistical error analysis is conducted to assess the validity of the multivariate models proposed. While both models provided satisfactory results, it is observed that the fuzzy-hybrid model outperforms the crisp model in both accuracy and generality. This study highlights that the proposed models have an impressive potential to be used for modeling experimental studies in nanotechnological manufacturing applications.
Export citation and abstract BibTeX RIS

Content from this work may be used under the terms of the Creative Commons Attribution 4.0 licence. Any further distribution of this work must maintain attribution to the author(s) and the title of the work, journal citation and DOI.
1. Introduction
Rapid and accurate prediction of properties of new materials is the main goal of computational materials science [1]. Before their development and production, the materials should sufficiently be modeled and analyzed [2]. This is especially important in manufacturing bio-based nanocomposites, where the surface properties depend on the nanostructure [3, 4].
Latterly, bio-based nanocomposites have received great interest from researchers since they procure several advantages such as being eco-friendly, low-cost, readily available, biodegradable, and biocompatible with large surface areas [4–6]. Materials with different biological origin such as plant, plant extracts, polysaccharides, lipids, proteins, biopolymers, and fossil species are observed to prefer to use the nanobiocomposites [7–9]. Also, numerous studies on the synthesis of nanobiocomposites have been conducted using green chemistry principles concerning sustainability [10–12]. With these advantages, nanobiocomposites, which possess exceptional properties, have been synthesized by considering special conditions such as preventing waste by using non-hazardous chemicals, designing safer chemicals, and enhancing energy efficiency at ambient temperature and pressure [13, 14]. Several methods including nanoemulsion, precipitation, sonochemical, hydrothermal, solvothermal, wet chemical route, and chemical vapor deposition have been used for the preparation of nanobiocomposites [15–17].
In this study, green κ-Carrageenan/PVA eggshell bio-nanocomposites (ES NCs) are prepared and the rheological properties of ES NCs using different mathematical models are examined. Additionally, the relation between surface tension and micelle concentration depending on the variables of concentration, mass fraction, the amount of surfactant, pH and temperature was investigated experimentally. The measurement of surface tension is susceptible to random (or indeterminate) experimental errors, indifferent from any experimental procedure that can be affected by external factors such as human intervention or measurement device sensitivity. While mathematical modeling the surface tension in a crisp approach is possible and applicable, the uncertainty in the imprecise data is lost during the process. However, by utilizing fuzzy regression, the error information may be represented in the output. This is possible since the errors are contained within the fuzzy coefficients [18]. Thus, this study aims to develop empirical models for the surface tension using fuzzy logic and regression analysis and shows that the fuzzy-hybrid modeling approach is superior to the conventional crisp approach. We have provided mathematical models derived from the experimental results. First, a crisp model is constructed in-line with the literature [19]. While the proposed crisp model satisfactorily represents the data, we observed that the surface tension was represented even more rigorously by the utilization of fuzzy regression. Thus, a novel fuzzy-hybrid model is constructed for the values below and above the critical micelle concentration value by using linear and fuzzy regression, respectively. The fuzzy-hybrid model enables the representation of the dataset to be more reliable. The statistical error analysis is conducted to assess the validity of the derived models. It is shown that the fuzzy-hybrid model outperforms the crisp model since the error information is also included in the output of the fuzzy-hybrid model and the constructed piecewise function represents the data more accurately. The novelty of this study was to investigate the effect of changing experimental optimization parameters (pH, temperature, concentration, and surface-active additives cetyltrimethylammonium bromide (CTAB)) on surface tension in green eggshell nanocomposites and to design a combination of fuzzy and conventional crisp modeling. The fuzzy-hybrid modeling approach was proposed for the first time in the literature, and its benefits to the modeling of rheological properties were discussed in detail. The constructed models are statistically compared with each other. Overall, this study improves the knowledge in characterization of the ES NCs and describes a novel modeling approach with superior properties. The results of this study provide more insight about the ES NCs and will be useful to researchers for advanced modeling of the rheological properties of any nanomaterial.
The organization of the paper is as follows. In section 2, the preparation and characterization of the ES NCs is explained, and the methodology of mathematical models are presented. In section 3, first the characterization of the nanobiocomposite is given. Then, the crisp and fuzzy-hybrid models are provided, and the statistical error analysis is conducted. Finally, the paper ends with the conclusions in section 4.
2. Materials and methods
2.1. Materials
White eggshells were obtained from a farm in Istanbul (Turkey). κ-carrageenan was (788,7 g mol−1) and cetyltrimethylammonium bromide (CTAB) (Molecular Weight:364.45 g mol−1) purchased from Sigma Aldrich Company (Germany). Polyvinyl alcohol (60.000 g mol−1), acetic acid (purity: 100%), and ethanol (purity: 96%) were purchased from Merck Company (Germany).
2.2. Characterization of ES NCs
The chemical and surface properties of the prepared ES NCs were determined using various characterization techniques such as scanning electron microscopy (SEM, FEI Company, USA) with a gold coating process at 20 kV of the accelerating voltage, dynamic light scattering (DLS-Mastersizer source material samples up to 3X trituration step), and fourier transform infrared spectroscopy (FTIR) in the frequency range from 400 to 4000 cm−1. The surface tensions of ES NCs were performed using a force tensiometer (KRUSS Company, Germany). The z-average size of the ES NCs is computed by the following equation [20].

here, I is the intensity, D is the hydrodynamic diameter, and Davg is the z-average size of the ES NCs.
2.3. Preparation of ES NCs
The ES NCs were prepared following the experimental procedure described in our previous study [21]. 10 g of white eggshell was washed with distilled water and dried in a microwave oven. (1/1, v/v) 50 ml of water/ethanol solution was added to the eggshell and placed in the microwave oven for 5 min. Then, the solution was mixed with 10 ml of glacial acetic acid/distilled water (1:49, v/v) solution and sonicated at 35% amplitude for 1 h. 5.0 g of PVA were dissolved in 50 ml distilled water at 80 °C and kept for 5 days in a dark glass. κ-carrageenan (0.1 g) was dissolved in 50 ml distilled water. PVA, κ-carrageenan, and eggshell solutions were mixed and sonicated for 1 h. Finally, the sample was filtered through a sterile filter (0.22 micron) and stored in a sterile container at 25 °C. Additionally, the optimum pH, eggshell mass fractions (2%, 5%, and 10%), temperature (25 °C–50 °C), pH (3–10), CTAB mass fraction (2%, 4%, and 5%), variety, and concentration of the ES NCs were examined.
2.4. Fuzzy regression
Regression analysis is an effective and reliable statistical method to determine the impact of one or several independent variable(s) on a dependent variable. This most widely used method has broad application areas such as and engineering, biology, business, and economic forecasting.
There are some cases that the observations are not exact and stable in nature. To deal with this vague and uncertain environment, fuzziness is considered in systems where human estimation is effective, and thus, a fuzzy structure of regression is developed. Fuzzy linear regression analysis is first introduced by Tanaka et al [22]. They formulated a linear programming problem to determine the regression coefficients in fuzzy form. After then, several articles have addressed the issue of regression in a fuzzy environment in the literature [18, 23].
In this paper, we used the fuzzy regression, which minimizes the total fuzziness of the model proposed by Lee and Tanaka (1999) [24], referred to as possibilistic linear regression. They used a fuzzy linear function, of which only parameters are fuzzy numbers, as a regression model to express fuzziness. They proposed a fuzzy regression model by assuming nonsymmetric triangular fuzzy numbers. In this regression model, the dataset contains crisp inputs and after the application of the model, fuzzy outputs are obtained. In the proposed fuzzy regression analysis, quadratic programming problem is used, which integrates the properties of central tendency and possibility. The proposed model minimizes the total spread, whereas its constraints show that the observed values should be covered by the estimated fuzzy number at the particular level of threshold. The quadratic programming approach allows to obtain the center and the spread coefficients simultaneously and presents some trade-offs between the minimum spread and the central tendency in the regression model.
Consider  is the observed dataset where
  is the
  input data,
  is the
  output data and
  is the data size. The fuzzy regression model is presented as

where the components of input data  are crisp numbers, the coefficients
  and the estimated output
  are (non-symmetric) triangular fuzzy numbers. A triangular fuzzy number
  is defined by using a membership function
  which takes a value between 0 and 1, such that

where  is the center,
  and
and  are left and right spreads, respectively. Therefore, the regression model given in (1) can be expressed as

where,

represent the center, the left-spread, and the right-spread of the fuzzy output  respectively. It should be noted that the left and right spreads of the fuzzy output, i.e.
  and
and  are positive since the left and right spreads of the fuzzy coefficients, i.e.
  and
and 
 are assumed to be positive.
Since the parameter  is a given threshold, the
  level set of the estimated output
  is determined as an interval such that

To determine the optimal fuzzy coefficients  of the fuzzy regression model, the sum of spreads of the estimated fuzzy outputs
  is considered as

and the sum of squared distances between the estimated output centers  and the observed outputs, which is known as the least squares method, is presented as

where  is a center vector.
The fuzzy regression model aims to minimize the sum of equations (2.6) and (2.7), which reflect both properties of fuzzy regression and least squares, subject to including all the given data and a threshold  Therefore, the mathematical model of the fuzzy regression is presented as
s.t.


where  and
and  are weight coefficients.
In this study, R programming language is used with R-Studio version 1.4.1106 to obtain the fuzzy regression results. We have utilized the PLRLS method of the fuzzyreg software package [24, 25].
2.5. Mathematical model development
2.5.1. Data
All the data utilized in obtaining the mathematical models and model evaluations are given in Supplementary Information file. Here, the effects of eggshell mass fraction, concentration, temperature, pH, and CTAB mass fraction on the surface tension is presented through Tables T1-T4. The experimental determination of combined effects of the variables are not included in this study since these effects are minimal and neglected in other modeling and optimization studies [26–28]. In this study, the aim of all the proposed models is not to dynamically analyze the rheological properties of the nanostructure, but to reduce the experimental effort in the light of the obtained data and to provide fast answers without wasting of time or resources.
2.5.2. Determination of critical micelle concentration
Linear regression is fitted to the surface tension - concentration data, and the resulting lines are intersected to obtain critical micelle concentrations for each mass fraction (2%, 5%, and 10%) of the eggshell [19, 29].
2.5.3. The proposed crisp model
Expressing the surface tension as a function of operating variables such as concentration, temperature, pH, mass fraction of eggshell, mass fraction of CTAB, a crisp mathematical model is proposed. Firstly, a crisp exponential regression is applied to the surface tension data corresponding to the concentration, for each mass fraction (2%, 5%, and 10%) of the eggshell. The coefficients of determination value, R2, of each regression are computed as 0.955, 0.974, and 0.992, respectively. Then, crisp linear regressions are fitted for surface tension data corresponding to temperature, pH, and mass fraction of CTAB. The R2 values of these linear regressions are 0.969, 0.955, and0.941, respectively. When the fixed parameters that are temperature, pH, and mass fraction of CTAB are 25 °C, 5, and 5%, respectively, the obtained relations are normalized. By multiplying the normalized linear relations with exponential function of surface tension results corresponding to the concentration, the crisp models are proposed for each mass fraction of eggshell.
2.5.4. The proposed fuzzy-hybrid model
While the proposed crisp model has achieved acceptable error values, we have observed that there is potential improvement in the modeling of surface tension of ES NCs. Thus, we have constructed a fuzzy-hybrid mathematical model, consisting of a piecewise function separated at critical micelle concentration values for each mass fraction (2%, 5%, and 10%) of the eggshell, instead of exponential regression. The first part of the piecewise function, that is, the concentration values below the critical micelle concentration, fitted by linear regression. The second part is presented using the fuzzy regression to provide a function whose outputs are fuzzy numbers containing the error information within itself. Here, the crisp input (x) is the concentration (C), and the fuzzy output (y) is the surface tension (γ). The h-level is taken zero to ensure that all experimental data are within the left and right spreads of the fuzzy outputs. After the piecewise functions for each mass fraction of eggshell are constructed, each of them is multiplied by the corresponding normalized functions in the crisp model to yield the surface tension as a function of operating variables, and thus, the fuzzy-hybrid model is developed.
2.6. Statistical error analysis methods
Primarily, the R2 [30] values are evaluated for each regression. Then, correlation diagrams are presented for all constructed mathematical models, where experimental values are plotted against the calculated ones. Then, in order to provide quantitative statistical error analysis, the sum of squares of errors (SSE) [17], the hybrid fractional error function (HYBRID) [31], Marquart's percentage standard deviation (MPSD) [32], and the average relative error (ARE) [33], are evaluated for the crisp models and the central tendency of the fuzzy models. The mathematical formulations of R2, SSE, HYBRID, MPSD, and ARE are given in equations (2.9–2.13), respectively.


here,  experimental surface tension,
  calculated surface tension,
  mean of experimental surface tension, n: number of data points and p: number of parameters.
3. Results and discussion
3.1. Characterization of ES NCs
Recently, researchers have investigated in detail the rheological, surface, and chemical properties of advanced nanostructures to increase biocompatibility and biodegradability [34–37]. To investigate the surface and chemical properties of ES NCs, different techniques such as SEM, FTIR, and DSC were used. In figures 1(a)–(c), the SEM, DLS, and FTIR results of ES NCs were presented. The SEM image of the prepared ES NCs was evaluated to determine the distribution, morphology, and particle size of ES NCs. According to the SEM result, it was clear that the ES NCs had a had a porous flower-shaped nanostructure which has a shape of a coral reef structure. The structure of ES NCs exhibited a structure of coral reefs with micro/mesopores in between the nanolayers and three-dimensional (3D) hierarchical porous structure. It was assumed that the growth of EC had aggregation mechanisms driving the self-assembly of 3D structure (https://doi.org/10.1016/j.est.2021.102749, Journal of Energy Storage Volume 40, August 2021, 102749) Additionally, the ES NCs had a particle distribution with diameters of about 100–200 nm (figure 1(a)). The DLS technique was used to measure the hydrodynamic diameter of the ES NCs in solution. According to the DLS results, the z-average size of ES NCs was 101.97 nm with a homogenous particle distribution, having a uniform layered nano-porous structure approved by the SEM and DLS results. Furthermore, it was found that the ES NCs had a large surface area of 220.2 m2 g−1.
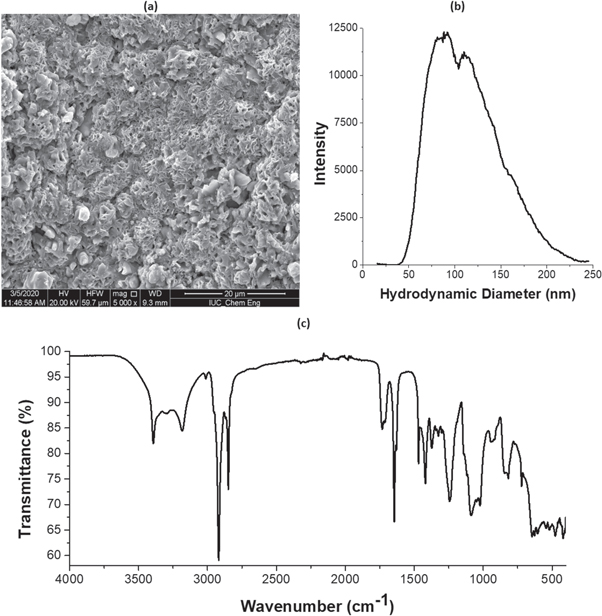
Figure 1. SEM micrograph (a), DLS curve (b), and FTIR (c) graph of ES NCs.
Download figure:
Standard image High-resolution imageIn our previous study, the FTIR technique was used to identify the chemical structural and functional groups of ES NCs [21]. The FTIR result was presented in figure 1(c). We observed at 3400 cm−1−3199 cm−1 (–OH), 2913 cm−1− 2856 cm−1 (–CH stretching), 1726 cm−1−1640 cm−1 (–C=O), 1455 cm−1−1412 cm−1, 1369 cm−1, 1100 cm−1 and 1050 cm−1 (–C=O, carbonate) [21].
According to the FTIR spectra, it was concluded that various surface functional groups (–C=O, and O-H groups) on the surface of the nanostructre.
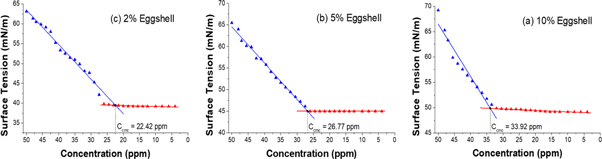
Figure 2. Determination of CMCs for 2% (a), 5% (b), 10% (c) mass fractions of eggshell.
Download figure:
Standard image High-resolution image3.2. The measurement of rheological parameters of ES NCs
In this study, rheological properties of nanostructures were investigated in detail at different operating parameters such as the mass fraction of eggshell, the mass fraction of surfactant, pH, and temperature and were shown in figures 3, 4. The surface tension results of ES NCs/water solutions were calculated between 39.22 mN m−1 to 63.11 mN m−1 in a range of 4–50 ppm at 25 °C. According to rheological results, we found that the minimum surface tension value was calculated for the ES NCs (2% eggshell) and showed that there was a correlation between the mass fraction of the nanostructure and surface tension (see figures 5, 6). However, the lowest surface tension was found to be 39.22 mN m−1 for the ES NCs (5% CTAB). Consequently, the surface tension values were changed with temperature, and we showed that the optimum temperature was 25 °C and pH 5 [38, 39].
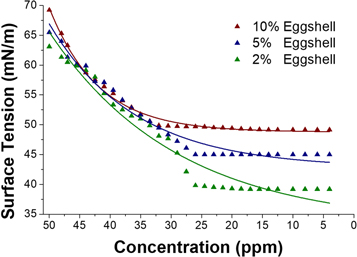
Figure 3. The effects of concentration for each mass fraction of eggshell (T = 25 °C, pH = 5, mCTAB = 5).
Download figure:
Standard image High-resolution image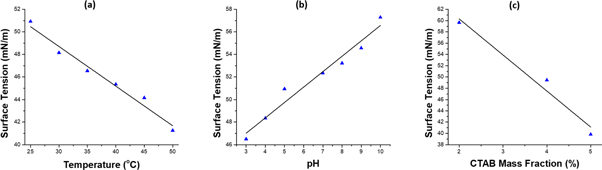
Figure 4. The effects of temperature (pH = 5, mCTAB = 5, 2% eggshell mass fraction) (a), pH (T = 25 °C, mCTAB = 5, 2% eggshell mass fraction) (b), and mCTAB (T = 25 °C, pH = 5, 2% eggshell mass fraction) (c) on surface tension of Kappa-Carrageenan/PVA/eggshell system.
Download figure:
Standard image High-resolution image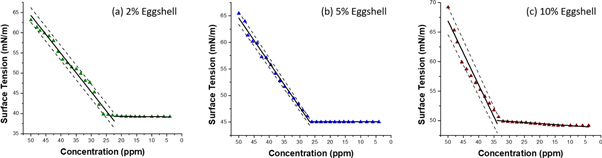
Figure 5. The constructed piecewise functions for 2% (a), 5% (b) and, 10% (c) eggshell concentrations, with respect to the experimental values (T = 25 °C, pH = 5, mCTAB = 5).
Download figure:
Standard image High-resolution image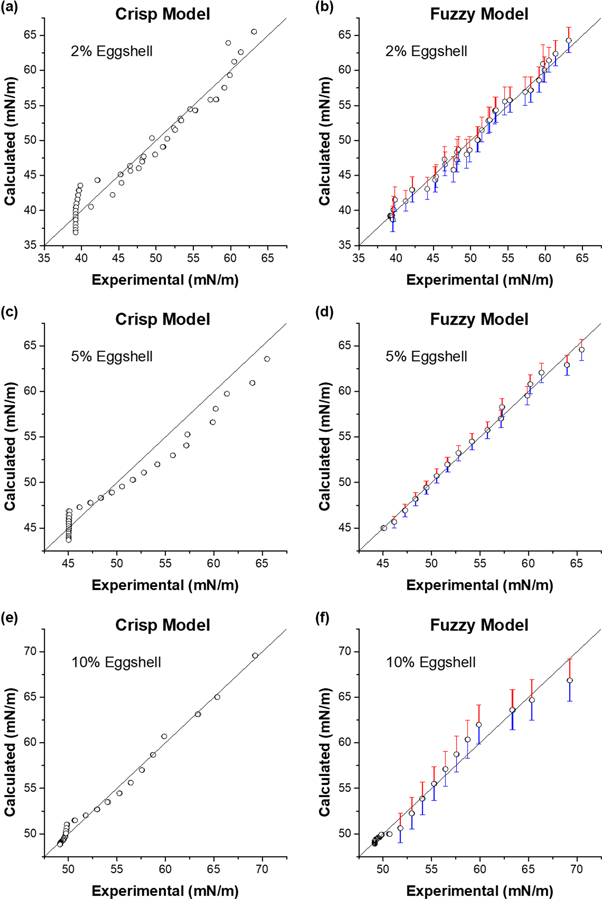
Figure 6. The correlation diagrams for calculated and experimental surface tension values of the crisp and fuzzy models for 2% (a), (b), 5% (c), (d), 10% (e), (f) eggshell mass fractions, respectively.
Download figure:
Standard image High-resolution image
3.3. Determination of critical micelle concentrations
Critical micelle concentrations (CMC) are determined by the intersection of the lines which are obtained by linear regressions relative to the data, all illustrated in figure 2. The CMCs are determined as 33.92 ppm, 26.77 ppm, and 22.42 ppm for mass fractions of 2%, 5%, and 10% eggshell, respectively.
3.4. Crisp modeling of surface tension
In this study, we have obtained surface tension as a function of operating variables concentration (C), temperature (T), pH, and CTAB mass fraction (mCTAB, %). Firstly, an exponential regression is applied to the surface tension data corresponding to concentration, while the remaining variables are kept constant at T = 25 °C and pH = 5. The functions of  equation (3.1),
  equation (3.2), and
  equation (3.3) are provided for mass fraction of 2%, 5%, and 10% eggshell, respectively. These functions are illustrated with the experimental data in figure 3. The R2 value for these equations are 0.96, 0.97, and 0.99, respectively.


To determine surface tension as a function of temperature, pH, and mCTAB, x linear regressions are applied to the corresponding data as illustrated in figure 4. The relationships between surface tension—temperature (R2 = 0.97), surface tension—pH (R2 = 0.96), and surface tension—mCTAB(R2 = 0.94), are presented in equations (3.4), (3.5), and equation (3.6), respectively.

where pH = 5, and the mass fraction is 5% (mCTAB = 5).

where T = 25 °C, and the mass fraction is 5% (mCTAB = 5).-

where T = 25 °C, and pH = 5.
After the obtainment of equations (3.4–3.6), the functions 
 are normalized as in equations (3.7–3.9), respectively. The normalization is performed so that the normalized functions result 1 at fixed parameters T = 25 °C, pH = 5, and mCTAB = 5.


Finally, the multiplication of equations (3.7–3.9) with the functions 
 and
and  (equations (3.1–3.3)) yields the surface tension as a function of the operating variables for mass fractions of 2%, 5% and 10% eggshell, respectively equations (3.10–3.12).


3.5. Fuzzy-hybrid modeling of surface tension
While the obtained equations (3.10–3.12) may be utilized as a sufficient model for surface tension, there is possible improvement on the model by considering the fuzzy regression. Thus, to provide a more sophisticated mathematical model containing the random error in the data, a fuzzy-hybrid model is proposed in this study. Firstly, fuzzy linear regression is fitted to represent the surface tension data corresponding to concentration, as opposed to the exponential regression. For the values below the critical micelle concentration, the crisp linear regression represents the data adequately. Consequently, the fuzzy and crisp linear regressions are applied to the data above and below the critical micelle concentration, respectively. The fuzzy parameters obtained by the regression are represented in table 1. Note that the obtained M2, A5, and A10 are crisp values since their spreads are zero.
Table 1. Fuzzy parameters of linear regression.
| Fuzzy Number | Center | Left Spread | Right Spread |
|---|---|---|---|
| A2 | 16.9010 | 1.7142 | 1.8923 |
| M2 | 0.9474 | 0 | 0 |
| A5 | 22.5791 | 0 | 0 |
| M5 | 0.8401 | 0.0239 | 0.0226 |
| A10 | 12.7958 | 0 | 0 |
| M10 | 1.0811 | 0.0463 | 0.04736 |
By combining the fuzzy and linear regressions applied above and below Ccmc values, we obtain the piecewise functions in equations (3.13–3.15) for 2%, 5%, and 10% eggshell mass fraction, respectively. As the results of the proposed fuzzy-hybrid model, the following piecewise functions with the corresponding data are illustrated in figure 5. Since the same data is utilized in figures 3 and 5, it can be observed that the performance of the proposed fuzzy-hybrid model is superior to the proposed crisp model.


The equivalent representation of the fuzzy relations, namely, central tendency, lower boundary, and upper boundary of the regression models are presented in table 2. The lower and upper boundaries provide a sensitivity approximation of the regression. Thus, the experimental error intervals can directly be determined by using these equations.
Table 2. The lower boundary, central tendency, and upper boundary equations of the respective fuzzy relations.
| Fuzzy Relation | Equivalency Type | Equation |
|---|---|---|

| Lower Boundary |

|
| Central Tendency |

| |
| Upper Boundary |

| |

| Lower Boundary |

|
| Central Tendency |

| |
| Upper Boundary |

| |

| Lower Boundary |

|
| Central Tendency |

| |
| Upper Boundary |

|
Finally, the constructed piecewise functions 

 equations (3.13–3.15) may be multiplied by equations (3.7–3.9), to yield the fuzzy-hybrid model, resulting surface tension as a function of all the operating variables for mass fractions of 2%, 5%, and 10% eggshell, respectively equations (3.16–3.18).


3.6. Statistical error analysis
Statistical error analysis is conducted for functions obtained in equations (3.10–3.12) and (3.16–3.18) to evaluate the performance of the models obtained. SSE, HYBRID, MPSD and ARE values for each function are determined by comparing the results of each equation with 106 experimental data points. The experimental surface tension values plotted against the calculated ones are illustrated in figure 6. It shows that the errors are contained within the fuzzy coefficients. Indeed, y = x line is contained within the left and right spreads of the computed fuzzy number, i.e., fuzzy output.
In order to provide quantitative comparability, the error terms are computed only for the central tendency of the fuzzy model and given in table 3. It represents the error values in an acceptable range for both crisp and fuzzy models with comparison to our previous study [19]. For 2% and 5% eggshell mass fractions, the error values were found to be significantly lower, even if the fuzzy hybrid model was constructed by considering only the central tendency. For 10% eggshell mass fraction, even though the crisp model has given slightly better results, the comparison is with the central tendency of the fuzzy-hybrid model only. Since the output of the proposed fuzzy-hybrid model contains the errors as well, the fuzzy-hybrid model is highly preferable to the crisp model.
Table 3. Error analysis results of mathematical models for the κ-Carrageenan/PVA/ES nanobiocomposite.
| Crisp model | Central tendency of the fuzzy model | |||||
|---|---|---|---|---|---|---|
| 2% | 5% | 10% | 2% | 5% | 10% | |
| SSE | 318.52 | 293.06 | 26.27 | 65.34 | 19.34 | 70.96 |
| HYBRID | 7.00 | 5.14 | 0.49 | 1.32 | 0.32 | 1.14 |
| MPSD | 33.90 | 27.11 | 7.72 | 12.4 | 5.11 | 8.93 |
| ARE | 3.36 | 2.68 | 0.76 | 1.23 | 0.51 | 0.88 |
4. Conclusion
In this study, DLS, SEM, and FTIR techniques were used to determine morphologies and functional groups of the ES NCs. According to the characterization results, we found that the ES NCs had a high surface area of 220.2 m2 g−1 and z-average size of 101.97 nm. Surface tension of ES NCs were experimentally determined as a function of the operating parameters such the mass fraction (2%, 5%, and 10%) of eggshell, concentration, the mass fraction (2% − 5%) of CTAB, pH (3–10), and temperature (20 °C–50 °C). To relate the surface tension with the operating variables, the crisp and fuzzy-hybrid mathematical models were proposed, and the statistical error analysis was conducted to evaluate the validity of the models. However, it was also observed that the fuzzy-hybrid model improved the mathematical representation of the data and was superior to the crisp model, since the output of the fuzzy-hybrid model include the uncertainty information as well. The proposed fuzzy-hybrid modeling approach provided a better fit by giving smaller error values for each model. In addition, the proposed fuzzy-hybrid modeling approach was presented as a preferable option in modeling surface tension of the nanobiocomposite materials. Consequently, by supporting expensive and time-consuming experimental methods with fuzzy-hybrid mathematical models, economical and effective methods can be designed with fewer experiments in nanotechnological applications.
Data availability statement
All data that support the findings of this study are included within the article (and any supplementary files).
Declaration of interest
The authors declare that there is no conflict of interest regarding the publication of this article.
Supplementary data (0.1 MB DOCX)