


Abstract
Crossed magneto-thermo-electric coefficients are central to novel sensors and spin(calori)tronic devices. Within the framework of Boltzmann's transport theory, we calculate the resistivity and Seebeck coefficients of the most common 3d ferromagnetic metals: Fe, Co, and Ni. We use a fully first-principles variational approach, explicitly taking electron-phonon scattering into account. The electronic band structures, phonon dispersion curves, phonon linewidths, and transport spectral functions are reported, comparing with experimental data. Successive levels of approximation are discussed: constant relaxation time approximation, scattering for a non-magnetic configuration, then spin polarized calculations with and without spin–orbit coupling (enabling spin-flips). Spin polarization and explicit electron–phonon coupling are found to be necessary to reach a correct qualitative picture: the effect of spin flipping is substantial for resistivity and very delicate for the Seebeck coefficient. The spin-dependent Seebeck effect is also predicted.
Export citation and abstract BibTeX RIS

Original content from this work may be used under the terms of the Creative Commons Attribution 4.0 license. Any further distribution of this work must maintain attribution to the author(s) and the title of the work, journal citation and DOI.
1. Introduction
Thermoelectric effects concern the coupling between heat and electric currents, and the electronic transport coefficients are among the most commonly used physical properties of materials with free charge carriers, being central to many other observables as well as applications, e.g. in thermocouples. Bridgman's measurements on elemental metals can be dated back to 1918 on several metals such as copper and platinum [1], followed by theoretical interpretations thanks to the Onsager relations [2]. Although many measured data on elemental metals have been available for over 60 years, quantitative or even qualitative understanding of these transport properties may still be non-trivial, due to the various kinds of mechanisms coming into play, in particular with the involvement of thermal effects.
Expressions for the electronic transport properties, such as resistivity (ρ) and Seebeck coefficient (S, also called thermopower), can be obtained within the framework of Boltzmann's transport theory. An intuitive approach is to solve the semi-classical Boltzmann equation by employing the relaxation time approximation (RTA), with which all the transport coefficients can be derived. In the degenerate limit, the Mott formula gives insight to understand the diffusive Seebeck. Before the prevalence of density functional theory (DFT) calculations, these models achieved some success to qualitatively interpret experimental data, especially for the temperature dependence of ρ and S due to various scattering mechanisms, e.g. electron–electron, electron–phonon, electron-impurity, electron–magnon (EM) scatterings etc; however, for quantitative computation, in particular without empirical parameters, the Mott formula is largely inadequate.
First principles methods have progressed in recent years, and can now yield very accurate predictions for simple metals, such as alkali and noble metals [3] with the variational approach (VA) developed by Allen [4], and for a few elemental metals with phonon-limited RTA approach [5–7]. VA takes fully ab initio microscopic electron–phonon scattering into consideration, by directly calculating the scattering in the variational basis set of Fermi Surface harmonics (FSH), which is suitable for computing electronic transport properties of metals with moderate or higher carrier concentrations. It calculates a pertinent average of the fine features of the Fermi surface, such that transport properties usually converge with less dense k- and q-grids compared with the full RTA. In practice, constant RTA (CRTA) is often adopted, which is computationally efficient, as only electron band-structure calculations are needed. However, the relaxation time τ is assumed to be constant for all k points and bands (and all temperatures) hence the microscopic character of the scattering mechanisms is completely ignored and treated in an averaged way, which works poorly for metals.
Polyvalent metals present specific challenges for quantitative prediction of their thermopower due to multiple bands crossing the Fermi level, for instance in aluminum. The situation is undoubtedly more challenging for transition metals that have partially filled d bands, and even worse for magnetic transition metals, such as Fe, Co, Ni, and Cr, which are further complicated by electron scattering with the spin degrees of freedom. Several theoretical works have attempted to compute the temperature-dependent resistivities, using VA with the elastic lowest-order variational approximation (LOVA) [8, 9] or the Korringa–Kohn–Rostoker method based on the alloy analogy model employing the coherent potential approximation and Kubo's response formalism [10–12] , with the latter being able to consider electron scatterings with both phonons and magnons. However, first-principles calculations of their thermopower are still lacking.
In this paper, we aim to study the thermoelectric properties of paradigmatic ferromagnetic (FM) elemental metals Fe, Co, and Ni, including resistivity and spin-dependent Seebeck effect. As it will be shown in section 3, the experimental Seebeck data exhibit rather complex temperature dependence, which is related to magnon and phonon drag as well as the temperature evolution of the magnetic state and electronic band structures. Our aim here is not to predict all these behaviors, but to mainly discuss mechanisms involving electron–phonon scattering with zero-temperature band structures. This will allow us to gain an initial insight into this central transport mechanism. Within this scheme, the effect of spin flip to the transport properties is extracted by comparing calculations performed without (spin polarized, or SP) and with spin–orbit coupling (SOC). The influence of thermal expansion is also qualitatively assessed by considering different lattice constants, the theoretically relaxed vs. experimental values, which differ by a few percent.
Some clear simplifications should be noted when comparing with experimental data: (1) ab initio calculation of magnon-drag and phonon-drag at low T are not within the scope of our calculations, but contributions from EM scattering at low temperature estimated in [13, 14] are considered for better comparison; (2) an important feature in these metals is that with increasing temperature, in particular for temperatures close to the Curie point, electron populations of up and down spin channels gradually equalize, which results in a non-linear increase of resistivity (the magnetic disorder seen by electrons increases) and an upturn of the Seebeck coefficient [15] (the phase space and entropy accessible to carriers also increase). The spike in resistivity at high temperature is also known to be related to the increase of the specific heat when approaching TC . As a first crude approximation, we also investigate the non-magnetic (NM) case of each metal, which enforces equalized spin-up and -down bands, but it is important to note that in reality, the metals are paramagnetic (PM)[16].
The reminder of this paper is organized as follows. In section 2, we describe the computational details of our first-principles calculations. In section 3, we present our first-principles results for the FM elemental metals Fe, Co, and Ni, including electronic band structures, spin-projected band structures with SOC, phonon dispersion curves, phonon linewidths, transport spectral functions, resistivity, Seebeck coefficients, and an extensive discussion of the interaction with the magnetic state. In section 4, we provide a summary of our most important findings. In the supplementary information (SI), we report the convergence tests, phonon linewidths for the SOC and NM cases obtained with relaxed lattice constants, resistivity and Seebeck coefficient for the SP case, the full results with experimental lattice constants, anisotropy in hcp Co, and the effect of shifting Fermi level on the Seebeck coefficient.
2. Computational details
DFT [17, 18] and density functional perturbation theory (DFPT) [19, 20] are employed to calculate the electronic band structures, density of states (DOS), phonon dispersion, electron–phonon coupling (EPC) matrix elements and transport coefficients, as implemented in the abinit package [21–23]. The exchange and correlation functionals are treated within the local density approximation (LDA) for practical reasons, as all of the non collinear DFPT and transport does not include generalized gradients. It is known that generalized gradient approximation (GGA) improves the predicted volumes, magnetizations and energies for Fe and Co, while Ni is fortuitously correct in LDA, but we will see below that reasonable quantitative agreement can be obtained with LDA as well. All calculations employ optimized norm-conserving Vanderbilt pseudopotentials [24] with the following valence configuration: 3s23p63d64s2 for Fe, 3s23p63d74s2 for Co, and 3s23p63d84s2 for Ni. The LDA fully-relativistic versions have been generated starting from the scalar-relativistic input files provided by the PseudoDojo project [25].
Unshifted 24 × 24 × 24 k-point and 8 × 8 × 8 q-point grids are employed for each metal of the cubic symmetry (one atom per unit cell). Hcp Co has two atoms in the primitive unit cell, and we use an unshifted 16 × 16 × 16 k-point and  -point grids, ensuring converged transport properties (see figure S1 in SI). Plane-wave basis functions with kinetic energy up to 50 Hartree are used in Co and Ni, and 35 Hartree is used for Fe. Test calculations with 50 Ha of cutoff energy for Fe yield very similar result. To assess the effect of the magnetic configuration and spin-flip contribution, three magnetic cases are considered for each metal: (1) SP; (2) with SOC; and (3) NM.
For comparison, the Seebeck coefficients are calculated using two methods, both within the framework of Boltzmann's theory. The first method takes the CRTA solution to the Boltzmann transport equation (BTE), as implemented in the boltztrap code [26, 27], and S is independent of the constant lifetime. In CRTA, an energy-dependent conductivity tensor can be defined as

where Ns
is a spin factor of 2 if the bands are spin degenerate and not spinors, and αβ are spatial Cartesian directions. In the collinear spin case there are two tensors ( ), one for each spin. The Seebeck coefficient can be written as
The second method adopts the inelastic LOVA to the BTE, as derived by Allen [28]. The formalism of computing electronic transport properties of a NM metal due to EPC was detailed in [3]. For a collinear FM metal with only one chemical species, the EPC matrix has decoupled spin dependence and can be written as follows:

where q is the phonon wavevector and ν the branch index. M is the atomic mass,  the phonon eigenvector, and
  is the phonon frequency.
  is the self-consistent DFPT scattering potential, and
  is the wave function at state k, band j and spin channel σ (
 or
or  ).
).
The scattering operator in terms of the basis functions composed of products of the k- and spin-dependent FSH  and energy-dependent polynomials can be written as:
where Vcell is the volume of the unit cell,  the DOS at the Fermi level for spin channel σ,
  the reduced Planck constant, n the Bose Einstein distribution, and ω the phonon frequency.
  and J are, respectively, the spin-dependent transport spectral function and the joint energy polynomial, with the former defined as:
By truncating the upper left 2 × 2 part of the  matrix (known as the inelastic LOVA), the electronic transport coefficients can be found as:

Within the SP case, it is assumed that the two spin channels are independent and conduct in parallel; therefore, the overall resistivity can then be written as:
In the same spirit, the overall Seebeck coefficient can be expressed as the following:
On the other hand, a spin-dependent Seebeck coefficient can be defined as the difference between the two spin channels [29–33].

This is not to be confused with the 'Spin-Seebeck' effect [34, 35] explained in [36]. The latter (1) can occur in insulators as well since it is not related to the diffusion of carriers, but rather to that of magnons and/or to indirect phonon-drag type effects, and (2) can be both longitudinal and transverse to the temperature gradient.
When including SOC, the Hamiltonian is no longer diagonal in spin space, and the EPC matrix (neglecting band indices) becomes

while the rest of the formulae are similar to the NM case [3].
Each state can be an arbitrary spinor, and the SOC contribution to  allows transitions which change (even flip) the spin.
The magnitude of the Seebeck coefficient can often be interpreted by using the Mott formula, which relates S to the energy derivative of the electrical conductivity according to:

in which the Drude model  is assumed, with
  being the energy dependent mobility.
3. Results and discussion
For the three FM 3d metals, we consider the following stable phases within about 1200 K, viz., the body-centered cubic (bcc) phase for Fe, the face-centered cubic (fcc) phase for Ni, and both the hexagonal close-packed (hcp) and fcc phases for Co, since cobalt transforms from hcp to fcc at 700 K. It is also worth to mention their Curie temperatures, i.e. 1043 K for Fe, 1396 K for Co, and 629 K for Ni, as the transport properties are strongly affected by the magnetic ordering.
The calculated basic structural and magnetic properties are listed in table 1, with three magnetic cases (SP, SOC, and NM) and two geometries (relaxed and experimental lattice constants). The experimental values are also shown for comparison. The lattice constants are underestimated by between −6.15 and −2.78%, which is typical for LDA. The treatment of magnetism is found to affect the lattice constant, which reflects the spin-lattice interactions. SP and SOC yield similar lattice constants except for fcc Co. NM gives smaller values in general. The calculated magnetic moments are in good agreement with measurements, with an underestimation between −12.47% and −0.37%. Using the experimental lattice constant, the agreement in magnetization is slightly improved, except for fcc Ni.
Table 1. Calculated lattice constant alatt (in Bohr) and magnetic moment M (in  ) for Fe, Co, and Ni, in comparison with experimental values. For magnetic moments, cases with relaxed and experimental lattice constants are considered.
| Fe (bcc) | Co (hcp) | Co (fcc) | Ni (fcc) | |
|---|---|---|---|---|
| alatt (SP) | 5.206 |
a = b = 4.590  = 7.402 = 7.402 | 6.315 | 6.469 |
| alatt (SOC) | 5.195 |
a = b = 4.589  = 7.415 = 7.415 | 6.474 | 6.470 |
| alatt (NM) | 5.097 |
a = b = 4.533  = 7.293 = 7.293 | 6.373 | 6.460 |
| alatt (Expt. [37]) | 5.41 |
a = b = 4.73  = 7.69 = 7.69 | 6.708 | 6.65 |
| M (Relaxed alatt, SP) | 2.062 | 1.550 | 1.537 | 0.618 |
| M (Relaxed alatt, SOC) | 2.044 | 1.566 | 1.579 | 0.616 |
| M (Expt. alatt, SP) | 2.264 | 1.638 | 1.683 | 0.679 |
| M (Expt. alatt, SOC) | 2.261 | 1.635 | 1.679 | 0.676 |
| M (Expt. [37]) | 2.335 | 1.72 | 1.72 | 0.62 |
3.1. Band structure
The electronic band structures and corresponding DOS are shown in figure 1, which are essential to understand the transport properties [3]. For all three metals, the SP and SOC band structures are almost identical (see figure S2 in the SI for the spin projected SOC bands), and are consistent with the results in [38–40] for the SOC case of Fe and Co, and the SP case of Ni. Minor differences can be ascribed to the difference in exchange correlation functionals or pseudopotentials. For NM, the picture is significantly different as each band is doubly degenerate: the NM band energies are close to be the averages of the up and down spin bands from SP or SOC. At a temperature significantly below TC, the band structure is expected to be close to the 0 K results from SP or SOC. The NM electronic structure will be used to estimate the PM state above TC, but one should note the difference in the local magnetic moments and thermal effects in comparison with the true PM state.

Figure 1. Calculated band structures and density of states (DOS) for (a) Fe, (b) Ni, (c) hcp Co, and (d) fcc Co, with LDA relaxed lattice constants. Top to bottom panels are: spin polarized, spin–orbit coupling, and non-magnetic, resp. The Fermi level is set as E = 0.
Download figure:
Standard image High-resolution image3.2. Phonon dispersion curves
The DFPT calculated phonon dispersion curves are shown in figure 2. For Fe (figure 2(a)), SP and SOC phonons with relaxed lattice constant are reasonably consistent with the experimental data, despite some slight overestimation of the frequencies due to underestimated lattice constant. For the NM case, interestingly, there are strong vibrational instabilities at various q points, which can be at least partly related to the artificial Kohn anomaly arising from the flat bands crossing the Fermi level, in particular near the middle point between Γ and N (see figure 1(a)) that yields the largest softening at N. These results are clearly unphysical and, for this reason, we do not report transport properties for the NM configuration. For Ni (figure 2(b)) and Co (figures 2(c) and (d)), no vibrational instability is observed for all three magnetic cases, and the agreement with experiment is reasonable. The relative differences in frequencies can be mainly attributed to the lattice constants, which are very close for the three magnetic cases. However, the electronic and magnetic structures can also influence phonons, as it was already pointed out in previous studies (see e.g. [43]), and is visible in the subtle qualitative differences in our results, such as the softening at M for hcp Co with SOC (figure 2(c)) and the softening at the X and L points for fcc Co (figure 2(d)). On the other hand, using experimental lattice constants yields qualitatively similar dispersion curves but with reduced phonon frequencies (figure S8), as the lattice constant is slightly larger. The discrepancies between computations and experiments can also be attributed to thermal effects, as the measurements are carried out at room (or at least finite) temperatures.
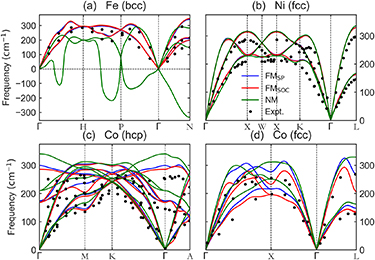
Figure 2. Calculated phonon dispersion curves for (a) Fe, (b) Ni, (c) hcp Co, and (d) fcc Co, with LDA relaxed lattice constants. The discrete symbols denote experimental data [41–43]. For each metal,  ,
,  , and NM represent the spin-polarized (SP) ferromagnetic, spin–orbit coupling (SOC) ferromagnetic, and non-magnetic (NM) cases, respectively.
Download figure:
Standard image High-resolution image3.3. Phonon linewidths and transport spectral function
The EPC can be informatively visualized in the phonon linewidths and the transport spectral function. For clarity, we only show the linewidths for the SP case in figure 3, and the other cases are included in the SI (see figures S3, S9, and S10). In Fe, both the up and down spins contribute to the linewidth away from the Γ point, whereas in the other two metals only the spin-down has significant contribution. This can be related to the band structures, since both spin channels have considerable intersections with the Fermi level in Fe, for either s or d bands, while in other cases only the spin-up has its s band crossing the Fermi level, which results in a small DOS and weak Fermi nesting.
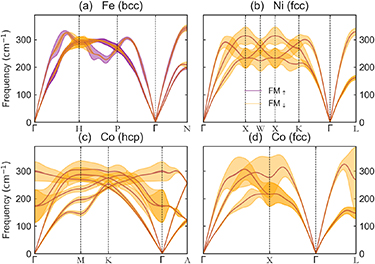
Figure 3. Calculated phonon linewidths for (a) Fe, (b) Ni, (c) hcp Co, and (d) fcc Co in  case, with LDA relaxed lattice constants. All linewidths have been multiplied by a factor of five for visibility.
Download figure:
Standard image High-resolution imageThe transport spectral function  for the SP case shares many features with the phonon linewidths: both spin channels contribute in Fe but the spin-down dominates in Co and Ni (figure 4).
  of the SOC and NM cases are shown as well. For Fe, it is interesting that the SOC curve is almost the same as that from the spin-down; for Co and Ni, it is as expected that the SOC results roughly reproduce those from the spin-down, except that for fcc Co the SOC curve is shifted to slightly lower frequencies due to the overall softening (see figure 2(d)). Without magnetism (NM),
  is slightly reduced. Furthermore, the transport spectral functions calculated using the experimental lattice constants (figure S11 in SI) are qualitatively similar to those from the relaxed lattice constants.
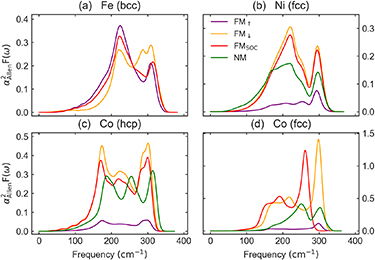
Figure 4. Calculated spin-dependent transport spectral function for (a) Fe, (b) Ni, (c) hcp Co, and (d) fcc Co, with LDA relaxed lattice constants. The NM case for Fe is excluded, since there are strong instabilities.
Download figure:
Standard image High-resolution image3.4. Electrical resistivity
Before discussing the more subtle Seebeck coefficient, we first examine the electrical resistivity ρ, which is a transport property that rather directly reflects the effect of EPC. As shown in figure 5, for all three metals, the experimentally measured resistivity increases with temperature, and the slope gradually increases with temperature until an abrupt decrease at TC (e.g. figures 5(a) and (b)). This can be explained by the magnetic transition from ferromagnetism to paramagnetism: increasing magnetic disorder leads to more electron-spin or EM scattering, which saturates in the PM phase and is additive with the electron–phonon scattering. We obtain close to linear behavior for temperatures above ∼100 K, which is typical for a normal metal considering only EPC. For Fe, only SP and SOC calculated ρ are shown, as the NM case is unstable. Resistivity from SOC is larger than that of SP, and agrees better with experimental values, especially for temperatures below ∼200 K, and it agrees well with the resistivity calculated based on the alloy analogy model and Kubo's response formalism due to thermal vibrations [10]. The discrepancy widens as temperature increases, which can be attributed to the neglect of spin scattering and of temperature effects in the band structure, i.e. 0 K theoretical band structure is adopted. In the case of Ni, the SOC prediction is again better than that of SP. The NM result overestimates at low T, but it agrees better at high T, which may be related to the fact that the effective PM band structure is close to the NM case.
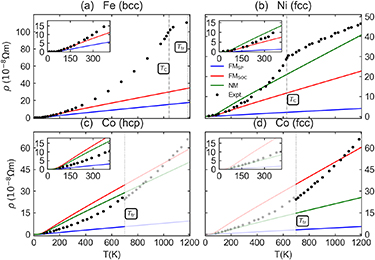
Figure 5. Calculated electrical resistivity as a function of temperature for (a) Fe, (b) Ni, (c) hcp Co, and (d) fcc Co, with LDA relaxed lattice constants. The discrete symbols denote experimental data [44–46]. For each metal,  ,
,  , and NM represent the spin-polarized (SP) ferromagnetic, spin–orbit coupling (SOC) ferromagnetic, and non-magnetic (NM) cases, respectively. For hcp Co, an average of the xx, yy, and zz components is shown. For Co, also note that full color is used for temperatures that the respective phase is stable according to the experimental Ttr. The insets show the same data zoomed around low temperatures.
Download figure:
Standard image High-resolution imageFor all three metals, the SOC calculated resistivities are considerably larger than those from SP. Since the band structures are almost identical between these two schemes, the larger resistivity should be attributed to the spin-flip scatterings allowed in SOC, whereas for SP the two spin channels are independent. For Co, its stable structure below Ttr = 700 K is hcp, and it transforms to the fcc structure above Ttr. We predict the resistivity for both structures, as shown in figures 5(c) and (d). The experimental data show an overall increasing resistivity with temperature, except a small abrupt drop at Ttr. Interestingly, the calculated resistivity is also smaller in the fcc phase than the average of the xx, yy, and zz components of the hcp phase, which is consistent with the drop at the transition point. For instance, at Ttr in the SOC (SP) calculations, the average resistivities are 36.10 (5.38)  m in the hcp phase, and 34.77 (3.11)
  m in fcc, respectively. Note that for the hcp structure, the resistivity tensor has equal xx and yy component, and a larger zz component.
In the SP case, two spin channels are present. The SP resistivity is calculated based on equation (8), and the individual contributions from up and down spin channels are shown in figure S4. The spin-up has a lower resistivity than that of the spin-down, especially for Ni and Co, in which  is about one order of magnitude smaller than
  . This is consistent with the transport spectral function where the spin-down has a much larger magnitude. According to equation (8), the overall resistivity is close to
  , with slightly smaller values.
With experimental lattice constants (figures S12 and S13 in SI), the resistivity is generally larger than those calculated using the relaxed lattice constant, thus giving a better agreement with measured data at high temperature and suggesting that thermal expansion also plays a role in determining the transport properties.
3.5. Seebeck coefficient
The temperature dependence of the Seebeck coefficient is more complex than resistivity in many materials, and even more so in these FM metals. The calculated temperature dependence of the Seebeck coefficients with both CRTA and VA approaches are compared with experimental data (discrete points) in figure 6. The Curie temperatures and phase transition temperatures up to 1200 K are also drawn. The measured S all have non monotonic T dependences and are electron like (negative) at high T. We discuss in detail the different features and limits of our calculations of the electron–phonon-driven diffusive Seebeck effect, explaining additional features due to magnon- and phonon-drag, the spin disorder produced at the PM transition and the structural disorder at solid–solid phase transitions.

Figure 6. Calculated Seebeck coefficient as a function of temperature for (a) Fe, (b) Ni, (c) hcp Co, and (d) fcc Co, with LDA relaxed lattice constants. The discrete symbols denote experimental data [47]. For each metal,  ,
,  , and NM represent the ferromagnetic, spin–orbit coupling (SOC) ferromagnetic, and non-magnetic (NM) cases, respectively. The solid and dash-dotted lines represent results from VA and CRTA, respectively. For hcp Co, an average of the xx, yy, and zz components is shown. For Co (c and d), also note that full color is used for temperatures at which the respective phase is stable according to the experimental Ttr.
Download figure:
Standard image High-resolution imageIn iron, S shows a broad positive peak at low temperature (∼200 K) which has been ascribed to magnon drag [48], the MacInnes–Schröder model of anisotropic scattering due to SOC [49], or to phonon drag [15, 50]. S reaches an extremum at about 800 K, when the drag contributions subside, and then increases until TC. Such an upturn is due to electron scattering by spin disorder associated with the decrease of magnetic moment approaching the PM phase.  increases again beyond TC with the onset of the transition to the γ phase, but this is beyond the scope of the present work. The main region where we can compare our diffusive electron-phonon scattering S is around 800 K at the minimum, and the full SOC value is in very good agreement. CRTA has the wrong sign, with incorrect weighting of the different electron- and hole-like bands. The SP calculation develops the correct sign at high T, but remains too low in magnitude, showing the importance of spin-mixing scatterings in the full representation of diffusion in FM metals.
The lattice constant is found to affect S quantitatively, as shown in figure S14(a) of the SI, which can be attributed to the differences in band structure, phonon dispersion and EPC. It is also worth to mention that our results do not support the MacInnes–Schröder model since including SOC yields negative S, which hardly resemble the positive peak around 200 K.
For Ni S turns up, then slightly changes slope at TC: at temperatures above TC the system becomes PM, and a fraction of the entropy contributing to S is no longer available. Ni is very sensitive to the magnetic state, with strong peaks in the DOS whose position with respect to the Fermi level depends on the volume and exchange correlation functional. The negative maximum around 500 K is believed to be caused by magnon-drag [14], which would be consistent with our low SP or SOC values below TC. However our NM S is very close to experiment, suggesting an alternative simpler scenario, that the SOC and SP Fermi levels are simply not correctly placed in DFT. As shown in figure S22 of the SI, shifting up the Fermi energy (equivalent to adding extra electrons) in the SOC case indeed cause an increase of the magnitude of S. The spin flip transitions seem unimportant for S while they had a strong effect on ρ. Again the influence of thermal expansion (lattice constant) is quantitative, as shown in figure S14(b) of the SI.
The Seebeck coefficient in cobalt has a simple initial linear trend, then an inflection and jump at the structural phase transition, and a gradual decrease of the magnitude in the fcc phase. Calculated in-plane (xx) and out-of-plane (zz) components do not differ very much (see figure S19), and the average of the xx, yy and zz components (figure 6(c)) qualitatively capture but underestimate experiment, both for SP and SOC, while the NM bands yield the wrong sign of S at all T. At higher T in the fcc phase the SP solution continues increasing in magnitude, while the SOC S is significantly smaller. The gradual decrease of the experimental  stems from the approach to the PM phase (TC = 1396 K), as in Fe and Ni. The predictions for fcc Co should be taken with caution, since the phase is above the magnetic turning point, which would require the consideration of gradual equalization of spin-up and spin-down channels with increasing temperature. Nevertheless, a smaller magnitude of S than that of the hcp phase at Ttr is predicted with SOC, and for the SP case as well if the experimental lattice constant is used (figures S14(c) and (d) of the SI).
To better understand the contributions from the up and down spins, we further show the calculated S of these two independent channels in figure S5. The overall Seebeck of the SP case is evaluated based on equation (9). The small magnitude of S in Fe can be seen as a cancellation between negative  and positive
  . Importantly, these signs are opposite to those predicted by CRTA, which can be simply explained by the DOS (figure 1(a)) based on the Mott formula of equation (12). The correct sign of the overall S from VA and the wrong sign from CRTA imply that explicit consideration of EPC is critical for Fe. For Ni and Co, the signs from VA and CRTA are consistent in general. In addition, the contribution from the spin-up is dominant due to the much larger magnitude of S and much smaller resistivity (larger conductivity, see figure S4) from this spin channel.
The spin-dependent Seebeck coefficient  calculated via equation (10) is reported in figure 7, and enables the generation of a (in general not pure) spin current from a thermal gradient.
  is found experimentally to also be negative in these three metals, and decreases monotonously as temperature increases (which is expected, as the spin splitting is reduced). The VA predicted magnitude can reach −26.45, −37.43, −65.57 and −9.74 µV K−1, for Fe, hcp Co, fcc Co and Ni, respectively, at around 600 K (for hcp Co we show the average of the three components xx, yy, and zz). We see that
  can be larger than the full Seebeck coefficient if the sign of up and down spin S are opposite (Fe, Ni) or comparable if one Sσ
is almost 0. This is an advantage for spintronics, favoring spin currents and minimizing charge currents and Ohmic losses.
can be larger than the full Seebeck coefficient if the sign of up and down spin S are opposite (Fe, Ni) or comparable if one Sσ
is almost 0. This is an advantage for spintronics, favoring spin currents and minimizing charge currents and Ohmic losses.

Figure 7. Calculated spin-dependent Seebeck coefficient as a function of temperature for (a) Fe, (b) Ni, (c) hcp Co, and (d) fcc Co, with LDA relaxed lattice constants (without SOC). The discrete symbols denote experimental data of permalloy (Ni80Fe20) and Co [51]. For each metal,  ,
,  , and
, and  represent the spin-up, spin-down, and spin-dependent Seebeck, respectively. For hcp Co, an average of the xx, yy, and zz components is shown. For Co, also note that full color is used for temperatures that the respective phase is stable according to the experimental Ttr.
Download figure:
Standard image High-resolution imageOnly a few measurements of  are available, which are for permalloy (Ni80Fe20) and Co at room T [51] (shown as discrete data in figure 7). The permalloy composition is relatively close to pure Ni, and its experimental
  at 300 K agrees remarkably well with our prediction for Ni. On the other hand, the magnitude of the theoretical value (−10.34 µV K−1) is much larger than the measurement (−1.68 µV K−1) for Co. The discrepancy can be related to the anisotropy in hcp Co, for instance,
  is −16.52 µV K−1 for the in-plane (xx or yy) components, but it becomes 2.03 µV K−1 in the out-of-plane (zz) direction (see figure S21), and the experimental value lies in between. Thermal expansion effect, EM scattering, and extrinsic effect may also contribute.
3.6. Contribution of EM scattering
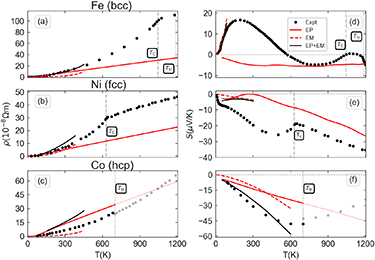
Magnon resistivity and magnon-drag Seebeck due to EM scattering were theoretically estimated in [13, 14] for low T. In figure 8, we include them and compare the experimental data with the sum of EPC and EM contributions. For resistivity below 400 K, the EM contributed ρ (also called magnetic resistivity) varies as T2 within the low-T limit [52], which better captures the T dependence of the measured data than the linear dependence from EPC. The total ρ including both EP and EM scatterings is in excellent agreement with experiment for Fe (figure 8(a)), indicating that these two mechanisms dominate and are accurately calculated in this T range. For Ni and Co (figures 8(b) and (c)), the total ρ show slight and moderate overestimation, respectively, which may suggest that the computed EPC contribution is too large, at least for Co. The EM resistivity for T > 400 K is unavailable as the underlying model is no longer valid.
Figure 8. Comparison with experimental data by considering additional contribution from electron–magnon scattering at low temperature. Electrical resistivity of (a) Fe, (b) Ni, and (c) hcp Co. Seebeck coefficient of (d) Fe, (e) Ni, and (f) hcp Co. The black discrete points denote measured data [44–47]. The red solid lines are calculated EPC contribution in the SOC case, denoted as electron–phonon (EP). The red dashed lines are estimated contributions from electron–magnon (EM) scatterings from [13, 14]. The black solid lines are sum of the EP and EM contributions.
Download figure:
Standard image High-resolution image
As shown in figure 8(d), the magnon-drag Seebeck from [14] slightly overestimates the measured S in Fe below ∼100 K, while the agreement is improved after adding the negative EPC contribution. The overall good agreement considering these two contributions is in accord with [48] where phonon drag was argued to be unimportant. In Ni (figure 8(e)), both the magnon-drag and EPC contributions to S are negative, but their sum largely underestimates the magnitude of experiment. We suggest the difference (negative bump at ∼20 K) may be ascribed to the phonon drag effect. On the other hand, magnon-drag and EPC contributions are comparable in Co (figure 8(f)), and the calculated total S agrees very well with measurement, which again implies that phonon drag effect is negligible in Co.
4. Conclusions
In summary, we have studied the spin-dependent thermoelectric properties of three FM metals, i.e. bcc iron, fcc nickel, hcp and fcc cobalt, via a fully ab initio approach considering EPC, three magnetic configurations (SP, with SOC, and NM) and two sets of lattice constants (DFT relaxed and experimental). Excepting the NM case, the calculated electronic and phonon bands are in good agreement with experiments or calculations reported in the literature. For transport properties (resistivity and Seebeck coefficient as a function of T), the agreement with measured data is reasonable, and differences are analyzed in detail accounting for other mechanisms beyond electron–phonon scattering, such as magnon-drag, phonon-drag, and the increase in spin disorder and scattering, with the gradual equalization of the up and down spin bands toward the Curie temperature. The Seebeck coefficients are also calculated using the CRTA method, which are found to yield less satisfactory results than the VA, due to the oversimplification of constant relaxation time for these magnetic metals. We also predict the so-called spin-dependent Seebeck effect in these three metals, which can give rise to a SP current via a thermal gradient, and opens new opportunities for spintronics applications. Importantly, we hope this study will help to benchmark fully first-principles methodologies for the quantitative computation of transport coefficients in magnetic materials, for which the phonon-drag and magnon-drag effect can be developed in the future by solving the coupled BTEs for the distribution functions of electrons, phonons, and magnons [53, 54].
Acknowledgments
This work is supported by the National Natural Science Foundation of China under Grant No. 12074277, Natural Science Foundation of Jiangsu Province (BK20201404), the startup fund from Soochow University and the support from Priority Academic Program Development (PAPD) of Jiangsu Higher Education Institutions. MJV acknowledges funding by the Belgian FNRS (PdR Grant No. T.0103.19—ALPS), ARC project DREAMS (G.A. 21/25-11) funded by Federation Wallonie Bruxelles and ULiege, and the CONNECT Excellence of Science Project Number 40007563 funded by FWO and FNRS. MDG acknowledges Klanik SA.
Data availability statement
All data that support the findings of this study are included within the article (and any supplementary files).
Supplementary data (6.6 MB PDF)