


Abstract
A Grüneisen relationship is defined for gases, following the formulation of the original microscopic Grüneisen ratio γ = (d ln ω)/(d ln V) for solids. In the case of gases acoustic excitations represent the modes at frequency ω to be considered. By comparing to measured Brillouin shifts in various gases (SF6, N2O, and CO2) under various conditions of pressure and temperature, a specific value of the defined ratio γ0 = 0.064 ± 0.004 is found to provide a universal description of the active modes in a gas. This finding of such universal gas law may find application in extrapolation of properties of ideal gases to regimes where those cannot be measured easily, like the acoustics and shocks at extremely high temperatures.
Export citation and abstract BibTeX RIS

Original content from this work may be used under the terms of the Creative Commons Attribution 4.0 licence. Any further distribution of this work must maintain attribution to the author(s) and the title of the work, journal citation and DOI.
1. Introduction
In the early 20th century, Grüneisen collected and analyzed the thermodynamic properties of atomic metals such as thermal expansion coefficients, internal energy, entropy and atomic volume [1, 2]. He defined a dimensionless parameter, that can be written in various forms:

with P, T, V and E the thermodynamic quantities of pressure, temperature, volume and energy. This Grüneisen parameter can be viewed as the measure of the change in pressure produced by a change in the total energy of the system under conditions of constant volume. From collecting experimental data on metals, ranging from Sodium to Bismuth, values for the dimensionless Γ parameter were found to lie in the range (1.0–2.5) [1]. This universality of a metallic property is used in condensed matter studies [3], as a measure or constraint in phase transitions and shock waves [4], as well as in geophysics [5, 6], where the properties of the Earth's interior can only be deduced from seismological data provided that Γ is understood [7].
Attempts have been made to define a Grüneisen parameter for the gaseous phase [8]. For the case of ideal gases, with P = nRT/V and E = (3/2)nRT (R the ideal gas constant) this leads to the trivial result that Γ = 2/3. This relation holds for gases consisting of monatomic species. For molecules with internal degrees of freedom, these should be taken into account, leading to Grüneisen parameters of Γ = 2/5 for diatomic molecules and smaller ones for polyatomic molecules.
However, this approach ignores the view on the Grüneisen relation, connecting it to vibrational modes in a medium, following the recognition that only specific quantized modes are permitted in a solid, as in the quantum-based analyses of the specific heat of solids [9, 10]. Already by Grüneisen himself it was shown, that a Grüneisen parameter can be defined in microscopic form:

where ωi represent the vibrational modes in a material. In fact this definition is typically used as a Grüneisen scaling parameter for the treatment of solids [11] and liquids [12, 13]. It is the rationale of the present study that this microscopic definition of the Grüneisen parameter can also be used in the treatment of gases. In a gas thermal fluctuations occur that become manifest as collective effects in the form of acoustic waves. Such acoustic excitations in a medium, propagating with the speed of sound vs, are typically observed in light scattering, where at adjacent sides of a central Rayleigh elastic peak two inelastic resonances are produced by scattering off the acoustic modes. This phenomenon of Brillouin side peaks [14] has been widely investigated, in particular since the invention of the laser via spontaneous [15] and coherent light scattering [16–19].
Typically, under different thermodynamic conditions, the Brillouin side peaks exhibit different shifts affecting the composite RB-spectral lineshape. The overall behaviour of RB-spectra can be cast into a generalised description to depend on the uniformity parameter y, which is defined as the ratio of the wavelength of incident light λi to the mean free path l between collisions [20, 21]. When y ≫ 1, such as for dense media, the light scattering process is in the hydrodynamic regime and the acoustic modes will become pronounced as side peaks in the spectral profiles [22]. In the opposite case, the Knudsen regime with y ≪ 1, the Rayleigh peak and the Brillouin peaks in the RBS spectrum are completely overlapped and the Brillouin side peaks cannot be discriminated. For the intermediary or kinetic regime,  , the overlapping area between the Rayleigh and Brillouin side peaks becomes less [23].
Studies on the Rayleigh–Brillouin (RB) spectral line shapes reveal thermodynamic properties of gases such as the elusive bulk viscosity [24], while there is the application of remote measurement of atmospheric temperature via RB-lidar [25]. Detailed models, based on thermodynamics, have been developed for RB-scattering spectra in the hydrodynamic regime [22], in the kinetic regime of lower pressures, e.g. the Tenti model [26], and for gases composed of binary constituents [27, 28]. Also molecular dynamics simulations have been explored to compute the RB-line shape [29, 30].
In the present paper we focus on the frequency shift of the Brillouin modes, in order to deduce a universal scaling analogous to the Grüneisen approach in solids, now with the acoustic mode taking the place of lattice vibrations to define a non-trivial Grüneisen ratio. A choice was made to investigate light scattering in sulphur hexafluoride (SF6), nitrous oxide (N2O), and carbon dioxide (CO2) in view of their large Raleigh scattering cross sections. Brillouin shifts are experimentally determined for these gases in a range of pressures and temperatures, with the goal of combining resulting data in a comprehensive Grüneisen approach, which will be introduced in this work.
2. Experiment
2.1. Experimental setup
A setup for measuring spontaneous RB light scattering is used with a continuous-wave laser at a wavelength of 532.22 nm, power of 5 W, and bandwidth less than 5 MHz. The setup is sketched in figure 1. The laser light travels through a gas cell and the scattered light is collected at an angle of θ = 55.7 ± 0.3°. The choice for an angle closer to forward scattering than the usual choice of perpendicular scattering (θ = 90°) provides conditions where the Brillouin side peaks are more pronounced. A similar reasoning holds for the use of green light (532 nm) resulting in more pronounced side peaks than for blue or ultraviolet light [23]. The gas scattering cell, equipped with Brewster windows, can be operated at elevated pressures up to 8 bar and a temperature control system is used to keep it at a constant temperature with uncertainty less than 0.1 °C. The RB-scattered light, collected under the fixed scattering angle, is constrained by a slit for a narrow opening angle of 0.5° to accurately define the scattering geometry. The beam of scattered light further propagates through a bandpass filter (Materion, T > 90% at λi = 532 nm, bandwidth Δλ = 2.0 nm) thereby rejecting Raman-scattered light. A Fabry–Perot interferometer (FPI), equipped with a voltage-controllable piezo transducer for varying its cavity length, is used for analyzing the spectral profile of the scattered light. The FPI was calibrated by scanning an auxiliary tunable laser (a narrowband ring dye laser) over a thousand cavity modes, yielding an accurate value for the free spectral range (FSR) of 2.9964(5) GHz. The instrument width of the FPI FWHM, yielding σ = 58.0 ± 3.0 MHz, was measured by transmitting a reference laser beam (at the fixed wavelength of 532 nm) and by scanning the piezo to determine the spectral profile of a cavity mode. The scattered photons after the FPI are detected by a PMT and stored in a computer.
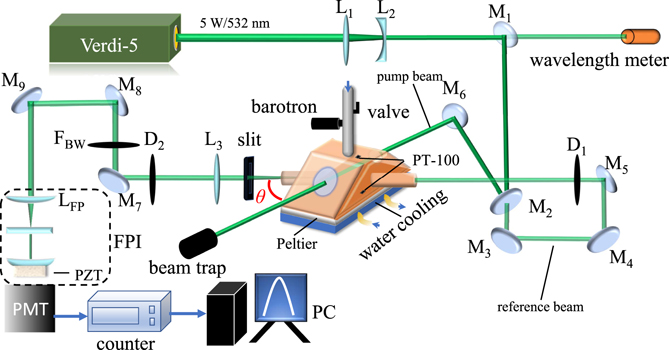
Figure 1. Configuration of the experimental setup for measuring spontaneous RB scattering. A Verdi (V5) laser provides continuous wave light at 532.22 nm, at a power of 5 W and bandwidth less than 5 MHz. Upon splitting the laser beam into two, a pump beam crosses the RB-scattering gas cell producing scattered light that is captured under an angle θ = (55.7 ± 0.3)°. A weak reference beam transmitted through mirror M2, is used for aligning the beam path after the gas cell towards the detector. The scattered light is analyzed in a Fabry–Perot interferometer (FPI), with free spectral range (FSR) of 2.9964 GHz and an instrument linewidth of (58.0 ± 3.0) MHz. It transmits a bandpass filter (FBW) for discriminating Raman scattered light. The scattered light is detected on a photo-multiplier tube (PMT). Mirrors, lenses, and diaphragm pinholes are indicated as Mi, Li, and Di. A slit of 500 μm is inserted to limit the opening angle for collecting scattered light, therewith optimizing the resolution.
Download figure:
Standard image High-resolution imageThe RB-spectral profile is measured by scanning the high-resolution Fabry–Perot analyzer at integration times of 1s for each step. A full spectrum covering a large number of consecutive RBS-peaks and 10 000 data points were obtained in about 3 h. For the methods of data collection and for a more detailed description of the experimental setup we refer to Gu et al [31].
2.2. Experimental results
RB-spectral data are collected for hexafluoride (SF6) molecular gas for the pressure regime 0.5–5 bar, in which the temperature is controlled at 293.0 K (y = [1.86, 18.41]) and results are plotted in figure 2(a). Similarly data were collected for nitrous oxide (N2O) molecular gas in a pressure range of P = 1–8 bar (y = [1.95, 14.96]), with results presented in figure 3(a). For the carbon dioxide (CO2) molecular gas RB-spectral data for pressures in the range of P = 1–4 bar and four different temperatures (T = 353 K, 332 K, 313 K, and 293 K) were recorded previously [32], and are here displayed in figure 4(a). In the case of CO2 the pressures and temperatures covered correspond to an interval for the uniformity parameter of y = [1.91, 7.55].
Experimental values for the measured Brillouin shift, through peak reading of the sidebands of the RB-spectral data, are plotted as a function of pressure in figures 2(b)–4(b). It is evident that the observed Brillouin shifts fB decrease rapidly towards low pressures, while fB approaches to a constant in the high pressure limit. Such behaviour is itself not new, and was observed for the specific example of coherent RB-scattering in air [18].

Figure 2. (a) Experimental RB-spectral profiles of SF6 measured at λ = 532.22 nm, a scattering angle of 55.7°, temperature of 293.0 K, for various pressures P; the integrated intensity is normalized. (b) Extracted Brillouin shifts from experimental data (red), and computed values from equation (7) (blue); the (grey) dashed line represents the harmonic limit corresponding to equation (3).
Download figure:
Standard image High-resolution image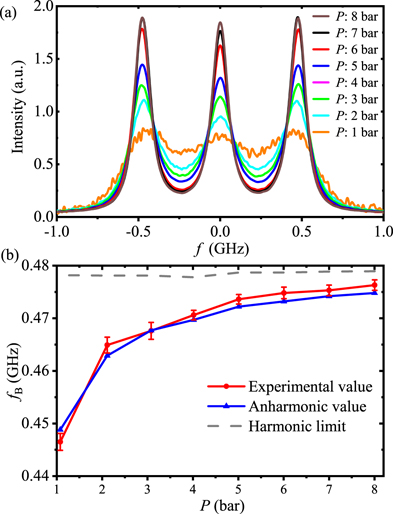
Figure 3. (a) RB-spectra for N2O gas, under different pressure conditions at T ≈ 295 K. These data were measured at an incident wavelength of λ = 532.22 nm and θ = 55.7°. (b) Extracted Brillouin shifts from experimental data (red), and computed values from equation (7) (blue); the (grey) dashed line represents the harmonic limit corresponding to equation (3); note that the line is not straight because the data at various pressures were obtained at slightly differing temperatures.
Download figure:
Standard image High-resolution image
Figure 4. (a) RB-spectra of CO2 taken under different P and T conditions, and at λ = 532.22 nm and θ = 55.7°. Data reproduced from [32]. (b) Extracted Brillouin shifts from experimental data (red), and computed values from equation (7) (blue); the (grey) dashed lines represent the harmonic limits corresponding to equation (3), as computed for the different temperatures.
Download figure:
Standard image High-resolution imageFor solids, the acoustic wavelength is generally much larger than the crystal lattice constant, hence the atomic discontinuity can be ignored. This also holds for liquids. Debye's phonon theory [10] describes the vibrational modes, with elastic standing waves in the crystal lattice being independent and the interaction between corresponding phonons negligible. The elasticity results in a harmonic approximation. The values of the Brillouin shift can be derived in terms of angular frequency  or frequency
  [23, 33]:

where λi is the wavelength of the light, θ the scattering angle, ni the refractive index, and vs the sound speed with [33]:

with m the molecular mass, cp and cv the specific heats, and kB the Boltzmann constant. Here cv = ctrans + ci, with the translational heat capacity ctrans equalling 3R/2 (for three translational degrees of freedom). For the internal heat capacity ci we adopt a result obtained in previous studies on the modeling of RB-scattering, where it was shown that the vibrational relaxation is frozen under the high-frequency conditions of Brillouin scattering. This was discussed in results for SF6 [34], N2O [35] and CO2 [32]. Hence, only rotational degrees of freedom are considered, and for SF6 ci = 3R/2 is taken, and ci = R for N2O and CO2. Hence, the specific heat ratio cp/cv is taken as 4/3 for SF6, and 7/5 for N2O and CO2 in the evaluation of the Brillouin shift.
By evaluating equations (3) and (4) the values for the Brillouin shift fB can be computed and be found independent of pressure. Results are displayed in figures 2(b)–4(b), where in the last case of CO2 the computation is performed for various temperatures. The experimental values for the Brillouin shift for the highest pressures approach the thus computed values for fB. Indeed, this is congruent with the fact that at high pressures the distance between gas molecules decreases and enters the hydrodynamic regime, where the discontinuity between the gas molecules becomes negligible and the gas can be considered as an elastic medium. With the decrease of pressure, fB decreases and deviates gradually from the values of this model, based on elastic waves and an harmonic approximation. Hence we conclude, that results from this harmonic approximation are not in agreement with experimental findings.
3. Microscopic Grüneisen parameter for gases
For an analysis of the differences between the calculated harmonic values and experimental values, the microscopic definition of the Grüneisen parameter will be used for the treatment of gases.
In gases, the sound wavelength becomes comparable to the molecular mean free path [36], in particular at low pressures [37]. Hence, the molecular discontinuity and the interaction between phonons cannot be ignored. This theory, that goes beyond Debye's phonon theory of elastic waves, will be referred to as anharmonic.
To take the anharmonic effect into account, we resort to the microscopic formulation of the Grüneisen relationship, as in equation (2), describing the dependence of the phonon frequency ω on the molar volume of the medium V [38]. The negative sign indicates that as molar volume V increases, the phonon frequency decreases. If the Grüneisen parameter γ is considered as a constant and independent of pressure, based on equation (2), the anharmonic Brillouin angular frequency shift can be deduced by integration:

For high pressures the phonon angular frequency approaches the limit of ωB and the harmonic approximation prevails, as in solids and liquids. Hence, for the scaling constant ω0 we adopt  and we will refer to it as the harmonic limit. The molar volume V0 is taken at the reference temperature of T0 = 273 K and reference pressure of P0 = 1 bar. When fitting the experimental data with the predicted values from equation (5), a large deviation results by adopting a pressure-independent γ. Therefore, the assumption of γ as a constant value for gases does not hold, although it is generally adopted in condensed matter physics.
It had indeed been pointed out that for low density matter, the Grüneisen parameter should not be taken as a constant [39, 40], but rather in a linear relationship as γ(V) = γ0 V/V0, with molar volume V, and γ0 a reference Grüneisen parameter under reference density n0, and reference molar volume V0. The phonon angular frequency can then be obtained for the anharmonic case as:

Compared with equation (5), the dependence of the Brillouin shift on the system molar volume turns into an exponential relationship rather than a power-law relationship. Again, we can equate the integration constant ω0 to  as occurring in the harmonic limit.
The analysis based on the microscopic Grüneisen parameter yields an expression for the Brillouin shift that scales with molar volume or equivalently, the pressure via equation (6). In this way the microscopic Grüneisen parameter enters the expression for the Brillouin shift. By rewriting the volume V via the ideal gas law PV = nRT (R the universal gas constant) the derivation finally yields:

This result is important since it explicitly yields a pressure dependence of the Brillouin shift.
In the first example the experimental values obtained for SF6 gas were inserted in the equation, while a fit was made to extract the value of γ0. The comprehensive data set for SF6 for all pressures led to a single value of γ0 = 0.068. In this approach the experimental data for the Brillouin shift could be reproduced within a relative error in γ0 as small as 0.8%–1.3% for the wide range of pressures studied experimentally. This is graphically shown in figure 2(b). The blue curve representing the thus obtained anharmonic values agree very well with the experimental data for the Brillouin shifts, represented by the red points.
As for the second example Brillouin shifts were measured for N2O molecular gas at λi = 532.22 nm and θ = 55.7°. Experimental results compared with the anharmonic approach are presented in figure 3(b). Again very good agreement is found with the measured values for the Brillouin shift for a microscopic Grüneisen parameter, in this case for a fitted value of γ0 = 0.063.
In the third example the experimental RB-spectral data for CO2, as previously reported [32], were reanalyzed in the framework of the present Grüneisen approach. The Brillouin shifts obtained from the experiments agree well with the prediction from equation (7), where now a value of γ0 = 0.060 is fitted. For these data of CO2 a harmonic limit is computed for each temperature in view of the fact that fB depends on temperature via the velocity of sound, cf equation (4). This gives rise to a scaling of the harmonic limit with  , quantitatively in agreement with the high-pressure asymptotic values as obtained in experiment. For RB-shifts at lower pressures an additional exponentially decaying temperature dependence comes into play, which is explicit in equation (7). Hence in this example of the CO2-data the approach of the microscopic Grüneisen relation is extended to varying temperatures.
The consistency of the presented experimental results with a microscopic Grüneisen model for ideal gases is shown to be valid for gases of various nature, various spherical and linear geometries, various masses, various degrees of freedom, various specific heat ratios cp/cv, and measured under different conditions of gas pressure and temperature. In all cases the model predicts and quantitatively explains a drop in the Brillouin shift toward lower pressures, by invoking only a single scaling parameter which adopts a single universal value for all examples analyzed. When averaged over all comprehensive data we find γ0 = 0.064 ± 0.004.
To further demonstrate this apparent universal scaling of the Brillouin shift we combine the equations for the Brillouin shift in the harmonic limit  with the predicted shift in the anharmonic case as used in the microscopic Grüneisen approach,
  , to yield:

In figure 5 this universal relationship is plotted for all data on all three molecules analyzed here. The full line represents the theoretical curve for  as a function of (RT/V0
P), averaged over all data with γ0 = 0.064, while the singular data entries represent the values of experimental shifts scaled to the harmonic limit
as a function of (RT/V0
P), averaged over all data with γ0 = 0.064, while the singular data entries represent the values of experimental shifts scaled to the harmonic limit  . The slope represents the dimensionless Grüneisen parameter γ0, which is in case of the data for CO2 modified for the temperature appearing in the exponent of equation (7). As 1/P approaches zero, hence at the origin, the Brillouin shift equals the value fB, i.e. the harmonic limit.

Figure 5. Universal behaviour of the Brillouin shift in gases, captured by a single parameter γ0. Individual data points relate to the experimentally determined Brillouin shifts for the three gases (at various pressures and temperatures), indicated with symbols specified in the legend, and scaled to the value of the harmonic limit fB. The full line represents the slope computed from equation (8) for the fitted values of γ0 = 0.064.
Download figure:
Standard image High-resolution image
The graphical representation of all collapsed data in figure 5 provides proof that γ0 is an effective dimensionless parameter in the realm of gases, analogous to the microscopic Grüneisen parameter defined for solids in the early 20th century. With the increase of 1/P, the anharmonic effect generates a considerable deviation of the Brillouin shift from the value fB, which is a value that can be obtained from a model involving harmonic oscillations induced by temporal fluctuations, here treated as a harmonic limit. As illustrated in figures 2–4, the experimental data in the kinetic and hydrodynamic regimes are well fitted by equation (7). The here derived microscopic Grüneisen relationship and the universal parameter is expected to be applicable to a wider range of pressure conditions, especially at lower pressures when a traversal is made from the kinetic regime to the Knudsen regime. As is known from RB-scattering studies at low pressures, e.g. for sub-atmospheric pressures prevailing in the upper layers in the Earth's atmosphere [23], the Brillouin shifts at adjacent sides of the central Rayleigh peak can no longer be distinguished. With the knowledge of the Grüneisen parameter γ0, extrapolations can be made on the collective properties in such dilute gaseous media.
4. Conclusion
In summary, a Grüneisen relationship was derived for ideal gases, that goes beyond a trivial approach discarding acoustics and that had led to a Grüneisen ratio of 2/3. The approach chosen was based in analogy to the formulation of the original microscopic Grüneisen ratio [1, 2] for solids. Key feature is that thermal fluctuations and resulting acoustic modes take the place of lattice vibrations, but their motion is shown to be anharmonic. By comparing to measured Brillouin shifts in various gases (SF6, N2O, and CO2), a specific value of the defined ratio γ0 = 0.064 ± 0.004 turned out to provide a universal description of the acoustics in a gas, represented by the Brillouin shift. It is noted that the actual value found for γ0 is somewhat arbitrary, since it depends on the specific choice of reference parameters, the gaseous properties n0, P0, V0 and T0. This finding of a universal gas law may find application in extrapolation of properties of ideal gases to regimes where those cannot be measured easily, like the acoustics and shocks at extremely high temperatures, or the study of collective effects at low pressures.
Acknowledgments
This work was supported by the Natural Science Foundation of China under Grant No. 62175072, and the Open Project of State Key Laboratory of Low-Dimensional Quantum Physics (Grant No. KF202008). YW thanks the Chinese Scholarship Council for support for his stay at VU Amsterdam, and VUA for their hospitality as well as the support from International Postdoctoral Exchange Fellowship Program (Talent-Introduction Program).
Data availability statement
The data that support the findings of this study are available upon reasonable request from the authors.