


Abstract
Laser interaction with doped crystals exhibiting photon–photon and photon–phonon coupling has been focused on recently. In pretext, here we report the spectral and temporal profile interaction of two lasers excitation through various phases of Eu3+: BiPO4 crystals. We reveal that spectral-temporal profile interaction of hybrid signals (coexisting fluorescence and spontaneous four-wave mixing) are dressed by nested and cascade processes of two-photons (two-phonon). Such interaction comes from thermal phonon constructive and phase transition phonon destructive dressing. The spectral and temporal (profile) interactions are interrelated and reduced by about 2-times due to two-photon nested dressing in contrast to the interaction through the sum of each laser excitation. In contrast to a single laser, spectral (Fano)-dip interaction reduces by 2-times due to two-photon destructive dressing coupling. Moreover, thermal phonon dressing at 300 K exhibits 3-times more extensive temporal interaction than that at 77 K. The phase transition phonon dressing for a half hexagonal and half low-temperature monoclinic phase is about 1.5-times longer than that of the pure hexagonal phase of Eu3+: BiPO4. These results may help to understand the spectral-temporal relationship in the fields of nonlinear and quantum optics.
Export citation and abstract BibTeX RIS

Original content from this work may be used under the terms of the Creative Commons Attribution 4.0 licence. Any further distribution of this work must maintain attribution to the author(s) and the title of the work, journal citation and DOI.
1. Introduction
Rare-earth-doped crystals are exciting candidates for quantum storage applications in terms of atomic coherence. Different coherence time has been demonstrated by using electromagnetically induced transparency (EIT) procedures or photonic entanglement in a crystal [1–4]. Such strategies, for example, optically addressable nuclear spins in solids, can be used for optical storage [2].
Phase transition or lattice symmetry of a functional crystal is one of the important factors in determining its physical properties [5, 6]. Present theoretical and experimental studies make available an in-depth understanding of the morphological, structural, electronic, and optical properties of different phases of bismuth phosphate BiPO4 [7–10]. The Eu3+-doped BiPO4 crystals with different phases have been reported [10]. The phase transition of BiPO4 from low-or-high temperature monoclinic phase (LTMP-or-HTMP) to hexagonal phase (HP) occurs through continuously doping trivalent Ln3+/Eu3+ ions. Their different samples composition proportions i.e., 6:1 (half HP + half LTMP), 1:1 (more HP + less LTMP), 0.5:1 (pure HP), 7:1 (pure LTMP) and 20:1 (less HP + more LTMP), exhibits different phonon detuning [11]. Different crystals structure determines different lattice vibration frequencies of phase transition phonon. Therefore, different structure phase transitions suggest diverse phonon dressing.
Investigations on photon–photon dressing coupling of double-dark states and splitting of a dark state have been well-thought-out [12, 13]. Similarly, inevitable entanglement through different atomic-like systems requires strong spin-phonon coupling to exceed the coherence time of phonon [14, 15]. Hence, spin-nanomechanical setup with robust, intrinsic, and tunable magneto-mechanical couplings tolerates the construction of hybrid quantum devices [16, 17]. Photon coupling with thermal and phase transition phonons brings up the phenomena of spectral-temporal interaction.
In this paper, we investigate the spectral-temporal profile of dressed hybrid signals based on different phonons vibrational frequencies in five types of crystal lattices. The spectral-temporal profile interaction originates from the pattern of connecting spectrums at different time-gate positions to form a time domain signal. Such interaction of broadband and narrowband excitation is demonstrated at different temperatures. High temperature exhibits more extensive temporal interaction in contrast with low temperature. Further, the relationships among spectral-temporal profile interaction, spectrum (Fano)-dips interaction, and temporal Autler Townes (TAT) splitting interaction are introduced for the different phase transitions.
2. Experimental setup
Temporal interaction with photon–phonon dressing coupling is studied in five types (different molar ratio represents different phases) Eu3+: BiPO4 crystals with C1 symmetry (less phonon) and D2 symmetry (more phonon) [9]. To implement the experiments, samples were held in a cryostat (CFM-102). Figure 1 shows the fine structure of Eu3+: BiPO4 crystals exhibit transition (7F1 → 5D0) between levels |k⟩ and |l⟩. We used two tunable dye lasers (narrow scan with a 0.04 cm−1 linewidth) pumped by an injection-locked single-mode Nd: YAG laser (continuum power lite DLS 9010, 10 Hz repetition rate, 5 ns pulse width), to generate pumping fields Ei
(ωi
, Δi
). The frequency detuning is defined as Δi
= Ωkl
− ωi
, where Ωkl
represents the frequency of atomic transition between crystal field splitting levels 5D0 and 7F1 and ωi
= (i − 1, 2) is photon frequency. The photon Rabi frequency is described as Gi
= μkl
Ei
/ℏ, where μkl
is the dipole moment, the crystal field splitting between different states 5D0 and 7F1 excited by Ei
between levels |k⟩ and |l⟩. The output out-of-phase fluorescence (FL) signals (EFL1) and (EFL2) are generated by broadband excitation E1 and narrowband E2, respectively. The term hybrid signal correspond to the coexistence of FL and spontaneous four-wave mixing (SFWM). Hybrid signals can be selected from specific energy levels through boxcar time-gated integrators by controlling time-gate position and time-gate width (integration duration) [18]. Because the decay rates of broadband and narrowband excitations vary with changes in the controlling parameters, a boxcar time-gate position can be used to differentiate them at two photomultiplier tubes (PMT's). The detailed setup conditions are specified by Fan et al [19]. The in-phase SFWM (ES1) signals under phase-matched conditions, which ( ) is produced by broadband E1 and its reflection
  , while the second in-phase SFWM (ES2) is obtained through narrowband E2 and its reflection
  with (
 ). The hybrid signal (coexisting FL and SFWM) in five crystal phases of Eu3+: BiPO4 are collected through PMT's via confocal lenses. The characteristics of the output hybrid signal can be changed by adjusting different parameters such as time-gate position, laser power, detector location, and temperature. Here we pronounce temporal interaction (intensity profile, TAT splitting) as the time domain interaction (resonance or off-resonance) signals of two lasers, which are controlled by thermal phonon and phase transition phonon dressing. Such thermal phonon dressing and phase transition phonon detuning is controlled by temperature and different samples, respectively.
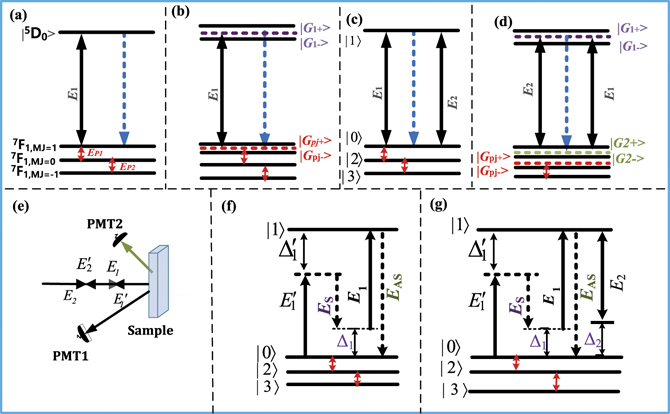
Figure 1. (a) Fine structure energy level diagram of Eu3+: BiPO4 for transition 7F1 → 5D0. (b) Single laser double dressing (c) double laser no dressing (d) double lasers double dressing (e) schematic diagram of the experimental setup. (f) Stokes/anti-Stokes generation in a two-level system E1 via SFWM (g) generation of Stokes/anti-Stokes in a three-level system with E2 dressing. E2 excitation is similar to (f) and (g). Temporal interaction of hybrid signal considers both E1 and E2 excitation.
Download figure:
Standard image High-resolution imageBy scanning laser field wavelength and changing boxcar time-gate position, we get the spectral resolved and temporal resolved signals, respectively. Then the spectral-temporal profile interaction of two lasers can be realized by connecting many spectrums at different gate positions.
Different frequency phonon is exciting different crystal field splitting levels of 7F1 (figures 1(a)–(d)) in the ion Eu3+. The photon–phonon coupling appears to be essential in our experiments. Photon excites atomic coherence between 5D0 and 7F1 can be coupled to phonon excitation atomic coherence of 7F1. Unlike atomic coherence between different states of crystal field splitting of photon excitation, the atomic coherence in the same state of crystal field splitting of phonon excitation is far more difficult to control. Because the photon excitation source is generated by lasers, phonons excitation comes from BiPO4 crystal lattice vibrations. Different crystal structures determine different vibration frequencies. Broadband excitation couples to more lattice vibration while narrowband excitation is coupled to less lattice vibrations. Photon coupling with thermal phonon and phase transition phonon causes the phenomena of spectral-temporal interaction. High temperatures create more phonon numbers which result in a stronger spectral-temporal profile interaction. The low temperature result in less phonon number, which creates low intensity background and weak profile intensity interaction. However, the phase transition phonon dressing destroys the temporal profile intensity interaction.
3. Basic theory of spectral and temporal interaction
When two lasers are switched on, the density matrix of the accompanying second-order FL via perturbation chain  for Gi
can be written as
for Gi
can be written as

Where i = 1, 2 shows the laser E1, and E2, respectively. The decay rate of the FL signal can be written as ΓFL = Γ10 + Γ11. 
 shows four dressing terms. Where Gp1, Gp1, Δp1, Δp1 represents phonon1 and phonon2 Rabi frequency and detuning, respectively. The phonon Rabi frequency can be described similarly as Gpj
= −μmn
Epj
/ℏ and μmn
is the dipole moment between |m⟩ and |n⟩ of crystal field energy levels in the same state 7F1. Epj
is the phonon field. The phonon detuning Δpj
= Ωmn
− ωpj
, where Ωmn
is the resonant frequency between |m⟩ and |n⟩, and ωpj
is the frequency of phonon field, which is determined by vibrational frequency of crystal lattice state mode [18].
shows four dressing terms. Where Gp1, Gp1, Δp1, Δp1 represents phonon1 and phonon2 Rabi frequency and detuning, respectively. The phonon Rabi frequency can be described similarly as Gpj
= −μmn
Epj
/ℏ and μmn
is the dipole moment between |m⟩ and |n⟩ of crystal field energy levels in the same state 7F1. Epj
is the phonon field. The phonon detuning Δpj
= Ωmn
− ωpj
, where Ωmn
is the resonant frequency between |m⟩ and |n⟩, and ωpj
is the frequency of phonon field, which is determined by vibrational frequency of crystal lattice state mode [18].  represents two laser nested dressing. The G1(G2) excite the transition between levels 7F1(MJ=1) → 5D0(MJ=0) in figure 1(a). Similarly,
  represents two phonon nested dressing. The Gp1 and Gp2 exciting transition of sub-levels MJ = 0, MJ = ±1 and transition of sub-levels MJ = 0, MJ = −1 of 7F1, respectively. In general, temperature control phonon Rabi frequency i.e.,
  and phonon detuning controls vibration frequency i.e., Δpj
= Δps
. Where j = T, S represents thermal and phase transition phonon, respectively. For simplicity, in our experiments, phonon1 is related to phonon Rabi frequency i.e.,
and phonon detuning controls vibration frequency i.e., Δpj
= Δps
. Where j = T, S represents thermal and phase transition phonon, respectively. For simplicity, in our experiments, phonon1 is related to phonon Rabi frequency i.e.,  and phonon2 is related to the vibration frequency i.e., Δp2 = Δps
.
and phonon2 is related to the vibration frequency i.e., Δp2 = Δps
.
In figure 1, such phonon1 or phonon2 fields excite the atomic coherence ( ,
,  ) between
  (MJ = 0) and
  (MJ = 1), or the atomic coherence (
 ,
,  ) between
  and
and  (MJ = −1), respectively, in the same state 7F1. While, E1 or E2 excites the atomic coherence (
 ,
,  ) between different state crystal field splitting levels
  (5D0) and
  (7F1). The E1 and E2 atomic coherences couple to the phonon1 atomic coherence through the level
  , while phonon1 and phonon2 atomic coherences couple through level
  .
.
In Λ-type three-level system, third-order stokes  via
via  for Ei
can be written as
for Ei
can be written as

The decay rate of the Stokes signal can be written as ΓS = Γ20 + Γ00 + Γ20. The intensity of two laser temporal profile interaction of the measured FL and Stocks signals can be described as


Where τ(2) = tCF + τinter, τ(2) ≠ τ01 + τ02, and τ01(G1) and τ02(G2) represents the TAT splitting (delay time) for broadband and narrowband excitations, respectively. The τ0i
= tcf + tphot + tphon results from the involvement of crystal field (tcf), photon dressing (tphot), and phonon dressing (tphon) terms. τinter is related to two lasers' photon–phonon coupling term and tp
is the pulse width.  and
and  denotes the sharp peak and broad shoulder respectively. Equation (3) shows the interaction of the spectral-temporal signal at near time-gate while equation (4) shows the spectral-temporal interaction at far time-gate. The intensity of the spectral-temporal interaction from hybrid signals can be obtained by

Where F(t) is the hybrid signal time domain function, which includes the time domain function terms from equations (3) and (4).
We demonstrate the relationship between temporal AT splitting and spectral AT splitting in atomic-like media by taking Eu3+: BiPO4 as an example. The spectral AT splitting corresponds to the dressed states  created by Ei
which splits the state
created by Ei
which splits the state  into two dressed states
  . If we set
  as the frequency reference point, then by using Hamiltonian
  , where SAT splitting distance can be written as
  [20]. For the time-domain signal, the frequency of the input beam Ei
is fixed at the resonant point (Δ = 0). The distance between two peaks in time domain intensity signal (τ01 = tcf + tphot + tphon) or (τ02 = tcf + tphot + tphon) is caused by the residual particles in
[20]. For the time-domain signal, the frequency of the input beam Ei
is fixed at the resonant point (Δ = 0). The distance between two peaks in time domain intensity signal (τ01 = tcf + tphot + tphon) or (τ02 = tcf + tphot + tphon) is caused by the residual particles in  (bright state) transferring to
  (dark state) through a phonon-assisted non-radiative transition determined by phonons. The total TAT splitting interaction depends upon the dressing effect and phonon-assisted non-radiative transition, whereas SAT splitting interaction is caused by the dressing effect only.
4. Experimental results
The spectral-temporal signals in figures 2–7(a)–(d) can be observed at different boxcar time-gate positions from connecting spectrums, which are demonstrated in a pattern in figures 2–7(e)–(h), with different experimental conditions. Such spectral-temporal profiles for (one laser broadband (or narrowband) excitation (figures 2–7(a) and (c)) and its interaction for two laser excitations (figures 2–7(b) and (d))), corresponding to their temporal profiles in figures 2–7(i) and (k) and figures 2–7(j) and (l), respectively.
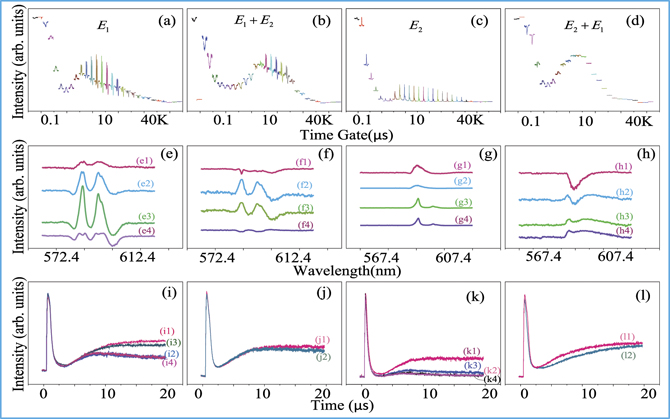
Figure 2. Shows spectral and temporal intensities from the hybrid signals from half HP and half LTMP (6:1) of Eu3+: BiPO4 at 300 K and 200 ns gate width. (a) Shows the connecting spectral intensity when E1 is scanned from 572.4 nm to 612.4 nm while E2 is blocked. (b) Shows the connecting spectral intensity when E1 is scanned from 572.4 nm to 612.4 nm while E2 is fixed at resonance (590 nm). (c) Shows the connecting spectral intensity with a low-power excitation E2 is scanned from 567.4 nm to 607.4 nm while E1 is blocked. (d) Shows the connecting spectral intensity when E2 is scanned from 567.4 nm to 607.4 nm while E1 is fixed at 549.3 nm. k = 1000 is the multiple values. (e)–(h) Show the selecting overlapping figures and (i)–(j) show temporal intensities corresponding to (a)–(d), respectively.
Download figure:
Standard image High-resolution image
Figure 3. Shows the spectral and temporal intensity of the hybrid signals from more HP + less LTMP (1:1) of Eu3+: BiPO4. The rest of the experimental parameters and experimental conditions are the same as in figure 2.
Download figure:
Standard image High-resolution image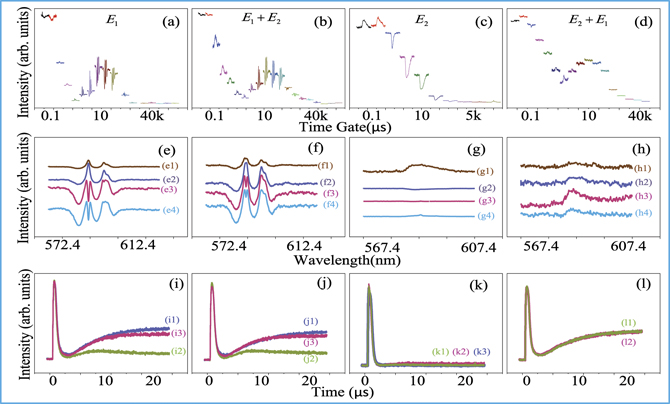
Figure 4. Shows the spectral and temporal intensity of the hybrid signals obtained from pure HP (0.5:1) of Eu3+: BiPO4. The rest of the experimental parameters and experimental conditions are the same as in figure 2.
Download figure:
Standard image High-resolution image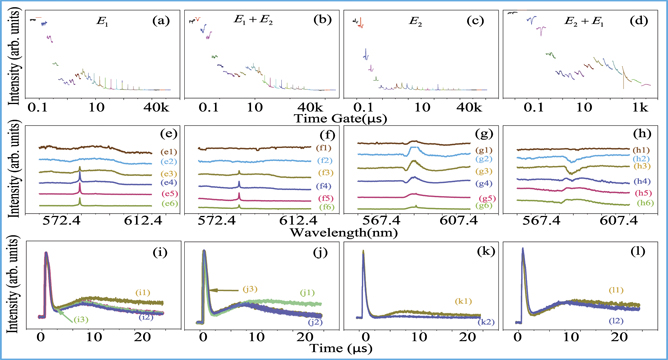
Figure 5. Shows the spectral and temporal intensity of the hybrid signals obtained from half HP + half LTMP of Eu3+: BiPO4 at 77 K. The rest of the experimental parameters and experimental conditions are the same as in figure 2.
Download figure:
Standard image High-resolution image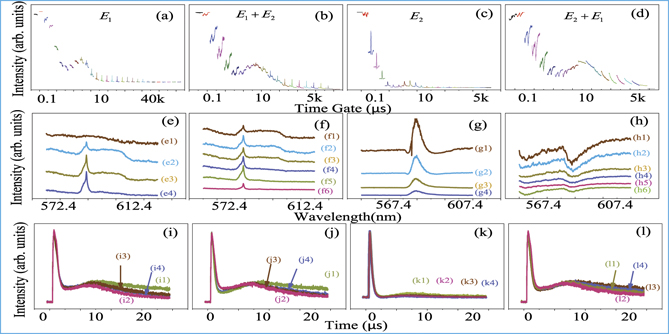
Figure 6. Shows the spectral and temporal intensity of the hybrid signals obtained from the more HP + less LTMP of Eu3+: BiPO4. The rest of the experimental parameters and experimental conditions are the same as in figure 5.
Download figure:
Standard image High-resolution image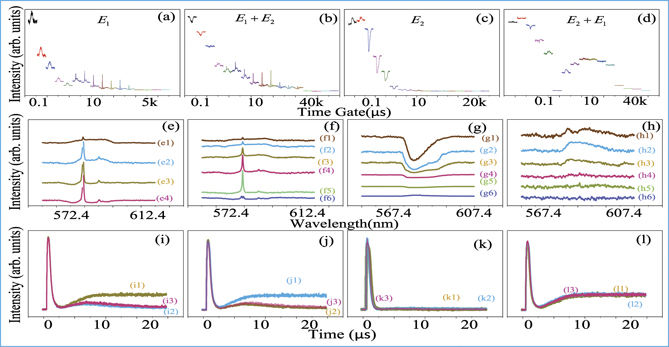
Figure 7. Shows the spectral and temporal intensity of the hybrid signals from pure HP of Eu3+: BiPO4. The rest of the experimental parameters and experimental conditions are the same as in figure 5.
Download figure:
Standard image High-resolution imageFurther, we deliberate the one laser temporal intensity of hybrid signals and two laser temporal intensity profile destructive interactions in figures 2–7(i)–(l), corresponds to spectral-temporal profile (figures 2–7(a)–(d)). The temporal profile consists of a resonance term Ri
(i = 1, 2), a non-resonance term Ni
for one laser excitation (figures 2–7(i) and (k)). Similarly, the two lasers temporal intensity ( ) profile interaction (figures 2–7(j) and (l)) consists of a resonance interaction term
  , non-resonance interaction term
  (equation (5)). When broadband excitation (Ei
) is scanning while narrowband excitation (E2) is fixed at resonance in figures 2–7(j), the temporal profile interaction resonance term originated from two resonance and two non-resonance terms i.e.,
(equation (5)). When broadband excitation (Ei
) is scanning while narrowband excitation (E2) is fixed at resonance in figures 2–7(j), the temporal profile interaction resonance term originated from two resonance and two non-resonance terms i.e.,  in figures 2–7(j1). The temporal profile interaction non-resonance term originates from two non-resonance and one resonance term i.e.,
  (figures 2–7(j2)). Similarly, when E2 is scanning E1 is fixed at resonance in figures 2–7(l), the two lasers temporal profile interaction resonance terms are equal i.e.,
  in figures 2–7(l1) while the non-resonance term can be written as
  (figures 2–7(l2)). The difference between
  or
or  represents the strength of temporal profile interaction.
4.1. Interaction with thermal phonon dressing for three phase transitions
In figure 2, we discuss the spectral and temporal outputs from half HP and half LTMP (6:1) of Eu3+: BiPO4. Here, we discuss the one laser broadband (or narrowband) spectral dressing dip (figures 2(a) and (c)) and two lasers spectral profile intensity interactions (figures 2(b) and (d)). Figure 2(a) and (e) shows a single dressing dip at 10 μs of time-gate positions through broadband excitation, which supports thermal phonon  dressing from
  (equations (1) and (2)). Here E1 atomic coherence couples the thermal phonon atomic coherence. The narrowband excitation in figures 2(c) and (g) includes only photon2 dressing
  from equations (1) and (2) and results in no dressing dip at 10 μs time-gate positions. The spectral profile (figures 2(b) and (d)) shows two photons and two phonon coupling dressing
 in the hybrid signal from equation (5).
The dressing dips intensity interaction is the difference in intensities between dressing dips in figures 2(b) and (d), and the sum of dressing dips intensities originates from E1
,
E2 in figures 2(a) and (c), respectively. The dressing dips interaction is destructive if the intensity of the sum of the dressing dips from the single laser figures 2(a) and (c) is greater than the intensity of dips originated from two lasers destructive dressing figure 2(b). Due to two photons nested destructive dressing  in the hybrid signal (equation (5)), the dressing dips interaction reduces about 2-times (figure 2(b)) as compared to the above sum exhibited by broadband (figure 4(a)) and narrowband (figure 4(c)) laser excitations. Similarly, destructive spectral dips intensity interaction exhibits in figure 2(d) while the increase in the background owing to contribution from E1. Such destructive interaction comparison of two lasers is controlled by thermal phonon Rabi frequency (GpT
) in figures 5(b) and (d) and phase transition phonon detuning (ΔpS
) in figures 4(b) and (d).
in the hybrid signal (equation (5)), the dressing dips interaction reduces about 2-times (figure 2(b)) as compared to the above sum exhibited by broadband (figure 4(a)) and narrowband (figure 4(c)) laser excitations. Similarly, destructive spectral dips intensity interaction exhibits in figure 2(d) while the increase in the background owing to contribution from E1. Such destructive interaction comparison of two lasers is controlled by thermal phonon Rabi frequency (GpT
) in figures 5(b) and (d) and phase transition phonon detuning (ΔpS
) in figures 4(b) and (d).
Since the difference between resonance and non-resonance terms ( or
or  ) represents the strength of temporal profile interaction, so the destructive temporal profile interaction resonance term
  from figure 2(j1) decreases about 3-times in contrast to the one laser resonance term in figure 2(i1) i.e.,
  , this is due to
  suppressed by two lasers destructively dressing. In addition, the difference in
  (figure 2(j1)) and
  (figure 2(j2)) is almost equal to the difference between
  (figure 2(l1)) and
  (figure 2(l2)), suggesting the strength of the two laser temporal profile interaction is similar in figures 2(j) and (l). Comparing the resonance terms of broadband and narrowband excitations, R1 + N1 (figure 2(i1)) is 2.5-times greater than R2 + N2 in figure 2(k1). Similarly, about 6-times higher non-resonance exhibits for broadband excitation (figure 2(i2)) than that of narrowband excitation (figure 2(k2)) i.e., N1 ≫ N2.
Further, we demonstrate TAT splitting for one laser broadband (or narrowband) and its interaction for two laser excitations. The TAT splitting between the sharp peak and broad shoulder (figure 2(i)) for broadband excitation, can be written as τinter < τ01 + τ02 − 2tcf where tphot = tpT
+ tpS
and tpT
, tpS
represent thermal phonon and phase transition phonon splitting terms, respectively. For narrowband excitation (figure 2(k)) τ02 = tcf + tphot. In figure 2(i) τ01 = 10 μs is greater than τ02 = 6 μs (figure 2(k)) due to broadband excitation including phonon splitting. The destructive profile interaction (figures 2(j) and (l)) is sensitive to photon dressing (tphot) and phonon dressing (tphon) while insensitive to crystal field splitting (tcf). Because of τinter, the two lasers, TAT splitting (τ(2)) with destructive nested dressing  is smaller than the sum of TAT splitting without crystal field splitting of each laser i.e., τinter < τ01 + τ02 − 2tcf (equations (3) and (4)). The TAT splitting interaction is much smaller than the observed difference between TAT splitting in figures 2(j) and (l) and the sum of two single laser TAT splitting in figures 2(i) and (k) i.e., τinter ≪ τ01 + τ02.
In figure 3, the spectral-temporal profile interaction is studied for the crystal structure (more HP + less LTMP). Different sample crystals structure determines different lattice vibration frequencies of phase transition phonon. According to Gpj = −μmn Epj /ℏ with constant Ωmn , ωpj is increased due to change in the crystal phase (figure 3) as compared to figure 2. The medium ωpj (figure 2) and larger ωpj (figure 3) results in Δpj (off-resonance) and Δpj (near-resonance), respectively.
Next, we show that the temporal intensity profile (figures 3(i)–(l)) is reduced by more phonon dressing as compared to figures 2(i)–(l). Such interaction of resonance term  (figure 3(j1)) is caused by the phase transition phonon detuning effect. The temporal profile interaction (figure 3(l1)) resonance term becomes equal to that of figure 3(j1) i.e.,
  . The difference in
  . By comparing figures 3(j1), (j2), (i1) and (i2), we realize that
  is decreased about 2-times i.e.,
  due to two lasers destructive dressing while
  is enhanced about 2-times i.e.,
  due to contributions from R2 > 0. Furthermore, the TAT splitting of one laser and two laser excitations (figures 3(i)–(l)) can be explained the same as figures 2(i)–(l).
In comparison with figures 2 and 3, figure 4 shows destructive spectral-temporal interaction for the pure HP, suggested by more phase transition phonon dressing. Such crystal structure results in the largest vibration of phonon frequency (ωpj
) i.e., Δpj
≅ 0 (resonance phase transition phonon dressing) when compared to figures 2 and 3(a). The one laser broadband excitation supports  coupling dressing and exhibits three dressing dips in figure 4(a) due to phonon frequency approaching Δpj
≅ 0 in contrast to the single dressing dip in figure 2(e). Here broadband excitation atomic coherence is coupled to thermal phonon and phase transition phonon atomic coherence. As narrowband excitation does not support the phonon dressing, therefore, an increase in ωpj
(figure 4(c)) does not exhibit any change, and the results are consistent with figure 2(c). However, the two laser spectral dips intensity interaction in figure 4(b) decreases about 1.33-times due to phonon nested dressing
coupling dressing and exhibits three dressing dips in figure 4(a) due to phonon frequency approaching Δpj
≅ 0 in contrast to the single dressing dip in figure 2(e). Here broadband excitation atomic coherence is coupled to thermal phonon and phase transition phonon atomic coherence. As narrowband excitation does not support the phonon dressing, therefore, an increase in ωpj
(figure 4(c)) does not exhibit any change, and the results are consistent with figure 2(c). However, the two laser spectral dips intensity interaction in figure 4(b) decreases about 1.33-times due to phonon nested dressing  . In contrast to figure 2(b). The two laser spectral-temporal profile destructive interaction in figure 4(d) can be explained in a similar fashion as figure 2(d).
Next, we emphasize and suggest that both the resonance and non-resonance terms of the temporal intensity profile interaction are strongly affected by more phase transition phonon dressing. Such interaction resonance term  in figure 4(j) reduced about 1.5 times compared to figure 2(j). The phase transition phonon detuning (ΔpS
≅ 0) is at resonance in figure 4(l) as compared to figure 2(l), which suppresses the interaction through
in figure 4(j) reduced about 1.5 times compared to figure 2(j). The phase transition phonon detuning (ΔpS
≅ 0) is at resonance in figure 4(l) as compared to figure 2(l), which suppresses the interaction through  dressing in the hybrid signal (equation (5)). Here
  in figure 4(l1) is completely overlapped by
  (figure 4(l2)) i.e.,
  . The two lasers temporal profile interaction disappears in figures 4(k) and (l) owing to no difference exhibited between
  and the sum of the resonance terms from E1, and E2. Comparing figures 4(l1) and (l2) to figures 4(k1) and (k2),
  (figure 4(l1)) is completely suppressed by the non-resonance term due to the significant contribution of
  in figure 4(l2) from R1 > 0. The difference between
  and
and  in figure 4(j) is enhanced compared to figure 2(j) due to a decrease in
  while
while  in figure 4(l) remains almost the same as figure 2(l). Furthermore, phase transition phonon detuning will be gradually increased from figures 2–4. The difference between
  and
and  in figure 4(b) becomes very larger than that of
  and
and  (figure 4(d)) i.e.,
  . Due to a decrease in N1, the difference between R1 + N1 and N1 in figure 4(i) is enhanced compared to figure 2(i). Owing to R2 ≅ N2 ≅ 0 in figure 4(k), the R2 and N2 suggest reduction of about 7-times and 4-times, respectively, as compared to figure 2(k). From the above discussion, it is exhibited that temporal intensity profile interaction efficiently reduces with enhancement in the phase transition phonon dressing.
Further, we show that more phase transition phonon dressing reduces TAT splitting for one laser (figures 4(i) and (k) and two laser TAT splitting interactions (figures 4(j) and (l). The largest ωpj value influences an increase in tpS which strongly affects the TAT splitting of narrowband excitation in figure 4(k). Since narrowband excitation does not support Δpj , therefore, τ02 approaches zero in figure 4(k). τ(2) in figures 4(j) and (l) is equal to τ01 in figure 4(i). The difference between of τ(2) in figures 4(j) and (l) and the sum of two single laser TAT splitting (figures 4(i) and (k) is also almost equal to zero. Therefore, TAT-splitting interaction (τinter) decreases in figures 4(j) and (l) for the pure HP as compared to that of half HP + half LTMP in figures 2(j) and (l)).
The interaction results in figures 2–4 were based on thermal phonon dressing at 300 K. In the following, we decrease the temperature to 77 K in order to study the interaction without thermal phonon dressing in three phase transitions.
4.2. Interaction without thermal phonon dressing for three phase transitions
In figure 5, the intensity of spectral-temporal profile for one laser excitation and its interaction for two lasers excitations is dramatically reduced by small thermal phonon dressing. The Rabi frequencies of the thermal phonon dressing is determined by the temperature (thermal phonon number). On the other hand, two laser spectral-temporal profile interaction (figure 5) from the hybrid signal decreases when the temperature is reduced to 77 K (less phonon number) leading to a small Rabi frequency (GpT ≅ 0) in contrast to 300 K (figure 2).
At 77 K, the broadband excitation (figure 5(a)) is surprisingly similar to narrowband excitation (figure 5(c)). Because the photon-thermal phonon coupling disappears and only  dressing is left in figure 5(a) as compared to figure 2(a). Due to GpT
≅ 0 at 77 K, the dressing dips (number) from one laser (figures 5(a), (c) (e) and (g)), and its intensity interaction
dressing is left in figure 5(a) as compared to figure 2(a). Due to GpT
≅ 0 at 77 K, the dressing dips (number) from one laser (figures 5(a), (c) (e) and (g)), and its intensity interaction  of the two lasers profile (figures 5(b), (d), (f) and (h)) disappear as compared to figures 2(a)–(d) and (e)–(h).
Next, we show that temporal intensity profile interaction (figures 5(i)–(l)) is decreased due to less thermal phonon dressing. The difference between  (figure 5(j1)) and
  (figure 5(j2)) decreases 3-times compared to (figure 2(j1)) and (figure 2(j2)), respectively. The difference between
  (figure 5(l1)) and
  (figure 5(l2)) decreases about 2-times as compared to figure 2(l). Comparing
  (figure 5(j1)) and
  (figure 5(j2)) to the R1 + N1 (figure 5(i1)) and N1 (figure 5(i2)),
  decreases by 2-times i.e., while
  enhances by 1.3-times i.e.,
  . Furthermore, phonon dressing becomes very small as GpT
≅ 0 (equation (5)) at 77 K and reduces the intensity of temporal profile interaction resonance and non-resonance curves. A decrease in the thermal phonon dressing results in a decrease in
. Furthermore, phonon dressing becomes very small as GpT
≅ 0 (equation (5)) at 77 K and reduces the intensity of temporal profile interaction resonance and non-resonance curves. A decrease in the thermal phonon dressing results in a decrease in  figure 5(j2) which induces an enhancement in the difference between
  and
and  (figure 5) as compared to figure 2. The difference between
  (figure 5(j1)) and
  (figure 5(j2)) is about 2-times more than the difference between
  (figure 5(l1)) and
  (figure 5(l2)) i.e.,
  . Both the resonance term (figure 5(i1)), and the non-resonance term (figure 5(i2)) of broadband excitation reduced 2-times compared to that of figures 2(i1) and (i2). The temporal profile resonance term in figure 5(k1) dramatically reduced as compared to figure 2(k1).
Further, we exhibit that thermal phonon strongly affect the TAT splitting interaction. The τ(2) in figures 5(j) and (l) disappears at low-temperature as τ02 ≅ 0. However, due to no contribution from thermal phonon at 77 K, τinter reduces about 2-times in figures 5(j) and (l) compared to figures 2(j) and (l).
In figure 6, the phase transition phonon dressing increases due to a change in the crystal structure while keeping the thermal phonon dressing the same as in figure 5. A large value of phonon frequency (ωpj
) i.e., Δpj
(near-resonance) in figure 6 exhibits a minor change in the spectral-temporal profile as compared to figure 5. The spectral signals dip (TAT splitting) from one laser in figures 6(a) and (c), and its intensity interaction  of two lasers in figures 6(b) and (d) condense more due to a decrease in ΔpS
, as compared to figure 5.
of two lasers in figures 6(b) and (d) condense more due to a decrease in ΔpS
, as compared to figure 5.
Next, the destructive temporal interaction reduces more (figures 6(j) and (l)) due to an increase in the phase transition phonon dressing, and can be explained the same as figures 3(j) and (l). We realize that  while
while  (figure 6(l2)) increases 3-times compared to
  (figure 6(j2)) i.e.
  and can be explained the same as figures 5(j2) and (l2). In figure 7, the destructive spectral and temporal interaction is controlled by thermal phonon Rabi frequency and phase transition phonon detuning. In figure 7, the temperature is reduced to 77 K when compared to figure 4 (300 K). Here the sample changed to pure HP. It should be noted that pure HP have high site symmetry than half HP + half LTMP (figure 5). Since, dressing dip number (figures 7(a) and (e)) through single laser should increase due to largest ωpj
i.e., Δpj
≅ 0, as compared to figures 2(a), (e) and (i). However, a decrease in thermal phonon GpT
, destroys the dressing dips in figures 7(a) and (e). In this situation, the phonon dressing (figure 7) has a small GpT
, and largest ωpj
(ΔpS
≅ 0).
and can be explained the same as figures 5(j2) and (l2). In figure 7, the destructive spectral and temporal interaction is controlled by thermal phonon Rabi frequency and phase transition phonon detuning. In figure 7, the temperature is reduced to 77 K when compared to figure 4 (300 K). Here the sample changed to pure HP. It should be noted that pure HP have high site symmetry than half HP + half LTMP (figure 5). Since, dressing dip number (figures 7(a) and (e)) through single laser should increase due to largest ωpj
i.e., Δpj
≅ 0, as compared to figures 2(a), (e) and (i). However, a decrease in thermal phonon GpT
, destroys the dressing dips in figures 7(a) and (e). In this situation, the phonon dressing (figure 7) has a small GpT
, and largest ωpj
(ΔpS
≅ 0).
Next, we discuss the comparison of spectral and temporal profile interaction at different phonon detuning and temperatures. The two lasers dressing dips intensity interaction is maximum in figures 2(b), (d), (f) and (h) while completely destroying in figures 7(b), (d), (f) and (h). As compared to figures 2(b), (d), (j) and (l) with strong spectral-temporal profile interaction having smaller ΔpS
≅ 0 and larger GpT
, here the spectral-temporal interaction (figures 7(b), (d), (j) and (l)) is completely destroyed by larger ΔpS
> 0 and smaller GpT
. For the pure hexagonal phase of Eu3+: BiPO4, the thermal and phase transition phonon destructive dressing  vanishes the spectral-temporal profile interaction at both 300 K and 77 K.
Further, we compare TAT splitting at different phonon detuning and temperatures. Since tpT dominates over tpS , thus ΔpS ≅ 0 does not bring change in the TAT splitting in figures 7(i) and (k). The TAT splitting in figure 7(i) reduces about 2-time while completely destroying in figure 7(k) as compared to figures 2(i) and (k). Compared to figures 2(i)–(l) with strong TAT splitting interaction owing to larger tpT and smaller tpS , the TAT splitting and its interaction (τinter) destroys in figures 7(i)–(l) for the pure HP due to a decrease in tpT .
Based on the above discussions we realized that spectral-temporal intensity profile interaction is depending upon temperature phonon and phase transition phonon. Such interaction is strongest at 300 K and less phase transition phonon dressing, while weakest at 77 K and more phase transition phonon dressing.
4.3. Additional two phase transition phonon dressing comparison
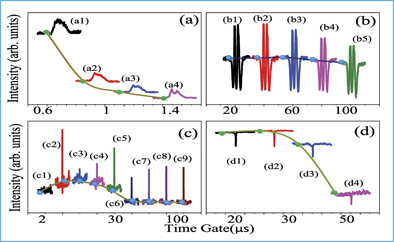
Finally, two phase transitions (figure 8) are compared to three phase transitions (figures 2–7) in hybrid signals with photon and phonon dressing. Different phases of a crystal have different lattice vibrational frequencies. A small value of the lattice vibrational frequencies (ωpj ) i.e., Δp2S ≫ 0 (far off-resonance) reduces the phonon dressing than that of figures 2–7. However, the thermal phonon dressing in figures 8(a)–(d) can be explained the same as figures 2–4 and 5–7 respectively.
Figure 8. Shows the spectral intensity of the hybrid signals obtained from the pure LTMP (7:1 phase) and less HP + more LTMP (20:1 phase) of Eu3+: BiPO4. (a) and (c) Show the spectral intensity of output signals from a pure LTMP when E1 (4 mW) scanned from 572.4 nm to 612.4 nm with time-gate width 400 ns at 300 K, 77 K, respectively. (b) and (d) Show the spectral intensity of output signal from HP and LTMP of Eu3+: BiPO4 when E1 (7 mW) scanned from 572.4 nm to 612.4 nm with gate width 500 ns at 300 K, 77 K, respectively. All the values are taken at different time-gate positions.
Download figure:
Standard image High-resolution image
Figure 8(a) shows the FL supremacy at the near time-gate position in the hybrid signal and results in a broad peak. The multi-peaks with three dressing dips in figure 8(b) are exhibited due to  form equation (1), and can be explained the same as figure 4(a). In figure 8(b), the left dressing dip is produced by
  , which is further added with two phonon dressing terms on its right produced through
  . At 77 K, the pure LTMP exhibits a sharp peak with a slight change in the background in figure 8(c). Compared to figure 8(a), the linewidth of the spectrum becomes sharper shown in figure 8(c) due to a decrease in the FL at 77 K. A single dressing dip in figure 8(d) is exhibited by photon dressing
  . Compared to figure 8(b), the dressing dips reduce in figure 8(d) due to
  nested dressing with Gp1T
≅ 0. Moreover, the strong dressing effect in figures 8(b) and (d) is exhibited due to the high power (7 mW) of the laser as compared to figure 4 and 7 (4 mW).
nested dressing with Gp1T
≅ 0. Moreover, the strong dressing effect in figures 8(b) and (d) is exhibited due to the high power (7 mW) of the laser as compared to figure 4 and 7 (4 mW).
5. Conclusions
In summary, the spectral-temporal intensity of the hybrid signals in five phases of Eu3+: BiPO4 are strongly affected by thermal phonon Rabi frequencies and phase transition phonon detuning's. We suggest, the dressing from thermal phonon and phase transition phonon are significantly affected the temporal profile interaction of resonance and non-resonance terms. In the temporal profile intensity interaction, the resonance signal is suppressed by two laser destructive dressing interactions versus broadband excitation detuning. Furthermore, the pure HP shows weak resonance and non-resonance compared to the half HP + half LTMP and more HP + less LTMP samples through narrowband excitation. The resonance and background signals are totally vanished by the phase transition phonon dressing at both high and low temperatures. Lastly, phase transition phonon dressing increases the Fano (dressing)- dip numbers for one laser broadband excitation.
Acknowledgments
This work was supported by the National Key Research and Development Program of China (2017YFA0303700, 2018YFA0307500), Key Scientific and Technological Innovation Team of Shaanxi Province (2021TD-56), National Natural Science Foundation of China (61975159, 11904279, 12174302, 62022066, 12074306, 12074303).
Data availability statement
The data that support the findings of this study are available upon reasonable request from the authors.
Conflict of interest
The authors declare no competing financial interest