


Abstract
Pump-probe photoelectron spectroscopy (PES) is a versatile tool to investigate the dynamics of transient states of excited matter. Vacuum space-charge effects can mask these dynamics and complicate the interpretation of electron spectra. Here we report on space-charge effects in Au 4f photoemission from a polycrystalline gold surface, excited with moderately intense 90 ps (FWHM) soft x-ray probe pulses, under the influence of the Coulomb forces exerted by a pump electron cloud, which was produced by intense 40 fs laser pulses. The experimentally observed kinetic energy shift and spectral broadening of the Au 4f lines, measured with highly-efficient time-of-flight spectroscopy, are in good agreement with simulations utilizing a mean-field model of the electrostatic pump electron potential. This confirms that the line broadening is predominantly caused by variations in the take-off time of the probe electrons without appreciable influence of local scattering events. Our findings might be of general interest for pump-probe PES with picosecond-pulse-length sources.
Export citation and abstract BibTeX RIS

Original content from this work may be used under the terms of the Creative Commons Attribution 3.0 licence. Any further distribution of this work must maintain attribution to the author(s) and the title of the work, journal citation and DOI.
1. Introduction
Since its discovery by Kai Siegbahn and coworkers in the 1960s, photoelectron spectroscopy (PES) has become an increasingly important tool to investigate the quantum state of matter. Originally focused on studying the composition and chemical state of molecules by probing the local site-specific electron density with x-ray core-level excitation and analysis of binding energy shifts [1]—often called electron spectroscopy for chemical analysis-, PES is nowadays widely used to tackle focal topics in material and surface sciences, e.g. to study multi-elemental compounds as metal oxides, metal dichalcogenides and cuprates with exceptional electronic and magnetic phases like superconductivity, charge density waves, ferromagnetism and low-dimensional electron gases or to study catalytic reactions of adsorbates. Angle resolved photoelectron spectroscopy (ARPES) is one of the most important techniques to investigate the electronic valence structure of solids by measuring electron binding energy, momentum and possibly spin (spin-ARPES) [2, 3]. Photoelectron diffraction [4] and photoelectron holography [5, 6] can give complementary information of the geometric structure on bulk materials and surfaces as well as on the coordination of adsorbates. The short escape depth of electrons (in the order of 10 Å in the soft x-ray excitation regime) makes electron spectroscopy rather surface sensitive. Hard x-ray excitation for electron spectroscopy (HAXPES) can increase the information depth and enable depth profiling with energy tunable sources. The wide tunability of monochromatized light paired with high photon flux and brilliance makes synchrotron radiation from storage rings the ideal source for many electron spectroscopy applications leading to a quasi standard setup in combination with the hemispherical analyzer [7].
Modern high brilliance x-ray sources as synchrotrons, free electron lasers (FEL) or laser-based high-harmonic generation (HHG) and plasma sources deliver short x-ray pulses, with a length ranging from femtoseconds to picoseconds, and a small spot size in the μm regime. This can lead to a high peak charge density with multiple photoelectrons being emitted within one pulse, which will interact via Coulomb repulsion in vacuum and hence change their initial energy and momentum in an uncontrolled fashion. The strength of such so called space-charge (SC)-effects increases mainly with the volume charge density ρe− and decreases with the initial kinetic energy of the electrons, because of reduced interaction time. One of the first observations of SC-effects of electrons emitted from a metal surface was reported by Boersch [8]. A cathode was used to produce an electron current for electron microscopy and the Coulomb interaction of slow free electrons on the metal surface of the cathode was observed to broaden the electron velocity distribution, thus degrading the energy and spatial resolution of the microscope. Zhou et al have shown that energy shifts and broadenings of electron spectra in the order of 10 meV can already occur at x-ray pulse intensities typical of third generation synchrotrons [9]. Considering the nowadays achievable energy resolution at synchrotron facilities using state-of-the-art electron spectrometers (ΔE ≈ 1 meV), it is clear that SC-effects can become the bottleneck for photoemission experiments. Dramatic SC-effects with energy shifts and broadenings of several eV can occur at FELs with very high photon intensities and reported electron numbers of many thousands per pulse ([10–12]) or in high-intensity HHG sources [13]. Several analytic [14] and numerical models, e.g. simulations of the electron cloud expansion with ASTRA [10], tree-code [15] or SIMION [16], have been used to quantify SC-effects for different initial electron distributions.
The so far mentioned SC-effects are produced by interaction of the analyzed electrons (i.e. probe electrons) among themselves and they can mostly be reduced to a tolerable level by simply reducing the photon flux. The loss of signal intensity might be compensated by increasing the repetition rate of the source or by using electron spectrometers with high transmission or high emission angle acceptance (e.g. ARTOF [17], momentum microscope[18], magnetic bottle [19], retarding Bessel-Box [20]). In pump-probe experiments, the pump pulse can be an additional source for SC-effects. Depending on the pump pulse intensity, wavelength and polarization, a high number of conduction electrons might be emitted into the vacuum and produce a pump electron cloud in front of the sample surface. In that case, the dynamics of the transient under investigation, encoded in the probe electron spectra, can be masked by SC-effects from Coulomb interaction of the pump electron cloud with probe electrons over a wide range of several hundred picoseconds before and after the creation of the pump electron cloud. Avoiding SC-effects in pump-probe experiments can be difficult since a reduction of the pump pulse intensity is only possible as long as the investigated effect can still be excited. Moreover, a high repetition rate only helps in case relaxation of the transient dynamics and dissipation of thermal heat are complete within the time span separating two consecutive pump pulses. Hence, it is important to characterize space-charge dynamics in detail in order to be able to account for them in pump-probe data analysis.
In this work, we investigate space-charge effects in Au 4f pump-probe x-ray photoemission spectroscopy, using 40 fs (FWHM) pulses from a 800 nm Ti:Sapphire laser as a pump and 90 ps (FWHM) soft x-ray synchrotron pulses as a probe. The laser pulses produce an intense nonlinear photoemission current on a polycristalline gold surface leading to electron clouds of about 105 electrons per pulse. In contrast, the photoemission current produced from the probe pulse consists of only few electrons per pulse, therefore avoiding any significant SC-effects between the probe electrons. With Monte-Carlo simulations we find that the detailed dynamics of the Au 4f XPS spectra can be explained by describing the SC-effects with an analytic mean-field model of the pump electron cloud. While this model is well known and has been successfully used to describe the space-charge induced energy shift in several pump-probe XPS studies [12, 21], our high resolution Au 4f spectra enable to test its applicability on the detailed line shape, in particular line broadening and asymmetry. We find that all observations can be understood within the mean-field model without the need to account for local electron–electron collision processes -also called stochastic scattering-. Our space-charge dynamic simulations for different x-ray pulse lengths and probe electron energies reveal distinct spectral broadening due to different take-off times of the probe electrons, which becomes in particular important for probe pulses longer than about 10 ps.
2. Experimental setup
All measurements are performed at the UE56/1-PGM beamline at the BESSY II synchrotron. The endstation is equipped with the angle-resolving time-of-flight electron spectrometer ARTOF [22, 17] (by Scienta Omicron GmbH), which was recently upgraded with a wide angle lens to enable up to 60◦ full-cone acceptance [23]. Here, we operate the ARTOF at an angular acceptance of 56◦ (full cone) and with an analyzable energy window size of 4% of the chosen center energy, providing high transmission at a nominal resolving power of 2200 and 1500 at  and Ecen = 360 eV, respectively. The p-polarized x-ray probe beam, which hits the sample under 50◦ with respect to the surface normal, and the analyzer optical axis lie in a horizontal plane. The sample is oriented vertically and photoelectrons are detected in normal emission geometry. The pump pulses are generated by the 800 nm Ti:Sapphire laser of the FemtoSpex facility [24] and the laser beam is nearly parallel to the x-ray beam (with an angle of 2◦). We establish the spatial x-ray/laser overlap on a YAG crystal and measure a x-ray spot size of 40 × 130 μm2 and a laser spot size of 400 × 900 μm2 (vertical × horizontal). Temporal overlap is roughly established with a GaAs avalanche photodiode (APD) by tuning the pump-probe delay with an optical delay stage, which ranges between ±1.5 ns around time zero. The synchrotron is operated in single bunch mode, which provides a single x-ray pulse with ≈90 ps (FWHM) pulse length at 1.25 MHz repetition rate, hence at a time interval of 800 ns. The pump-laser, with a repetition rate of 6034 Hz, is synchronized to one of the 207 synchrotron pulses that fit within one laser period. Since the dynamics of the Au 4f spectra are expected to occur on a sub-nanosecond timescale and the ARTOF stores the arrival time for all individual electron events, one can use all synchrotron pulses except the one which coincides with the laser to obtain an 'unpumped' reference spectrum during a pump-probe measurement. Here, we accumulate the spectra of ten revolutions to obtain better statistics in the reference spectrum compared to the pumped spectrum. All measurements are performed at room temperature at a base pressure of 2 · 10−10 mbar.
3. Simulations of space-charge dynamics with a mean-field model
In the most general case, simulations of SC-effects in pump-probe photoemission must temporally evolve the ensemble of pump and probe electrons, i.e. by solving the equations of motion for every electron in the electric field of all other electrons, from the time of emission of the first electron until the time where the distance of every probe electron to all other electrons is big enough that no significant change in kinetic energy and momentum of the probe electrons will occur anymore. The complexity of this problem can be reduced in particular experimental conditions: If the probe electron density ρprobe is sufficiently low, the interaction eprobe − eprobe can be neglected. If, furthermore, the number of pump electrons is large compared to the number of probe electrons (e.g. 105 : 1), the pump electron cloud might be considered as a macroscopic system acting on the probe electrons ('test electrons'), without being strongly affected by them (simulations e.g. in [15]). A further simplification is possible when the probe electrons are much faster than the majority of pump electrons and the temporal width of the pump electron cloud is short enough that the cloud can be treated as a thin disc parallel to the sample surface at time zero. These conditions apply to the parameters in our experiment and enable the introduction of an analytic space charge potential [14, 12, 20].
Photoelectrons created in a nonlinear photoemission process from a sub-ps laser pulse on a metal surface have typically kinetic energies below 10 eV directly after the emission process [25]. In this non-relativistic case, the length of the electron cloud along the surface normal direction z is approximately 0.1 μm according to equation (1).

This length is much shorter than the laser spot diameter of typically few 100 μm. Therefore, one can consider the pump electron cloud as a flat disc for which a one dimensional electrostatic potential in the z direction can be derived (see equation (2)) [14]:

In equation (2), N is the total number of electrons in the disc, e is the elementary charge, ε0 is the vacuum permittivity, r is the radius of the laser spot and z is the distance from the disc center in the longitudinal direction.
Photoelectrons created by x-ray excitation (probe electrons) will be accelerated in the pump electron disc potential. For the simplest case that probe electrons are only detected in the z direction (e.g. electron detector in normal emission geometry), the shift in kinetic energy is directly given by V and depends only on the time difference between the creation of the pump electron disc and the emission of the probe electron, which is illustrated in figure 1. For negative delays, the probe electron leaves the sample with an initial velocity vXz prior to the emission of the pump electron disc. As soon as the pump electron disc is emitted at t = tdel, the probe electron is accelerated and the total increase in its kinetic energy equals V(zdel) · e, with zdel being the position of the probe electron at t = tdel (see figure 1(a)).

Figure 1. Pump-probe space-charge effects in a one-dimensional analytic model of the pump electron cloud. (a) and (b) Spatial profiles of the electrostatic potential (red curves) of the pump electron disc for negative (left) and positive (right) delays. Red and blue bars mark the spatial positions of the pump electrons and probe electron(s) respectively at the same  . The total increase of kinetic energy of a probe electron is depicted with black arrows. (c) Electrostatic potential versus time difference between the pump pulse and the probe electrons. For a given delay tdel, the temporal width ΔtX of the Gaussian probe pulse (blue) introduces an approximately Gaussian distribution of the energy shifts of the probe electrons (light blue) centered around Eshift with a width ΔEbroad. (d) Exemplary space-charge effect on a PES line within the analytic model. Besides the energy shift and energy broadening, an asymmetry characterized by a tail at higher kinetic energies occurs due to the positive second derivative of VL. The black line marks the Gaussian envelope in case of symmetric broadening.
Download figure:
Standard image High-resolution imageFor positive delays, the pump electron disc is created first and the probe electron then travels through the disc. In this situation, the probe electron is interacting with the pump electron disc during the initial propagation process and effects like increasing disc size, redistribution of the kinetic energies of pump electrons or collisions of the probe electron with pump electrons might become more important. The authors of [12] and [21] have shown that it is nevertheless adequate to approximate the propagation of the pump electron disc with an effective cloud electron velocity vLz (see figure 1(b)). Some extensions to the 1D model have been developed:
(1) including a lateral expansion r(t) of the disc in a 2D model [26];
(2) including a realistic energy distribution of the cloud electrons N(Ekin) and building partial sums of electron discs with energies according to this distribution [21];
(3) different distributions of emission angles (normal, isotropic, cosine) and an elliptical spot shape for cloud electrons [21, 27].
These extensions describe the dynamics of the space-charge induced energy shift with better accuracy. It should be emphasized that, to our knowledge, the dynamics of spectral broadening (energy broadening) in pump-probe photoemission could not yet be explained quantitatively with the analytic space charge model. The reason is that the energy shift at a certain pump-probe delay for a fixed electron take-off time is the same for all probe electrons and hence shifts the spectrum as a whole. Slightly varying energy shifts due to different kinetic energies of the probe electrons should cause a negligible spectral broadening in XPS. Instead, experimentally observed spectral broadening is sometimes attributed to random local collisions between electrons as is discussed for electron beams e.g. in [8, 28].
However, in specific experimental configurations, where the probe pulse length is of the same order as the timescale in which the space-charge dynamics occur, spectral broadening can be explained within a mean-field model, as illustrated in figure 1(c). Considering a particular delay tdel, the probe electrons are temporally distributed, due to the width ΔtX of the x-ray pulse, and might thus experience different energy shifts depending on their position at the pump electron cloud creation time. To a first approximation, the energy distribution width is simply  , which causes symmetric energy broadening of a PES line (see figure 1(d)). One might imagine the probe electron cloud moving in the homogeneous field of a condenser that is switched on at t = tdel.
Since the second derivative of the pump electron cloud potential is positive for all tdel ( ), the electron spectrum is expected to have an asymmetric tail at higher kinetic energy. However, for
  , the probe electron distribution overlaps with the pump electron cloud during its creation, and probe electrons start partly before and partly after the laser electron disc. In that case, the simple analytic arguments for the broadening and the asymmetric tail do not hold.
To investigate spectral broadening within the framework of a 1D model, we have developed a Monte-Carlo simulation which can simulate core level electron spectra under the influence of a space charge potential VL (as in equation (2)). An ensemble of probe electrons characterized by three parameters is generated initially. One parameter (PΓ) is taken from a Lorentz distribution with a width equal to the natural linewidth of the core level. The second parameter (Pres) is taken from a Gaussian distribution with a width that is equal to the experimental broadening and, thirdly, PΔtX is taken from a Gaussian distribution with a width equal to the probe pulse duration, which is used to generate the start time of the electrons tstart = tdel + PΔtX. In the next step, the final kinetic energy for each electron from the ensemble is calculated with equation (3). Finally, the electrons are binned in kinetic energy.

This electron spectrum simulation is rather time efficient and can be used as a fit function. For typical test electron numbers between 105 and 106, the execution time of the simulation scales almost linearly with the electron number and is about 1 μs/e− on a desktop computer. This enables to do a global fit to a data set comprising photoemission spectra at several delays to achieve a set of optimal parameters for VL(z). Before testing the applicability of the model to the experimental data, the effect of varying some crucial parameters on the dynamics of energy shift and spectral broadening will be shown.
Figure 2 shows simulated dynamics of a Gaussian XPS line in the 1D space charge model for various parameter settings. The line width Γ and peak position Epeak are analyzed by using fits and by calculating statistical momenta of the spectra.

Figure 2. Simulated space-charge dynamics of a Gaussian XPS line. (a) Delay traces for a 70 ps x-ray pulse (light blue) and an initial electron kinetic energy EX = 100 eV (other model parameters are mentioned in the text). The dynamics of the line width as derived from Gaussian fits to the simulated electron spectra (red) can be compared with the standard deviation of the spectra (blue). The dashed lines show the corresponding SC-induced spectral broadening. The peak position shifts derived from the fits (grey) are almost identical with the statistical mean value (not shown). (b) Gaussian fits (blue) to the simulated electron spectra (red) for different delays. The biggest deviation can be found for tdel = − 50 ps. The χ2 of the fits versus tdel is depicted on top of (a). (c), (d) delay traces of SC-induced spectral broadening and energy shift (from fits to simulated spectra) for various x-ray pulse lengths (c) and various kinetic energies of the probe electrons (d).
Download figure:
Standard image High-resolution imageIt should be noted that a Gaussian line shape is used in the initial tests of the model for simplicity and straightforward comparability between fits and statistical momenta, i.e. statistical mean value and standard deviation σ correspond to the fitted peak position and  respectively. In contrast, all experimental data will be fitted with Voigt profiles.
The pump electron cloud is created at t = 0 ps and the probe electron spectra are simulated for delays between −200 and +200 ps in 2 ps steps. In figure 2(a), delay traces are simulated with Nel = 105 pump electrons, a laser spot radius r = 300 μm and a mean pump electron energy EL = 30 eV. The probe electron energy is EX = 100 eV, the line width is ΔEgauss = 0. 3 eV (FWHM) and the probe pulse width is ΔtX = 70 ps (FWHM). While the energy shift of the PES line ΔEshift = Epeak − EX is almost the same for the fit and the statistical analysis method for every delay, the line widths obtained from the two methods differ slightly for −120 ps < tdel < 120 ps. Simulated PES spectra and Gaussian fits are shown for selected delays in figure 2(b). One can clearly observe an asymmetry in the PES lines for tdel = −50, 0 and 50 ps. The agreement of the fits to the spectra can be gauged from the χ2-plot in figure 2(a) top. The highest χ2, as well as the biggest disagreement between the fit width and the standard deviation, is found at tdel ≈ −50 ps. This can be explained with the high second derivative of the pump electron cloud potential VL(z), which causes the electrons from the probe pulse to be shifted very asymmetrically in energy. To extract the SC-induced spectral broadening ΔEbroad from the total line width Γ, the Gaussian line width ΔEgauss is subtracted quadratically:  .
.
—It should be emphasized that ΔEbroad could in principle be calculated from simulations with zero initial PES line width (ΔEgauss = 0). However, in this case the simulated spectrum can sometimes not be well fitted with a Gaussian, particularly for tdel ≈ 0, due to the discontinuity of VL(t) at t = 0. Hence a small ΔEgauss is introduced to achieve proper fit results. Increasing ΔEgauss generally improves the fit quality, but the extraction of ΔEbroad can be more difficult. Nevertheless, it has been tested that the delay traces are only weakly effected by varying ΔEgauss.
In the following, the influence of the probe pulse length on the dynamics of the probe electron spectra will be shown. In figure 2(c), delay traces of ΔEshift and ΔEbroad, determined from fits, are simulated for some characteristic ΔtX. All parameters except ΔtX and ΔEgauss are kept the same as in figure 2(a).
For short probe pulse length, i.e. ΔtX = 1 ps, the energy shift trace is steep and is supposed to resemble the pump electron cloud potential. The longer the probe pulses are, the smaller the energy shift maximum becomes, which might be interpreted by a temporal convolution of the pump electron cloud potential with the probe pulse. The trend is very different for the spectral broadening. For ΔtX = 1 ps, there is no spectral broadening visible within the statistical accuracy. For longer pulses, a characteristic shape with two distinct maxima appears, which gets smeared out for the longest pulses of ΔtX = 300 ps.
Let us now associate the pulse length with realistic x-ray sources. The situation of very short pulses of 1 ps or even below is typically realized at FELs. An energy shift of the photoemission signal with a sharp maximum at a time delay between the pump and probe pulses of tdel = 0 was observed in e.g. [11, 12]. However, the authors of this work have not reported on pump pulse induced spectral broadening quantitatively. This is also not expected from our simulations and would be beyond take-off time variations of the probe electrons in a mean-field model. A pulse length of 10 ps is for instance established in the low-α mode at a synchrotron. Here, one would expect a spectral broadening much smaller than the energy shift within the mean-field model which might, however, only be detected if the instrumental resolving power is rather good and the intrinsic lifetime broadening is not too big. A pulse length of 70 ps is usually available at a third generation synchrotron in normal operation mode. Here, the spectral broadening caused by the electron take-off time distribution is of the same order as the energy shift and should become relevant for pump-probe XPS. In the rather extreme case of ΔtX = 300 ps, which is aimed for at some fourth generation high brilliance sources as MAX IV, energy shift and broadening persist over more than 200 ps and the broadening can even surpass the shift. Although these storage rings are naturally not oriented towards pump-probe studies, due to the long pulses, one should expect significant probe pulse-length induced spectral broadening.
Another interesting parameter is the probe electron energy EX. Figure 2(d) shows simulations of delay traces for different EX in the soft x-ray regime, all measurable with an ARTOF. The higher the probe electron energy is, the steeper VL(tdel) becomes for negative delays, which raises the amplitude of the first energy broadening maximum and shifts its position towards tdel = 0. The maximum of the energy shift is shifted from tdel = 0 to higher positive delays and the amplitude decreases with higher probe electron energies. At  , the broadening maximum and the shift maximum are clearly separated and it might be difficult to resolve the second broadening maximum at all. In the case EX = EL, the delay traces of the energy shift and of the spectral broadening become symmetric with respect to tdel. Here one might raise the question whether the 1D model is still valid, because identical probe and pump electron velocities would contradict the 1D-model assumption that probe electrons are much faster than pump electrons. However, as will be discussed later in detail, the parameter EL shall be interpreted as an effective pump electron energy (
 ), which—though based on the mean kinetic energy of the pump electron cloud—also implicitly accounts for a dynamic expansion of the cloud and is therefore expected to be higher than the mean kinetic energy of the pump electrons.
4. Experimental results and discussion
In the following, the dynamics of Au 4f core electrons emitted from a polycristalline gold sample under the influence of a laser-induced pump electron cloud is experimentally investigated. Au 4f XPS spectra are recorded for Eph = 260 eV and 450 eV at a flux of about 109 ph s–1. The laser fluences are 1.3 ± 0.1 mJ cm−2 for Eph = 260 eV and 1.5 ± 0.1 mJ cm−2 for Eph = 450 eV. The measured laser-induced total photoemission currents—here called sample current—are Isamp = 330 ± 15 pA and Isamp = 450 ± 15 pA, corresponding to (3.4 ± 0.2) · 105 and (4.6 ± 0.2) · 105 emitted electrons per pulse respectively. Although the sample surface is not perfectly homogeneous and the pump electron yield at fixed laser fluence varies along the surface by up to 30%, the sample proved to be robust against laser irradiation and no additional preparation was necessary.
Figure 3(a) shows reference spectra (laser switched off) with high statistics recorded at the synchrotron repetition rate (1.25 MHz). The electron spectrometer alignment was optimized for the Au 4f5/2 PES line. The Au 4f7/2 peak is effected by minor optical aberration of the analyzer at Eph = 260 eV, leading to an increased line width in the angle-integrated spectrum. The applied fit model consists of two Voigt profiles with constant Lorentzian width of 0.33 eV (in good accordance with literature [29]), a Shirley-type background and a constant background. The intensity ratio between the two peaks is fixed according to the multiplicity of the spin orbit splitting I(Au4f5/2)/I(Au4f7/2) = 3/4. The fit results are in good agreement with the data. We do not observe a significant contribution of a surface state, as reported in [29], presumably because no extensive surface preparation has been done.

Figure 3. (a) Au 4f photoemission spectra recorded with high statistics and the pump laser switched off. Experimental data are marked with red dots, the blue lines are fits to the data. (b)–(d) Au 4f spectra recorded for pump-probe delays in 4 ps steps around time zero. The Au 4f5/2 peak positions, as derived from fits, are marked for the pumped spectra (solid lines) and the corresponding reference spectra (dashed lines), respectively. b scan from –150 to 150 ps at Eph = 260 eV. (c) scan from −150 to 150 ps at Eph = 450 eV. (d) scan from 152 to −148 ps at Eph = 260 eV.
Download figure:
Standard image High-resolution imageAll pumped Au 4f spectra (recorded at the laser repetition rate of 6 kHz) can be seen in a two-dimensional intensity plot in figure 3. The spectra have been measured for delays between −150 and 150 ps in 4 ps steps (values read from the delay stage) for Eph = 260 and Eph = 450 eV. An additional delay scan has been measured from 152 to −148 ps for Eph = 260 eV as a further verification. Figure 4 shows delay traces of the Gaussian line width of both Au 4f5/2 and 4f7/2 peaks and of the 4f5/2 peak position for the pumped spectra and for the sum of ten unpumped spectra between the laser revolutions. The peak positions and widths are obtained from fits to the electron spectra by keeping the spin–orbit splitting and the background parameters fixed to the results from the corresponding reference spectra (figure 3(a)) and only varying the 4f5/2 peak position, the Gaussian line width contribution of both peaks and the intensity of the 4f5/2 peak. As expected, the unpumped traces show only very weak delay dependency, in the order of few meV, which we attribute to slightly changing x-ray beam or sample position during a delay scan.

Figure 4. (a)–(c) delay traces of Au 4f XPS line width and peak position derived from fits to the data sets of figure 3. All panels display the Au 4f5/2 peak position for pumped spectra (black line) and unpumped reference spectra (grey). The Gaussian line width of the Au 4f5/2 (red) and Au 4f7/2 (blue) peaks are shown for pumped spectra (dark colors) and unpumped reference spectra (light colors). (d) Delay traces of energy shift and spectral broadening. The spectral broadening (purple) is an average of the Au 4f5/2 and Au 4f7/2 broadenings. Both scans at Eph = 260 eV are combined and the traces are carefully smoothed for better visualization. Error bars are shown for Eph = 260 eV and taken from the standard deviations of the fits. Two maxima at tdel ≈ −50 ps and tdel ≈ 20 ps are clearly visible in the energy broadening trace for Eph = 260 eV.
Download figure:
Standard image High-resolution imageFigure 4(d) shows normalized delay traces for all photon energies. The SC-induced energy shift ΔEshift is achieved by subtracting the delay trace of the unpumped spectrum from the delay trace of the pumped spectrum (ΔEshift = Epump − Eunpump), while the SC-induced spectral broadening is achieved by subtracting the unpumped line width from the pumped line width quadratically ( ). The two traces recorded at Eph = 260 eV are very similar, confirming the reproducibility of the measurements, and have been merged together and smoothed for better visualization. ΔEshift has a rather broad maximum at about −10 ps and ΔEbroad shows a remarkable asymmetry with a maximum at −50 ps, a steep edge to smaller delay, and at larger delays a lower maximum at about 20 ps. The delay traces at Eph = 450 eV look overall similar, with the exception that the broadening trace appears more symmetric and the maximum of the energy shift trace is shifted a few picoseconds to more positive delay, which could be explained by slightly changed synchronization of the laser and the x-ray between the different measurements.
In the following, the applicability of the mean-field 1D space charge model to explain the experimental results will be tested. By using the XPS peak simulations as a fit function to the data, it should be possible to derive an optimal parameter set for the space charge potential from a global fit to all electron spectra from a delay scan. To keep the processing time of the fit function sufficiently short, only the Au 4f5/2 peak is fitted and a linear background is applied, instead of a Shirley-type-background. The upper limit of the kinetic energy range is set close to the rising edge of the Au 4f7/2 peak. All fit parameters, except the spectral intensity and the delay, are linked between all spectra of a delay scan. The individual delays are fixed to the experimental values obtained from the delay stage. Figure 5 shows experimental, and simulated spectra for selected delays. A remarkable agreement can be observed for both photon energies and the χ2 of the global fit is very good, as can be seen in the fit parameter table (table 1). It is worth to mention that the global fits converge stably to the same parameter values for various starting conditions.
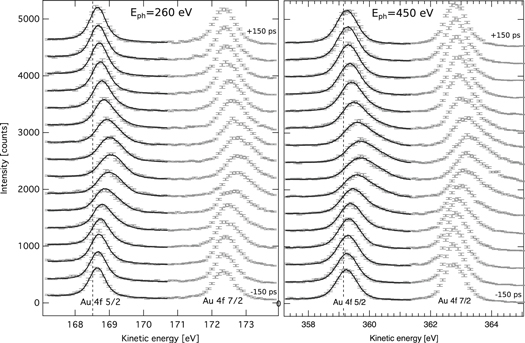
Figure 5. Global fit of simulated Au 4f5/2 electron spectra to experimental data under the influence of space-charge effects. Selected experimental spectra for delays between −150 and +150 ps in 20 ps steps are shown with error bars from statistics (grey). The fits (black lines) are in very good agreement with the data for all delays. Energy shifts, broadenings and asymmetries are well reproduced within the analytic one-dimensional model for both photon energies.
Download figure:
Standard image High-resolution imageTable 1.
Parameters of the global fits to the XPS spectra of two different delay scans within the mean-field 1D model. Nel: number of cloud electrons; rcloud: cloud disc radius; EX: Au 4f5/2 kinetic energy;  : effective pump electron energy; ΔtX: x-ray pulse length (FWHM); ΔEgauss: Au 4f5/2 Gaussian line width; t0: pump-probe time zero; #deg. free: number of degrees of freedom; χ2: chi-square statistic of the fit. Uncertainties are given as standard deviations of the fits.
| Parameter | 260 eV | 450 eV |
|---|---|---|
| Nel | 97 000 ± 1000 | 132 200 ± 900 |
| rcloud [μm] | 291 ± 3 | 248 ± 2 |
| EX [eV] | 168.559 ± 0.002 | 359.186 ± 0.002 |
 [eV] [eV] |
101 ± 2 | 272 ± 2 |
| ΔtX [ps] | 89.1 ± 0.9 | 82.6 ± 0.6 |
| ΔEgauss [eV] | 0.350 ± 0.004 | 0.614 ± 0.002 |
| t0 [ps] | −11.1 ± 0.3 | −1.1 ± 0.2 |
| #deg. free | 2651 | 3107 |
| χ2 | 2785 | 3780 |
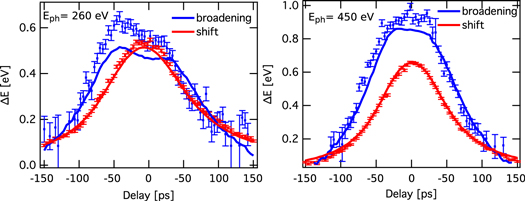
Although the global fit to the XPS spectra of a delay scan is the most direct way to confirm the applicability of the mean-field model, one might also compare the delay traces of the experimental and simulated spectra by applying a Voigt-type peak fit to the simulated spectra. Figure 6 shows such comparison. Both the energy shifts and the energy broadenings are matching quantitatively, and all characteristic features of the delay traces of the experimental data are captured in the simulated traces. This further confirms that the broadening can be described within a mean-field space charge model and is almost completely caused by the electron energy spread due to the x-ray pulse length of about 80–90 ps (FWHM). The simulated x-ray pulse width is in good agreement with a direct measurement of the electron bunch in the storage ring with a streak camera giving ΔtX ≈ 90 ps and the simulated pump electron cloud radii are in good agreement with the measured laser spot diameter. The simulated electron numbers Nel ≈ 105 are a factor of three lower than expected from the measured total photoemission currents, which might be explained with the neglect of mirror charge effects [27] or a partial back flow of cloud electrons to the sample due to Coulomb repulsion.
Figure 6. Comparison of delay traces from experimental data and simulations. Experimental data are shown with dots and error bars and simulations with solid lines for Eph = 260 eV (left) and Eph = 450 eV (right). An overall agreement regarding the shape of the traces, as well as the amplitude, between experiments and simulations is achieved. Small deviations, particularly for Eph = 260 eV, might be explained with the slightly different fit models for experimental data and simulations (see text) and not considering the Au 4f7/2 peak in the simulations.
Download figure:
Standard image High-resolution image
The effective pump electron energies ELeff = 101 eV and ELeff = 272 eV seem to be too high to directly associate them with the mean kinetic energy of the pump electrons (EL). Although photoelectrons, excited by intense 800 nm laser radiation, with kinetic energies exceeding 100 eV have been reported [12, 21], the vast majority of electrons in the cloud has much lower kinetic energies. To explain this discrepancy, it should be emphasized that the dynamic of the energy shift of the probe electrons is governed mostly by EL for positive delays in the simple 1D space-charge model. The somewhat rude approximation of this model of a rigid pump electron disc moving perpendicular to the sample surface neglects a dynamic change of the pump electron cloud size and its charge density, due to e.g. Coulomb repulsion and a non-normal distribution of electron take-off angles, which is implicitly incorporated into  . In the limiting case of very small
  , which means that the cloud remains quasi statically on the sample surface after its creation, the energy shift of the probe electrons is constant for positive delays. Conversely, the bigger
  is, the faster the energy shift decreases with increasing positive delay, which could be induced by a higher EL, but also by a dynamic expansion of the pump electron cloud. We have calculated that a cosine emission distribution of pump electrons would lead to comparable energy shifts for positive delays as a normal emission distribution, and resemble our experimental data, when EL would be reduced by about a factor of three. Prospective investigation of different sophistication of the mean-field approach for space-charge dynamics might enable to predict
  from experimentally accessible parameters like energy and angular emission distribution and number of cloud electrons, which might then be used to simulate the spectral distortions from pump-probe Coulomb interactions ad-hoc.
While spectral shifts due to SC-effects in pump-probe XPS are less critically removable in data analysis, spectral broadening—potentially masking spectral fine structures-is hardly assessable. Our simulations clearly show that for probe pulses longer than Δt ≈ 10 ps an inevitable spectral broadening due to take-off time variations occurs. Moreover, this seems to be the dominating source of spectral broadening in our experiments, which in turn let us conclude that one can establish experimental configurations with short, low-intensity x-ray probe pulses where the SC-induced spectral broadening can essentially be eliminated or strongly suppressed even for high pump electron numbers exceeding 105 e− per pulse. This raises the question whether pump-pulse-induced spectral broadening in pump-probe PES is in general predominantly caused by deterministic distributed energy shifts of the probe electrons, which could result from different take-off times, positions or angles of the probe electrons in the three-dimensional mean-field potential of the pump-electron cloud. In such scenario it might be possible to systematically narrow the energy shift distributions of probe electrons and hence reduce spectral broadening by decreasing probe-pulse length, by establishing high spot size ratios between pump and probe beam -to achieve a homogeneous pump-electron density across the probe electron beam- or by restricting the analyzed emission angle. On the other hand local probe-electron/pump-electron scattering, which should be particularly relevant for slowly spreading, high density pump electron clouds, might be more difficult to systematically deal with. It is worth to mention that pump-probe XPS dynamics of other transient macroscopic potentials, e.g. surface photovoltage, can possibly be simulated analog to space-charge dynamics as long as the transient can be described with a mean-field and the probe electron dynamics are predominantly deterministic.
5. Summary and conclusion
In this work we have investigated vacuum space-charge effects in pump-probe electron spectroscopy on a gold surface. An intense 800 nm pump laser pulse has produced a nonlinear photoemission current, in the order of 105 electrons per pulse, which influences the Au 4f photoelectrons via Coulomb interaction. By utilizing a high transmission, high resolution time-of-flight spectrometer (ARTOF), we recorded XPS spectra with high statistics, detecting peak positions with 5 meV and peak widths with 20 meV accuracies, as well as detailed line shapes and asymmetries. The high repetition rate and low photon flux of the x-ray beam have allowed to study pump pulse induced space-charge effects, excluding any significant probe–probe electron interactions. Spectral peak shifts and broadenings up to several 100 meV were observed with the broadening displaying a distinctive time evolution. In order to understand such dynamics, we have simulated XPS spectra by using a mean-field model of the space charge cloud potential. The whole set of XPS spectra can be excellently reproduced with these simulations leading to reasonable values for the pump cloud potential parameters. We found that the peak broadening can be explained quantitatively by variations in the take-off time of the probe electrons within the ≈90 ps (FWHM) x-ray pulses and that, consequently, local electron–electron scattering must be of minor importance. Our simulations show that such a deterministic spectral broadening can generally be expected for a probe pulse length exceeding about ≈10 ps. Further experiments with systematic variation of the pump-probe spot size ratio and probe pulse length might provide more insight into space-charge induced XPS dynamics, with particular regard to the peak broadening, which might help to properly distinguish them from transient dynamics of different origin.
Acknowledgments
Technical support by HZB staff at BESSY II is gratefully acknowledged. The authors thank Christian Stråhlman, Abdurrahman Musazay and Ruslan Ovsyannikov for support during beamtime. Svante Svensson and Nils Mårtensson are acknowledged for fruitful discussions about the space charge problematic in electron spectroscopy. AF and FS acknowledge funding by FLAG-ERA–Graphene—Basic Research 2 2017 in project LaMeS DFG project number 400335214. DK, RJ and AF acknowledge funding by the ERC- Advanced Investigator Grant No. 669531 EDAX.