


Abstract
A recent study claimed that heavy use of equations impedes communication among biologists, as measured by the ability to attract citations from peers. It was suggested that to increase the probability of being cited one should reduce the density of equations in papers, that equations should be moved to appendices, and that math training among biologists should be improved. Here, we report a detailed study of the citation habits among physicists, a community that has traditionally strong training and dependence on mathematical formulations. Is it possible to correlate statistical citation patterns and fear of mathematics in a community whose work strongly depends on equations? By performing a systematic analysis of the citation counts of papers published in one of the leading journals in physics covering all its disciplines, we find striking similarities with distribution of citations recorded in biological sciences. However, based on the standard deviations in citation data of both communities, biologists and physicists, we argue that trends in statistical indicators are not reliable to unambiguously blame mathematics for the existence or lack of citations. We digress briefly about other statistical trends that apparently would also enhance citation success.
Export citation and abstract BibTeX RIS

Content from this work may be used under the terms of the Creative Commons Attribution 3.0 licence. Any further distribution of this work must maintain attribution to the author(s) and the title of the work, journal citation and DOI.
1. Introduction
In a recent work, Fawcett and Higginson reported an interesting statistical analysis of the citation habits prevalent among the community of biologists working in the fields of ecology and evolution [1]. Their goal was to measure the communication efficiency among these researchers. In their report, communication efficiency was taken as tantamount to accruing paper citations, so that their task was then reduced to quantifying the ability of a paper to attract a large number of citations, regardless of the possible content of the papers, the perceived authority of the authors, or any other relevant aspect of the paper. To quantify citations, the authors considered trends in statistical indicators of citation patterns as observed on a sample containing 649 papers published in 1998 in the top three journals specialized in the aforementioned fields.
Communication efficiency was assessed by studying citation habits of two non-overlapping groups of papers referred to as theoretical and non-theoretical papers. Fawcett and Higginson considered theoretical papers to be those containing certain variations of the word model in their title or abstract, while equations were defined as mathematical expressions on lines set apart from the text, with two or more such equations written on the same line considered as separate. Mathematical papers are presumed to generate testable predictions and interpretations of observations made by empirical studies, i.e. by non-theoretical studies. The rationale for this mutually exclusive division would be that since most research in biology is empirical, despite the interdependence between empirical and mathematical papers, many empirical studies build largely on other empirical studies with little reference to relevant theory. Such dichotomic tendency was taken as suggestive of a failure of communication that ultimately ended up hindering scientific progress.
Based on their statistical analysis, Fawcett and Higginson argued that heavy use of mathematical equations impedes communication among biologists. To counter this undesired effect, the authors offered three recommendations intended to restore effective communication (i.e. citations) among theoretical and non-theoretical biologists: first, to improve the level of mathematical training of biology graduates, second, to reduce the density of equations in papers and, third, to avoid mathematical expressions in the main text, moving them preferably to appendices.
Their paper caused immediate reactions among the community of biologists. For instance, Gibbons [2] reported evidence showing that, instead of diminishing, citations actually increase with the equation density. He reached this opposite conclusion after repeating the same analysis used by Fawcett and Higginson but taking into account interaction terms between the page number and equation density measures across journals, terms intended to compensate equation density effects between journals. In addition, Gibbons finds that there is limited evidence that future citations can be directly manipulated by inserting or removing equations in papers. In another contribution, Chitnis and Smith [3] pointed out that citations do not necessarily demonstrate understanding of scientific work, since citations embedded in a long citation list to show awareness of a field are far less valuable than citations to papers forming the foundation of new work. A contribution by Kane [4] suggested the use of in-text drop-down boxes to provide mathematical details as a better alternative to equations in appendices. Fernandes [5] pointed out the neglected important fact that a negative correlation between equation density and citation rate cannot be used per se to conclude that equation density is the actual cause of impeded communication. Fernandes also points out that Fawcett and Higginson assume citation rates to reflect communication level, and that such communication level would implicitly reflect understanding. However, he presents counterexamples showing that citation rate does not correspond communication effectiveness. Fawcett and Higginson replied [6] to all the comments above saying that, in fact, their viewpoint is that essential equations capturing the assumptions and structure of a model should be presented in the main text, whereas less fundamental equations, such as those describing intermediate steps to solutions, should be presented in an appendix. Furthermore, they stress the point that they found no evidence for a general aversion to 'theoretical' papers. They also suggest that future studies to extend their analysis to other journals, as well as to other years of publication and to other fields, would be important.
Instigated by the surprising attempt of blaming math and the lack of math appendices for a lack of success in getting citations, we decided to explore the correlation between citations and density of equations, density of figures and other indicators as measured in one of the top-most journals covering all branches of physics. Our main aim was to learn about citation patterns prevailing among a community of researchers that uses mathematics extensively and that, in principle, should not be afraid of mathematics. The idea is to contrast citation patterns between biologists and physicists, and to identify and learn trends observed in papers involving a higher density of mathematics.
2. Results
2.1. Re-analysis of citations in biology
Before reporting our main results concerning citations in physics, we first describe some findings of a re-analysis that we performed on the data provided by Fawcett and Higginson as supplementary material of [1]. Our first goal is to check whether or not the aforementioned definitions of theoretical and non-theoretical papers had an impact on the findings.
In figure 1 we present in two distinct ways the citation patterns observed in biological journals. The top row lists the number of citations received from non-theoretical papers as a function of equation density (equations per page). Figure 1(a) shows a graph displaying the raw data without any binning. Figure 1(b) shows the same data, now binned into four groups of equation densities, similarly to figure 1A of Fawcett and Higginson [1]. The subdivision into three colors represents the number of pages of the cited papers. Numbers in parentheses indicate the number of papers in each subgroup. Figure 1(c) shows the same as in (b), but now grouped by different numbers of pages, as indicated in the legend of the individual panels. Figure 1(d) is similar to (b) and (c), but ignoring the subdivisions of the number of pages, i.e. the plot shows a data collapse of the results that were previously shown separated into three bins.
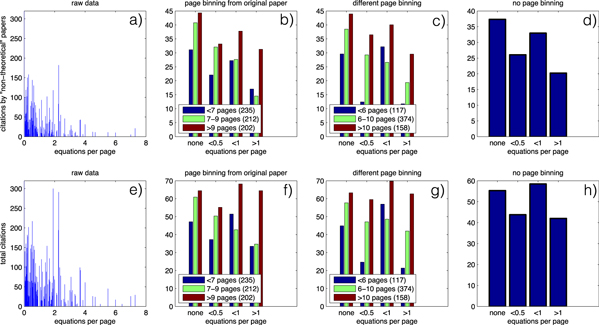
Figure 1. Citation pattern in biological journals represented in two distinct ways. Top row: separated into citations received from non-theoretical papers as originally done by Fawcett and Higginson [1]. Bottom row: according to total number of citations received (i.e. no distinction between theoretical and non-theoretical). (a) and (e): raw data, no binning, displaying impact of outliers and noise. (b) and (f): same data, binned into four groups of equation densities, as done in figure 1A of Fawcett and Higginson [1]. The subdivision into three colors represents the number of pages of the cited papers. Numbers in parentheses indicate the number of papers in each subgroup. (c) and (g): same as in (b) and (f), but now with colors giving a different grouping of the number pages. Notice that this considerably affects the slopes. (d) and (h): same as in (b) and (f), but ignoring the subdivisions of the number of pages altogether. Panels (d) and (h) show that the definition of 'non-theoretical papers' has a strong impact on the distribution of citations.
Download figure:
Standard image High-resolution imageIn the bottom row we show the same four plots given in the top row, but now including the number of citations received from of all kinds of papers (theoretical and non-theoretical) as a function of the equation density (equations per page). From this comparison we see that the trends in panels (b) and (f) coincide qualitatively. However, the most interesting feature of the figure is the different trend seen between panels (d) and (h) in the rightmost column of the figure. In these panels, there are noticeable differences in the trends. Panel (d) shows the same negative trend of the slope, which is important for reaching the conclusions of [1]. However, after including citations from all sources, panel (h) presents no evident trend in the slope. This fact contradicts the statement that a higher equation density would decrease the citation success of a paper. Therefore, these panels seem to show unambiguously that the definition of 'non-theoretical papers' has a strong impact on the distribution of citations, changing it from an almost constant distribution into a distribution with a negative trend.
Our re-analysis of the biological data shows no evidence that future citations can be directly manipulated by inserting or removing equations in the main part of the papers. Additional re-analysis involving other quantifiers was not possible from the data provided in the supplementary material of [1]. The key point here is to question the efficacy and the impact of certain concepts which have not yet been defined precisely or for which no unambiguous definition seems possible. These matters are addressed once more below, in connection with the statistics collected from citations of papers in physics.
Our re-analysis revealed that the original presentation of the data in [1] disregarded completely the fact that by far the two most cited papers that they analyzed have very high equation densities and high citation counts coming from non-theoretical papers. For instance, [7] has 1.9 equations per page and was cited 300 times, with 118 citations coming from 'non-theoretical' papers, while [8] features 2.7 equations per page, received 291 total citations with a majority of 182 arising from 'non-theoretical' papers. We believe these to be important pieces of information which obviously contradict the main thesis of [1].
In view of the fact that the density of equations per page of the biological data varies from 0 up to 7 equations per page, we find the original four bins used in [1], varying from none,  ,
,  , and
, and  equations per page, to be rather odd and arbitrary. One possible reason for selecting such odd binning might have been to select bins containing a roughly similar number of publications. However, as we have discussed, the type of binning selected strongly influences the final outcome of the analysis, something that seriously detracts from the value of the conclusions. Be it as it may, a cursory look at the raw data in panels (a) and (e) reveals that the signal is incredibly noisy, a fact sufficient to raise questions about any general statement one could possibly make.
2.2. Analysis of citations in physics
The analysis described above was also applied to investigate the citation frequency of papers in physics, as a function of the equation density. We analyzed citations of papers published in the first 1000 articles from volumes 94 and 104 of Physical Review Letters, one of the top journals in physics that publishes articles in all branches of physics. Such letters are published weekly and each volume covers a period of six months. Several interesting statistical data about the first hundred years of the journals of the Physical Review family were published by Redner [9]. The letter format of the journal allows for a maximum of about four printed pages, with no appendices. One advantageous aspect of having a page limit and of not having appendices is that citations are less dependent on the article size. Normally, long papers have most of their equations placed in specific sections, with the remaining text dedicated mostly to discussions, i.e. containing far fewer equations. This means that the equation density tends to significantly decrease for long papers, an effect more noticeable in fields which do not involve heavy mathematical formulations.
The American Physical Society provided us with selected access to their electronic archives including extensible markup language (XML) source files containing a set of metadata informations about the document, as well as the content and formatting of the paper (similar to a standard LATEX .tex file). Then, by parsing the XML file using the Beautiful Soup XML parsing library [27], we first extracted the document type from the metadata portion of the XML file. If the type was not a regular article (e.g. a comment, reply to a comment, or erratum) it was rejected. If it was a regular article we continued the process and extracted the digital object identifier (DOI) number. We then processed the standard MathML-type XML math formatting commands in the document, counting the number of 'dformula' XML elements, which mark the placement of a display formula.
After extracting the DOI and the number of display formulas, we used the DOI to generate a query string according to the Thompson Reuters Links AMR Application Programming Interface guidelines [28] for inquiring the citation data for articles recorded in their database. The query-string was transmitted via http-post-request to the Thompson Reuters ISI-server which returned an XML file containing a data-field named 'timesCited'. For each paper, this data-field provides the citation number arising from all other papers in the ISI database, including self-citations which were also considered. Note that Fawcett and Higginson [1] claim self-citations not to make much of a difference.
To create the statistics for the citations as a function of display equations we created a set of bins, each bin representing a given number of display equations. Then, the number of times that each article had been cited was sorted into the corresponding bin, and the bin normalized by the number of articles that contributed to that bin.
Figure 2 compares the citation frequency obtained in our analysis of volumes 94 (2005, top row) and 104 (2010, bottom row). We use three distinct bin sizes to present the data. This is done to compensate for any possible biasing that could arise from the fact that the equation density of papers in physics is considerably higher. Each bar shows the average citation count in its corresponding bin. In figures 2(a) and (d) the binning is the same one used by Fawcett and Higginson. Panels 2(b) and (e) present the data binned more finely, while panels 2(c) and (f) display the data using an even finer bin size. The error bars given show the standard deviation around the average citation count. No errors bars are given for bins containing a single paper. Comparison of the top and bottom rows in figure 2 shows that citations from both volumes display qualitatively similar behavior, despite the fact that volume 94 had five more years to collect citations than volume 104. The figure also shows that, independently of the binning used, all panels display relatively constant plateaus similar to the ones observed for the citations in biology, in the rightmost top panels in figure 1.
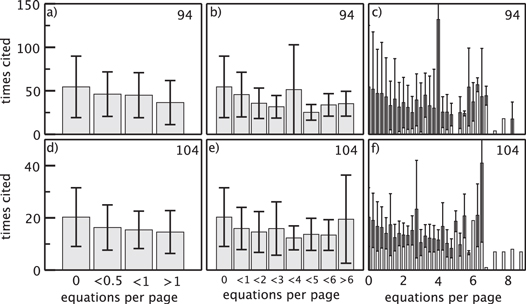
Figure 2. Citations received by the first 1000 articles in two distinct volumes of Physical Review Letters as a function of the equation density. Top row: volume 94 (2005). Bottom row: volume 104 (2010). (a) and (d) Binned as in Fawcett and Higginson [1]; (b) and (e) binned more finely. Note apparent changes in slopes. (c) and (f) Using an even finer bin size. Note the impact of outliers. The error bar gives the standard deviation around the average citation count of each bin. No errors bars are given for bins containing a single paper. Data from both volumes display qualitatively similar behavior (see text).
Download figure:
Standard image High-resolution imageUnderpinning our analysis is the assumption that physicists traditionally have good training in mathematics. When analyzing data analogously to the biologists, we obtain a somewhat similar result. In other words, plotting our data with their choice of binning also shows a decrease with equation density, despite differences in mathematical training of the groups of authors. However, such decrease is not significant because it is well within the large error bars. When plotting with finer binning the differences seem to vanish and the data essentially shows a plateau with huge standard deviations, being sometimes dominated by a single high-impact paper (which seems to be a general issue with citation based performance metrics). Data from volumes 104 and 94 show qualitatively similar behavior. We conclude that our data do not display significant effects caused by equation density.
2.3. Going beyond displayed equations
Figure 2 shows that, surprisingly, a large number of papers in physics contain no displayed equations. Additionally, plotting the number of papers as a function of the equation frequency (a plot not shown here) we observed that, instead of the familiar Gaussian or Poisson laws, the use of equations seems to obey the more elusive log-normal distribution [10].
Are there controllable factors capable of measurably affecting the citation success? In other words, apart from displayed equations, what other indicators could hint for success in obtaining citations? Figure 3 presents some alternative statistical indicators obtained from the data in volume 104 of Physical Review Letters.
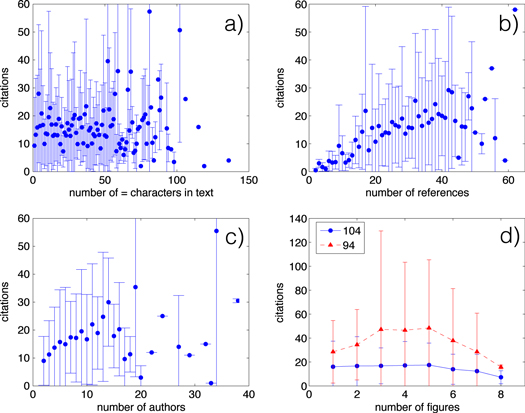
Figure 3. Some alternative statistical data obtained from volume 104 of Physical Review Letters: (a) frequency of citations as a function of the accumulated number of equal signs (contained in both displayed and in-line equations), showing no useful trend; (b) citation frequency increases as a function of the number of references that a paper cites. (c) Citation frequency increases as a function of the number of authors of the letter. (d) While the data from volume 94 reveals a maximum of the citation frequency as a function of the number of figures, data from volume 104 shows much less correlation. Note the large uncertainty of the data in all panels, indicated by error bars.
Download figure:
Standard image High-resolution imageDue to the four-page limit for letters in Physical Review Letters, authors frequently avoid displayed equations by accommodating them inside the running text. Therefore one might consider a different criterion to identify equations, namely the number of equal signs, '=', irrespective of whether they appear in displayed equations or in the running text. Such data is shown in figure 3(a). This figure does not reveal any clear trend, similarly to what happens when counting only displayed equations (figure 2).
A factor apparently affecting citation success seems to be the number of references that a paper contains (figure 3(b)). Maybe this is understandable by the fact that by citing other work, the authors of the cited work might become aware of the citing paper and thus cite it back in their further research. In other words, this could hint for a sort of cascading 'if you cite me, I will cite you' behavior amongst authors.
A factor frequently argued to influence the citation success is the number of authors that a paper contains. Indeed, this observation has been used recently to suggest that the process of knowledge creation has now fundamentally changed, from the domain of solo authors to work done by teams [11–16], a suggestion not free from controversy [17–19]. In our data, we find that the number of authors in a paper seems to display some (mild) trend, as illustrated in panel 3(c), where we considered data only for papers with less than 50 authors. This trend may be understood in a simplistic way: there is a fair probability that the original paper gets cited every time that one of the original many authors writes a subsequent paper. Incidentally, note that parts of the statistics are dominated by outliers, namely by extreme events in the sample of papers considered. For instance, there are some papers where the number of authors (and their success) is rather astronomical. [20] contains hundreds of authors, the so-called CDF collaboration, while [21], corresponding to the large peak in figure 2(b), (c), contains three authors, 16 numbered equations, two figures, and has so far receive more than 800 citations.
Figure 3(d) shows a comparison of the number of citations as a function of the number of figures contained in each letter for volumes 94 and 104 of Physical Review Letters. While the data for volume 104 seems to reproduce the same flat distribution observed in several occasions above, ignoring the large error bars one could possibly argue that data for volume 94 display relative maxima for papers which contain an average of one figure per page. Thus, the number of figures in the paper seems to have an overall higher impact than the number of equations that it contains.
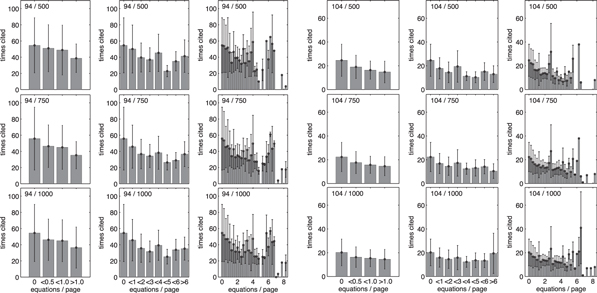
Finally, we observe that when 1000 papers in a sample are binned into 20–30 categories, the frequency in an individual bin may look too small to evaluate standard deviation with high confidence. To check the impact of the sample size, figure 4 presents plots for both volumes, 94 and 104, where we repeated the test in figure 2 but now considering what happens when using samples of 500 and 750 papers. The results from figure 2 (for 1000 papers) are also presented to facilitate comparison. From figure 4 one may easily recognize that there is no significant dependence on the sample size.
Figure 4. Effect of sample size on the distribution of citations for both volumes, 94 and 104. This figure is analogous to 2 but generated considering only the first 500 and 750 letters. For comparison, the results for 1000 letters are also shown. The error bars given by the standard deviations remain relatively constant while the average value fluctuates inside this interval, thus we conclude no effect of sample size on our main result.
Download figure:
Standard image High-resolution image
3. Discussion
There is a disseminated social stigma attached with doing mathematics. While it seems to be possible to do it non-consciously [22], much anxiety and pain also seems to be related to doing math [23]. Here, we investigated whether math could indeed be the villain preventing scientific papers of being properly cited as argued recently. We find that conclusions drawn by Fawcett and Higginson [1] from the analysis of papers published by biologists are strongly dependent on their artificial subdivision of papers into theoretical and non-theoretical work. They also disregarded relevant data contradicting their thesis. The idea that a lack of training in reading/doing mathematics is responsible for the lack of citations seems not to be true since data reflecting habits of a broad community of physicists displays similar trends as those found in publications by biologists. In any case, we emphasize that in all cases the citation data is so noisy that its not reliable for identifying unambiguous trends capable of predicting citation success.
To get cited, it seems that it does not really matter how much math one uses. If, despite error bars, one insists on believing in the predictive power of the scientometric results, then we find that there are much stronger indicators likely to increase citation success. Taking the indexes seriously, one could imagine that a method of being cited could be to have, say, a dozen coauthors, cite several dozens of papers and, on the average, use 1 figure per page. However, there is an interesting study by Bornmann et al [24] of roughly 2000 manuscripts submitted to the journal Angewandte Chemie International Edition. These authors were able to analyze reviewers' ratings of the importance of the manuscripts' results and examine the extent to which certain factors that previous studies demonstrated to be generally correlated with citation counts increase the impact of papers, controlling for the quality of the manuscripts (as measured by reviewers' ratings of the importance of the findings) in the statistical analysis. They find that besides being associated with quality, citation counts are correlated with the citation performance of the cited references, the language of the publishing journal, the chemical subfield, and the reputation of the authors. However, in contrast to our findings, their study found no statistically significant correlation between citation counts and number of authors.
Other clues may be obtained from a study that seeks to answer the question of the extent to which scientists are motivated to cite a publication not only to acknowledge intellectual and cognitive influence of peers, but also other, possibly non-scientific, reasons [25]. Finally, we mention the existence of a mechanistic model [26] for the citation dynamics of individual papers, purportedly capable of showing that all papers tend to follow the same universal temporal pattern. As for our paper, we surely hope to defy the odds, since we are only three authors, cite a small number of papers, and have a low figure density. However, just to be on the safe side, we made sure not to include any equations.
Acknowledgments
This work was supported by Deutsche Forschungsgemeinschaft through the Cluster of Excellence 'Engineering of Advanced Materials' and by the Max-Planck Institute for the Physics of Complex Systems, Dresden, in the framework of the Advanced Study Group on Optical Rare Events. JACG was also supported by CNPq, Brazil. We are indebted to the American Physical Society and the Physical Review Letters from generously granting access to the data studied here. The (paid) access to the Thompson Reuters Data was also invaluable. We acknowledge support by Deutsche Forschungsgemeinschaft.