


Abstract
Studying the phonon dispersion of the ferromagnetic shape memory alloy system Ni–Mn–Ga gives insight into the mechanism of the martensite transition and the forces driving the transition. Transformation of austenite single crystals under uniaxial stress results in the coexistence of two martensitic variants with perpendicular modulation vector. Here we report on inelastic neutron scattering studies of martensite crystals with off-stoichiometric compositions, varying from non-modulated (NM) to five- (5M) and seven- (7M) layer modulated martensite phases. Both the 5M and 7M crystals show fully commensurate satellite peaks along [ 0], corresponding to the five- and seven-layer modulation. These superstructure peaks become Γ-points of the modulated structure. Due to the coexistence of two variants within the (001) plane, both new acoustic phonons reflecting the modulation vector [
 0] and acoustic TA2[ξξ0] phonons corresponding to the non-modulated direction are observed. The latter display a pronounced softening around ξ = 0.2–0.4 when approaching the martensite–austenite transition from above and below, i.e. this soft mode has lowest frequency at the transition temperature. Overall the phonon dispersion of the austenite and martensite phase resemble each other very much. The coexistence of two martensitic variants after uniaxial transformation explains the particular behaviour of the low-energy excitations, in contrast to previous interpretations involving charge-density waves and associated phason modes.
Export citation and abstract BibTeX RIS

Content from this work may be used under the terms of the Creative Commons Attribution 3.0 licence. Any further distribution of this work must maintain attribution to the author(s) and the title of the work, journal citation and DOI.
1. Introduction
Ni–Mn–Ga magnetic shape memory materials show a magneto-structural transition, which leads to large strains of 6 and 10% under applied external magnetic field for off-stoichiometric compositions with five-layered and seven-layered martensite structures, respectively (Murray et al 2000, Sozinov et al 2002). The ferromagnetic shape memory effect covers two distinct effects: magnetic field induced structural transition (MIT) and magnetic field induced variant reorientation (MIR). For the observation of MIT, the structural transition temperature change has to be strongly coupled to the external magnetic field. Indeed, this coupling is present for all Ni–Mn-based magnetic shape memory alloys, but it is weak in Ni–Mn–Ga compared to other Ni–Mn-based alloys (Acet et al 2011). Its uniaxial magneto-crystalline anisotropy in the martensite phase is strong, however, compared to the energy barrier for twin boundary mobility. As a consequence, it is possible to move the twin boundaries just by applying an external magnetic field in the range of 0.5–1 T (Murray et al 2000, Sozinov et al 2002). This mobility of the twin boundaries allows the minimization of the Zeeman energy which is created by the external magnetic field (Acet et al 2011).
The vibrational properties of the Ni–Mn–Ga alloy system in its high temperature austenite phase have been studied extensively by inelastic neutron scattering (Zheludev et al 1995, 1996, Stuhr et al 1997, 2000, Mañosa et al 2001, Ener et al 2012). Also the structural transition properties of stoichiometric and off-stoichiometric compositions of Ni–Mn–Ga have been investigated by different methods, but are yet not fully understood (Brown et al 2008). Low temperature martensite phases of five-layer modulated (5M), seven-layer modulated (7M) and non-modulated (NM) martensite phases have been observed, depending on the specific chemical composition. The shape memory effect due to the reorientation of the variants (MIR) is restricted to the modulated martensites, because only here is the energy barrier for twin boundary mobility comparable to the Zeeman energy. The crystal structures of 7M and 5M martensites show periodic modulations of (110) planes in ![$[1\bar{1}0]$](https://content.cld.iop.org/journals/1367-2630/15/12/123016/revision1/nj482078ieqn3.gif) direction with twin boundaries. A first model of the 5M martensite has been suggested by Martynov and Kokorin (1992) which defines the modulation of the (110) planes with harmonic terms. The agreement of this model with experiment has been tested with transmission electron microscopy (Pons et al 2005), x-ray (Mogylnyy et al 2003, Righi et al 2007) and neutron diffraction (Brown et al 2002, Kushida et al 2008) studies. A second approach for the modelling is to consider piecewise linear modulations instead of sinusoidal (Righi et al 2007). The expected differences in the diffraction experiments for these two models are very small, however, and experiments were not able to distinguish between these two models yet.
direction with twin boundaries. A first model of the 5M martensite has been suggested by Martynov and Kokorin (1992) which defines the modulation of the (110) planes with harmonic terms. The agreement of this model with experiment has been tested with transmission electron microscopy (Pons et al 2005), x-ray (Mogylnyy et al 2003, Righi et al 2007) and neutron diffraction (Brown et al 2002, Kushida et al 2008) studies. A second approach for the modelling is to consider piecewise linear modulations instead of sinusoidal (Righi et al 2007). The expected differences in the diffraction experiments for these two models are very small, however, and experiments were not able to distinguish between these two models yet.
Up to now mainly the phonon dispersion in the austenite phase for alloys of different composition has been investigated to understand the nature of the martensite transition (Zheludev et al 1995, 1996, Stuhr et al 1997, 2000, Mañosa et al 2001, Ener et al 2012). These investigations revealed the atomistic trajectory for the transition from austenite to martensite. To comprehend the nature of MIR it is essential to know the phonon dispersion in the martensite phase. For the present work single crystals of the Ni–Mn–Ga system have been grown in the high temperature austenite structure. Note that cooling the austenite phase down into the martensite phase without precaution would fail due to the emergence of multiple martensite variants. For the work at hand, austenite crystals of different compositions have been successfully transformed to single variant non-modulated (NM) martensite and double variant 5M and 7M modulated martensite crystals by mechanical training (Rolfs et al 2012). By means of those the complete 5M martensite phonon dispersion has been measured at room temperature and compared to those previously measured in austenite (Ener et al 2012). Further temperature dependent measurements of the TA2[ξξ0] phonon mode were carried out. A maximum in softening of the TA2[ξξ0] mode is found at the transition temperature. In addition crystals of similar composition have been transformed to 7M and NM martensite, and their TA2[ξξ0] phonon modes have been examined, too.
2. Sample characterization and single crystal diffraction
Single crystals of different composition of Ni–Mn–Ga have been grown by a modified Bridgman technique (Rolfs et al 2012) by Rolfs and Schneider from Helmholtz-Zentrum Berlin. Rectangular samples with typical dimensions of 8 × 5 × 3 mm3 for 5M, 7 × 5 × 4 mm3 for 7M and 6 × 4 × 3 mm3 for NM have been cut out of the crystal bars and have then been transformed to martensite single crystals by mechanical training (Rolfs et al 2012). The transformation under uniaxial compressive stress selects the c-axis. For non-modulated martensite this leads to a single variant crystal in the strict sense. For modulated martensite there remain two perpendicular choices for the modulation vector in the (001) plane, pointing in the [ξξ0] and [ 0] direction (throughout this paper we use the cubic austenite notation). This is what is understood commonly in literature as a martensite single crystal (Shapiro et al 2007).
The chemical composition of each crystal has been determined by energy dispersive x-ray spectroscopy (EDX) with typical compositional changes along the sample below 1%. Table 1 summarizes the characteristics of the martensite crystals used for this paper. In accordance with the phase diagram of the Ni–Mn–Ga system non-modulated martensite is observed for the stoichiometric composition and compositions nearby. For two samples cut out of the identical austenite single crystal rod different modulations have been found in martensite, namely 5M and 7M, indicating that the phase diagram of the Ni–Mn–Ga system depends on subtle details in composition, the differences of which are beyond the precision of EDX measurements.
Table 1. Composition and structure in the martensite phase. All samples have been mechanically trained (Rolfs et al 2012). The sample with asterisk has been used by Ener et al (2012) for austenite measurements.
| Composition | Martensite structure |
|---|---|
| Ni50Mn30Ga20 | NM |
| Ni50Mn29Ga21* | 5M commensurate |
| Ni49Mn32Ga19 | 7M commensurate |
The crystallographic properties of the 5M single crystal have been investigated in detail by neutron diffraction at the thermal single crystal diffractometer (RESI) at the Heinz Maier-Leibnitz Zentrum (MLZ) in Garching, Germany. Room temperature diffraction measurements have been carried out on an Eulerian cradle with ki = 1.039 Å. Table 2 summarizes the refinement results of the room temperature measurements of the 5M martensite single crystal. The composition is determined directly from the occupancy factors of the corresponding elements. We settle the discrepancy in composition between EDX (Ni49Mn32Ga19)—which convention has been followed by Ener et al (2012)—and diffraction analysis (Ni50Mn29Ga21) in favour of the diffraction results, because this can be considered as the proper average over the whole crystal. Phase transition temperatures for this composition have been measured by DSC to be MS = 361.0 K, MF = 351.2 K, AS = 357.5 K, AF = 371.2 K and TC = 371.2 K. Figure 1 shows how the peaks observed in the measured (001)-plane of the mechanically trained five-layered martensite phase follow from the existence of two variants as resulting from compressive stress along the [001]-direction. The additional variation of the peak intensities over reciprocal space is due to how neutron scattering samples the Fourier components of the structure and implies that the modulations are of predominantly transversal character.
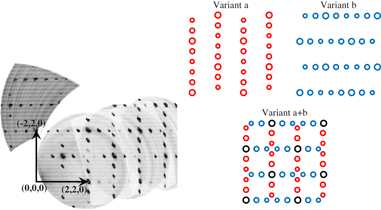
Figure 1. The reconstructed (001)-plane of five-layered modulated martensite. Left: single crystal diffraction data. Right: Fourier components of modulation superstructure. Red circles indicate a modulation along the ( 10)-direction, blue circles along the (110)-direction, resulting in the pattern below for a two-variant sample that reproduces the measurement.
Download figure:
Standard image High-resolution imageTable 2. Atomic positions, occupancy factors and isotropic thermal displacement parameters (Uiso) of the monoclinic martensite phase of Ni50Mn28.9Ga21.1 with the space group of I2/m(α0γ)00. The monoclinic unit cell parameters are a = 4.1933 ± 0.0018Å, b = 5.5543 ± 0.0020Å, c = 4.2013 ± 0.0029Å and α = γ = 90°, β = 90.273 ± 0.052°.
| Atom label | x | y | z | Occupancy | Uiso (Å2) |
|---|---|---|---|---|---|
| Mn | 0 | 0 | 0 | 0.5 | 0.009(2) |
| Ga | 0 | 0.5 | 0 | 0.422(10) | 0.0083(18) |
| Mn | 0 | 0.5 | 0 | 0.078(10) | 0.0083(18) |
| Ni | 0 | 0.2519(5) | 0.5 | 0.5 | 0.0098(8) |
Figure 2 clearly evidences the commensurate structure of the 5M and 7M martensite phase in the single crystal. Figure 2(a) shows the modulated structure of 5M in the transversal [ 0]-direction, whereas longitudinal [ξξ0]-measurements of seven-layer modulation are shown in figure 2(b). The weaker signal of the longitudinal measurement again shows the transversal character of the modulations. For the refinement of the 5M, the superspace approach has been used (Janner and Janssen 1977). A sinusoidal modulation with a commensurate modulation vector of ξ = 0.4 r.l.u. is found for 5M martensite. The observed scattering pattern and the refinement results agree well with existing literature (Righi et al (2007) and Brown et al (2002); note the differing notation conventions for tetragonal descriptions). Similar refinement for measurements at the 7M crystal failed due to overlapping peaks caused by incomplete transformation of the crystal.
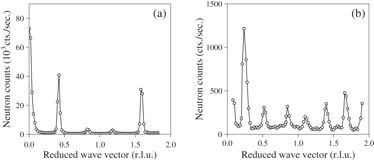
Figure 2. Transversal and longitudinal elastic measurements at room temperature on triple axis spectrometer PUMA: (a) 5M Ni50Mn29Ga21 along [2 + ξ,2 − ξ,0]—see also figure 8 by Ener et al (2012)—and (b) 7M Ni49Mn31Ga20 along [2 + ξ,2 + ξ,0].
Download figure:
Standard image High-resolution image3. Phonon dispersions and discussion
Inelastic neutron scattering experiments were carried out at the thermal three-axis spectrometer (PUMA) and cold three-axis spectrometer (PANDA) at the Heinz Maier-Leibnitz Zentrum in Garching, Germany. For room temperature phonon measurements samples were mounted on a small aluminium sample holder. Phonons are mainly measured in constant kf-mode using the PG(002) monochromator and analyser, both in focusing geometry. Depending on the slope of the dispersion some measurements were done in constant frequency-mode. The temperature dependence of the TA2[ξξ0] phonon has been measured in a cryostat with the sample mounted in an aluminium can filled with He to ensure better thermal conductivity. Thus a temperature stability of ±0.5 K has been achieved.
3.1. Five-layer modulated (5M) martensite
Figure 3 shows the measured vibrational modes in high symmetry directions of the 5M modulated martensite measured at room temperature. Similar to the diffraction data, the phonons are displayed in r.l.u. of the cubic L21 representation. The symmetry breaking due to the modulation leads to a more detailed phonon dispersion, as most of the cubic high-symmetry directions decay into sets of inequivalent directions. The most striking effect can be expected to arise in the cubic [ξξ0]-direction, where in the modulation direction (which we will denote as [ ] of the martensite) new Γ-points will arise. Due to the coexistence of the two perpendicular modulated domains some inequivalent directions cannot be distinguished (such as the phonons along the modulation direction [
 ] from those along [ξξ0], i.e. perpendicular to the modulation direction in the (001)-plane), leading to apparent acoustic branches and five experimentally inequivalent high-symmetry directions. For some of those directions the transversal branches are degenerate. The overall picture of the martensite phonon excitations resembles very much that of the austenite counterpart, see figures 3 and 6 by Ener et al (2012). Especially the optical branches are nearly indistinguishable.
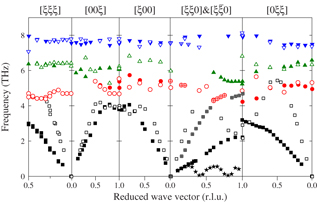
Figure 3. Phonon dispersion of Ni50Mn29Ga21 for the high symmetry directions of the 5M martensite structure. Measurements are done at 300 K. Full and open symbols represent transversal and longitudinal directions and different symbol types indicate different modes.
Download figure:
Standard image High-resolution imageRemarkable are the differences for the transversal acoustic phonons in the [ξξ0] and [0 ξξ] directions caused by the symmetry breaking in the martensite phase. Compared to the austenite, the TA2[0 ξξ]-branch becomes stiffer, while the TA2[ξξ0]-branch becomes softer. This qualitative behaviour will be discussed below. Similar to what has been observed in the austenite phase the TA2[ξξ0] phonon branch exhibits a kind of dip in the interval of 0.2 < ξ < 0.4 r.l.u.
3.2. Temperature dependent phonons 5M
We first turn to the TA2[ξξ0] phonon branch. From previous measurements in the austenite phase (Zheludev et al 1995, 1996, Stuhr et al 1997, Mañosa et al 2001, Ener et al 2012) it is known that the TA2[ξξ0] mode shows a pronounced softening when approaching the transition, thereby indicating a low energy barrier for the modulation of the (110) planes in [110] direction. These modulations correspond to the deformation to achieve the martensite stacking sequence. For the near stoichiometric compositions the softening is centred around TA2[ ] and for the off-stoichiometric compositions the softening shifts to lower values of ξ (Stuhr et al 2000, Mañosa et al 2001, Ener et al 2012).
Once the (pre-)martensite phase is entered the phonons related to the transition harden again with decreasing temperature. Within a modified Ginsburg–Landau approach the square of the frequency of the soft phonon serves as order parameter for the first-order displacive transition (Krumhansl and Gooding 1989). Therefore the TA2[ξξ0] mode around  can be interpreted as a dynamical precursor of the structural transition. Figure 4 depicts the temperature dependence of the TA2[ξξ0]-mode in the martensite phase (coloured symbols). For comparison one measurement has been performed in the austenite phase (open black symbols). Also in the martensite phase the TA2[ξξ0]-branch shows a softening between ξ = 0.2 and 0.4 r.l.u, albeit less pronounced than in the austenite. The situation is reversed towards the zone boundary. Here the martensite phonons are lower than the austenite ones. Most important, all of the TA2[ξξ0] phonons in the martensite phase soften with increasing temperature towards the transition—see also figure 9(b) by Ener et al (2012)—and thereby anticipate the softened dispersion in the austenite. As these phonons do not participate in the transformation of the modulated martensite, this is all the more surprising.

Figure 4. Transversal phonon mode (TA2[ξξ0]) of the off-stoichiometric Ni50Mn29Ga21 sample with 5M martensite modulation for different temperatures. For comparison one dispersion has been measured in the austenite phase (open symbols, 340 K). Lines are to guide the eye.
Download figure:
Standard image High-resolution image3.3. Phonons reflecting 5M modulation
Now to the apparent fourth acoustic branch in the [ξξ0] measurement. Due to the two-variant state of the crystal our measurement probes both phonon propagations along and perpendicular to the modulation vector. Figure 5 shows, in an iso-intensity plot, the distribution of these low lying transversal excitations as measured in high resolution constant Q-scans on the thermal triple axis spectrometer PUMA. The red symbols indicate the peak maxima determined by Gaussian fits to the measured intensity distributions and correspond to the measured phonons in figure 2. The almost linear branch—squares in figure 5—corresponds to the TA2-mode, the propagation of which is perpendicular to the modulation direction. The modulated dispersion—circles in figure 5—perfectly fits to the observed superstructure peaks in figures 1 and 2(a), which are simply the Γ-points of the 5M martensite structure. The band of low lying excitations is therefore nothing else than the transversal acoustic modes along [ ] with (110) polarization.

Figure 5. Contour plot of the transversal low frequency excitations in the Ni50Mn29Ga21 crystal with 5M modulation with [ξξ0] propagation. Colour indicates the intensity on a logarithmic scale. Red dots and squares correspond to the peak maxima of the measured phonon intensities. Lines are to guide the eye. Measurements were performed at room temperature at the thermal triple axis spectrometer PUMA.
Download figure:
Standard image High-resolution imageTo our best knowledge first principle calculations of the phonon dispersion for the 5M martensite are not available. Such calculations are complicated by the fact that the off-stoichiometric concentration and subsequent 5M modulation demands huge super-cells (Gruner and Entel 2009). However, first principle calculations of the non-modulated martensite phase are available for the stoichiometric concentration (Entel et al 2008). Figure 6 compares these calculations with the phonons measured along [ξξ0] propagation. Measurement and ab initio calculation fit remarkably. The energy bands for the optical phonons are caught correctly by the calculations. Also the smoothed dip in the TA2[ξξ0] branch is reproduced. Of course the transversal phonons related to the 5M modulation are not captured, as the modulation is not put into the calculation.

Figure 6. Phonon dispersion of 5M martensite Ni50Mn29Ga21 measured along [ξξ0] (symbols as in figure 3) and compared to first principle calculations (Entel et al 2008) for stoichiometric tetragonal martensite (lines).
Download figure:
Standard image High-resolution image3.4. Phonons in seven-layer modulated and non-modulated martensite
The sensitivity of the Ni–Mn–Ga alloy system to subtle changes in composition is perfectly illustrated by the fact that one sample cut out of the same rod as the one for the above described 5M martensite transformed during training to 7M martensite. Figure 2(b) demonstrates the perfect commensurable structure, superstructure peaks repeat along [ξξ0] with a periodicity of 2/7 r.l.u. Compared to the case for 5M (figure 2(a)), the superstructure peaks are broadened. Single crystal diffraction shows that the transformation into 7M is only partial. The contour plot of the inelastic intensity (figure 7) shows a clearly discernible TA2[ξξ0] branch. Phonon intensity related to the 7M modulation is evidenced only faintly (dashed line in figure 7). Magnon scattering becomes visible with its steep slope of ℏω∝q2 (dotted line in figure 7). Figure 8(a) collects all acoustic phonons measured for [ξξ0] and [0 ξξ] propagation in 7M. Also here the non-equivalence for the two propagation directions is clearly visible and can be understood by the same argument as for 5M.

Figure 7. Contour plot of the transversal low frequency region of [ξξ0]-direction for 7M martensite Ni49Mn32Ga19 measured at room temperature at the thermal triple axis spectrometer PUMA.
Download figure:
Standard image High-resolution image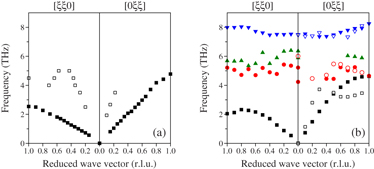
Figure 8. Phonons in modulated and non-modulated martensite for the two inequivalent directions [ξξ0] and [0 ξξ], both at room temperature (symbols as in figure 3). (a) 7M martensite Ni49Mn32Ga19. (b) Non-modulated martensite Ni50Mn30Ga20.
Download figure:
Standard image High-resolution imageFor Ni50Mn30Ga20 the austenite transforms directly to non-modulated martensite. Phonon measurements in the martensite have been performed at room temperature (figure 8(b)). The precursor dip in the TA2-mode almost vanishes like in the off-stoichiometric 5M and 7M martensite. Again phonons have been measured in the two non-equivalent directions [ξξ0] and [0 ξξ]. The stiffening of TA2[ξξ0] is in line with the behaviour in the modulated crystals. The optical modes seem to be decoupled from the differences in the acoustic region. Independent from concentration and 5M, 7M or NM they all lie in the same frequency range and show little dispersion with ξ.
3.5. Comparison with phonon measurements in literature
While extensive phonon studies of the Ni–Mn–Ga system exist for the austenite and pre-martensite phase (Zheludev et al 1995, 1996, Stuhr et al 1997, 2000, Mañosa et al 2001, Ener et al 2012), measurements of the phonon dispersion in the martensite are scarce, probably due to the difficulty of achieving single variant crystals when passing through the austenite–martensite transition. Indeed only the recent publication by Shapiro et al (2007) reports about phonon measurements in the martensite phase of stoichiometric Ni2MnGa. Analogous to the work reported here, they prepared their single crystal by imposing a uniaxial preferred direction, in this case via an external magnetic field of 1.5 T, during cooling into the martensite. As already reported earlier (Zheludev et al 1996) this crystal shows in the martensite an incommensurate superstructure peak along [ξξ0] at ξ = 0.43. This emerging elastic diffuse scattering at incommensurate ξ = 0.43 has also been reported for the Ni2MnGa used in this work (see figure 8(a) by Ener et al (2012)). Shapiro et al (2007) report about a TA2[ξξ0] branch in the martensite similar to what is shown in figure 5. Additional to this TA2-mode they report a kind of new transversal excitation evolving from ξ = 0.43. They argue that the peak at ξ = 0.425 r.l.u. is an elastic charge-density wave (CDW) peak. They consider the inelastic signal emerging from qCDW to be the phason associated with the CDW.
Our experimental data agree very satisfactorily with those of Shapiro et al (2007) (compare their figures 3 and 4 to figures 5 and 6 here). However, our interpretation is fundamentally different. Due to the coexistence of two martensitic variants in our sample (figure 1) we expect our data to show two TA2 branches superimposed over each other, one corresponding to phonons with a propagation direction along the modulation and one orthogonal to it. Obviously, there is no reason for these two branches to have the same speed of sound. In light of this fact, we come to the conclusion that the observations of Shapiro et al are due to the same phenomenon: their uniaxial magnetic field a priori also favours two possible orientations equally, and if the twinning energy does not suffice in our case to ensure the whole sample to adopt a single martensitic variant, it likely also did not in their case. The different sound velocities, which are their main argument for the phason mode, are then just due to the inequivalent directions of propagation. The only difference that remains is that the nominally stoichiometric crystal used by Shapiro et al (2007) transforms to an incommensurably modulated martensite, whereas our off-stoichiometric crystals display perfect 5M or 7M modulations.
3.6. Qualitative comparison
As discussed above, the phonons of the different phases (5M, 7M, NM, austenite) do not differ noticeably for the most parts. Specifically the optical bands occupy similar energy regions. Apart from the obvious differences following from the modulations, the acoustic phonons are affected by the transformation with respect to two aspects: First, the [ξ00] zone boundary phonons harden significantly compared to the austenite, and the [0 ξξ] and [ξξ0] phonons split in all the martensite phases. This latter point might be explained by a simple consideration: At the transition to any martensite phase, the cubic unit cell is deformed to a c/a-ratio of about 0.94 at nearly constant volume (Brown et al 2002). Therefore the distance between neighbouring (011)-planes is shortened compared to the distance between (110)-planes. This gives rise to hardened [0 ξξ] phonons and softened [ξξ0] phonons at the Brillouin zone boundary, both compared to the symmetric austenite.
In contrast to the argumentation at the Brillouin zone boundary, the macroscopic elastic properties in the [ξξ0]-direction remain largely unaffected as evidenced by the initial slopes of the corresponding acoustic phonons (figure 9 and table 3).

Figure 9. Initial slopes of the transversal and longitudinal [ξξ0] phonon branches of Ni50Mn29Ga21 in austenite (black, Ener et al 2012) and 5M modulated martensite (red) phases.
Download figure:
Standard image High-resolution image
Table 3. Comparison of the calculated sound velocities of off-stoichiometric L21 austenite and 5M martensite phases.
| Austenite (105 cm s−1) | 5M martensite (105 cm s−1) | |
|---|---|---|
| νLA | 8.15 ± 0.24 | 7.92 ± 0.32 |
| νTA1 | 4.92 ± 0.15 | 4.55 ± 0.14 |
| νTA2 | 1.63 ± 0.10 | 1.78 ± 0.07 |
4. Summary
Single crystal diffraction of the martensite phase of off-stoichiometric Ni50Mn29Ga21 confirm earlier high-resolution powder- and single-crystal neutron diffraction experiments of Brown et al (2002). The martensite is not exactly in tetragonal symmetry as expected but in monoclinic symmetry. The refinement results show that the Ni, Mn and Ga atoms occupy their original positions and excess Mn atoms only occupy Ga sites.
The full phonon dispersion of the 5M martensite is measured for each high symmetry direction. The phonon dispersions of the austenite and martensite very much resemble each other. Optical phonons are in the same energy region, despite the structural changes. The acoustic zone boundary modes along [ξξ0] and [0 ξξ] split according to the symmetry breaking at the transition. In the narrow region around TA2[ξξ0] with ξ = 0.2–0.4 r.l.u. a pronounced softening is observed when approaching the martensite–austenite transition from above and below, i.e. this soft mode has lowest frequency at the transition temperature. It can be interpreted as a dynamical precursor of the first-order phase transition within a modified Ginsburg–Landau theory (Krumhansl and Gooding 1989).
Both the 5M and 7M crystals show fully commensurate satellite peaks along [ξξ0], reflecting the five- and seven-layered modulation. These superstructure peaks become Γ-points for 'new' acoustic phonons, reflecting the reduced Brillouin zone of the modulated structures. We explain the apparent coexistence of a seemingly unchanged TA2 mode and the new low-energy phonons by the two-variant state of the sample. This also provides an explanation for the earlier results by Shapiro et al (2007) without invoking phason modes associated with a charge-density wave.
Acknowledgments
This work has been financially supported by the DFG Priority Program (SPP1239). We thank K Rolfs and R Schneider for producing the single crystals. Experimental help by K Hradil and R Mole at PUMA is gratefully acknowledged.