
Abstract
The accelerator magnets for the high luminosity upgrade of the large Hadron collider use Nb3Sn conductor to achieve the required in-field performance. To sustain the Lorentz forces during operation, a pre-compression is applied to the coils during the fabrication of the magnet. This can lead to an irreversible degradation of the Nb3Sn conductor due to its mechanical sensitivity. In this study, the impact of the pre-compression applied to the conductor at room temperature is investigated using a reacted double-stack specimen made of two Nb3Sn Rutherford cables. The cables have a keystone angle and are stack with a non-inverted configuration, without compensating the angle. The rectangular specimen is submitted to increasing transverse compressive stresses at room temperature applied perpendicularly to its width. The non-inverted configuration and the rectangular shape of the total specimen can thus lead to stress concentration. The pressure applied covers the range from 130 MPa to 190 MPa with a 10 MPa step increase. After each cumulated stress level, transport current measurements are performed in liquid helium and in background fields of up to 9.6 T in the FReSCa test station at CERN Metallographic analyses of several samples are made at selected stress levels. Monotonic and cumulated stresses are applied and the impact of mechanical cycling is analyzed. Procedures are specifically developed to minimize surface damage during samples' preparation. The observations are compared with the electrical measurements in order to correlate the irreversible effect of the transverse pressure with the A15 damage state in the cross section. The transport current measurements of the double-stack specimen show degradation of critical current and n-value starting at respectively 170 MPa and 160 MPa cumulated loadings. However, cracks in the A15 phase are already observed in a metallographic sample subjected to 140 MPa.
Export citation and abstract BibTeX RIS

Original content from this work may be used under the terms of the Creative Commons Attribution 4.0 license. Any further distribution of this work must maintain attribution to the author(s) and the title of the work, journal citation and DOI.
1. Introduction
To reach magnetic fields that exceed the limit of Nb-Ti technology (≈9 T), the next generation of accelerator magnets relies on Nb3Sn conductor. The assembly of high field magnets requires the application of a pre-stress to the coils, via the magnet structure, to sustain the Lorentz forces and avoid movements during powering and operation. The level of pre-stress must be sufficient to maintain the coils, but it should not generate irreversible degradation of the critical current of the conductor. The understanding of the impact of the pre-stress during loading at room temperature is thus essential to define the limits during magnet assembly. In accelerator magnets, the transverse stress limit is generally fixed at about 150–180 MPa at room temperature and 150–200 MPa at cryogenic temperature [1–4].
The sensitivity of Nb3Sn conductor under transverse compressive stress at cryogenic temperature has been widely investigated in [5–20]. This loading case is representative of the operation of magnets but not of the assembly process during which the pre-compression is applied at room temperature. To study the electromechanical degradation of Nb3Sn cable-in-conduct-conductors (CICC) used in fusion reactors, metallographic observations were performed after electromechanical loadings in [9–14]. For accelerator magnets, Balachandran et al [21] performed post-mortem metallographic analysis of an 11 T dipole short model coil and of Nb3Sn stack samples, composed of ten cables, subjected to transverse pressure. Cracks were observed in the dipole coil resulting in degraded magnet performance. The authors concluded that the degradation was due to mechanical issues generated at room temperature during the assembly of the magnet. Ebermann et al [1, 2] studied the irreversible degradation of Nb3Sn Rutherford cables submitted to transverse pressure at room temperature [1, 2, 22]. The specimen is a reacted and impregnated double-stack of Rutherford cables. A cross-section and 3D representation of this type of specimen are presented figures 1 and 2. Each cable is composed of forty Restacked-Rod-Process (RRP®) wires. The strand used in [1, 2] has a diameter of 0.7 mm and is composed of 144 sub-elements in a 169 stacks structure (144/169). After the application of the load, the critical current (Ic ) of the cables is measured in liquid helium and in background fields of up to 9.6 T in the facility for the reception of superconducting cables (FReSCa) test station [23]. The same specimen is then loaded again at room temperature at higher stress levels, and the critical current is measured to evaluate the evolution of the electrical performance. The specimen is exposed to transverse loadings of 50 MPa, 100 MPa, 125 MPa, 150 MPa, 175 MPa and 200 MPa. Ebermann et al did not observe any Ic reduction for transverse pressures of up to 150 MPa. At 175 MPa, an Ic degradation of 3% was measured. The specimen was finally loaded to 200 MPa and the critical current measurement showed a degradation of 64% with respect to the non-loaded case. To evaluate the correlation between the reduction in Ic and the presence of cracks at the sub-element scale, metallographic analyses were performed on samples loaded at 150 MPa, 175 MPa and 200 MPa. Based on these observations, Ebermann et al concluded that 175 MPa is the stress level corresponding to the initiation of cracks. It should be noted that the type of loading applied, i.e. monotonic (sample subjected once to a specific load) or cumulative (sample subjected to several successive increasing loads), may have an impact on the degradation of the superconductor. The loading procedure followed by Ebermann is described as monotonic for the metallographic analysis and cumulative for transport measurements. Ebermann reports on two additional measurements performed on a double-stack of Rutherford cables [2]. The first specimen is made from two cables, each wrapped with Mica insulating tape and composed of forty RRP® 108/127 wires of 0.7 mm diameter. The second specimen is made from cables composed of forty RRP® 108/127 wires of 0.85 mm diameter. Titanium plates are added on the top and bottom of the second specimen to homogenize the stress distribution. In the first specimen, 5% degradation of critical current is measured at 170 MPa, with a small Ic increase up to 150 MPa. In the second specimen, 5% degradation of critical current is measured at 240 MPa, with a small Ic increase up to 170 MPa. No metallographic analyses were reported on these two specimens. The results from the critical current measurements suggest a maximum allowable transverse pressure, applied at room temperature on cables non reinforced with mechanical plates, in the range from 150 MPa to 170 MPa.

Figure 1. Transverse cross-section of the non-inverted double-stack specimen.
Download figure:
Standard image High-resolution image
Figure 2. 3D representation of the double-stack specimen. The 3D representation was generated using the CoCaSCOPE approach [24] and is used to visualize the specimen and does not include the sub-elements (a homogeneous region is defined).
Download figure:
Standard image High-resolution imageIn the above described studies and in the following, the Rutherford cables have a keystone angle that allows to wind a coil into an arc shape. An inverted double-stack configuration, where the thick edge of one cable faces the thin edge of the overlapping cable, has been selected for the above described studies—see figure 3(a). A non-inverted configuration, as represented figure 3(b), can serve to study the effect on a non uniform pressure distribution due, for instance, to an inhomogeneous thickness of the impregnation. Applying a transverse compression on such configuration leads to stress concentration on the conductor. Both configurations can thus help to understand the electromechanical behavior of the conductor.

Figure 3. Schematic representation of the configuration of a double-stack specimen with transverse cross-section views.
Download figure:
Standard image High-resolution imageThis work aims at evaluating the impact of the transverse pressure on a non-inverted double-stack specimen and quantifying the lowest stress level at which Ic degradation and/or cracks formation occur.
2. Specimen and experimental procedures
Two Rutherford cables developed for the 11 T high luminosity upgrade of the large Hadron collider (HL-LHC) dipoles [25, 26] are assembled in a non-inverted double-stack configuration as described section 2.1. The transverse compressive pressure applied at room temperature on this specimen is detailed in section 2.2. It covers the range from 130 MPa to 190 MPa with a 10 MPa step increase. At each step, Ic and n are measured in the FReSCa test station in liquid helium and in background magnetic fields of up to 9.6 T, as described in section 2.3. After the eight cumulative measurements, the specimen is loaded 20 times at 190 MPa, each time with an unload to 0 MPa, and measured again in FReSCa to evaluate the impact of mechanical cycles on the electrical performance.
After the electrical measurements, the part of the specimen submitted to the pressure at room temperature (area 1 in figure 4) is extracted to analyze the damage after the cumulative and cyclic loadings. The leftover part of the specimen (areas 2 and 3 in figure 4) is non-loaded, free of damage. It is used to produce samples onto which transverse compressive stress is applied separately. A metallographic analysis is performed on all these samples to correlate the microscopic observations with the electrical measurements. The extraction and definition of the samples for the metallographic are described in section 2.4.

Figure 4. Schematic layout of the long FReSCa specimen with the position of splices, voltage taps (Vtap), the loaded area and the parts from which metallographic samples are cut.
Download figure:
Standard image High-resolution image2.1. Non-inverted double stack specimen
The cross section of the double stack specimen is reported in figure 1 and a 3D representation of the impregnated specimen and the cables without impregnation are presented in figure 2. The cable was produced at CERN with a planetary Rutherford cabling machine, wrapped then reacted, and finally impregnated with CTD-101 K epoxy resin. It is composed of forty RRP® 108/127 wires, each of 0.7 mm diameter. The parameters of the cable and the wire are summarized in tables 1 and 2. The specimen has a double stack non-inverted configuration, represented in figures 2(b) and 3(b). After impregnation, it has a rectangular cross-section imposed by the impregnation mold. The final block specimen is represented in figure 2(a).
Table 1. Strand parameters.
| Parameter | Value |
|---|---|
| Architecture | RRP® 108/127 |
| Manufacturer | OST |
| Diameter | 0.7 mm |
| Sub-element size | 50 µm |
| Cu/non-Cu | 1.19 |
| Ic (4.3 K, 12 T) | 470 A |
| RRR | 280 A |
Table 2. Cable parameters.
| Parameter | Value |
|---|---|
| ID | H15OC0220B |
| Number of strands | 40 |
| Transposition pitch | 100 mm |
| Keystone | 0.808∘ |
| Mid-thickness | 1.25 mm |
| Width | 14.7 mm |
| Insulation | S-2 glass |
| C-shaped MICA | |
| 0.9 mm gap | |
| Core | 316 l |

| |
| Impregnation | CTD-101 K |
The two 1.8 m long Rutherford cables are wrapped with C-shape MICA foils, then individually covered by braided S-2 Glass and finally wrapped again with S-2 glass that holds them together (structure visible in figure 3(b)). The specimen is reacted with the following heat treatment: a ramp of  to
to  , 48 h at
  , ramp of
  to
to  , 50 h at
  and final ramp at
  to
to  held for 50 h. After reaction, it is vacuum impregnated with epoxy resin in a purpose-designed impregnation mold.
The schematic layout for the test in FReSCa of the 1.8 m long specimen is presented in figure 4. At one end, the specimen is connected to the current leads via Nb-Ti cables soldered with Sn-Ag after the heat treatment and the impregnation process. At the other end, the two cables of the specimen are soldered together via a copper strip placed between them, along 200 mm, prior to the reaction process. This joint is realized by copper diffusion bonding which occurs during the heat treatment of the specimen. Voltage taps monitor the voltage across each cable. They consist of thin copper strips placed on the cable, across the width, after the fiberglass wrapping. A length space without voltage taps, located in the middle of the specimen, is used for applying the pressure.
The dimensions of one cable in the double stack are 14.7 mm width and 1.25 mm mid-thickness. The dimensions of the double stack after insulation and impregnation are 15.7 mm width and 3.8 mm thickness. The dimensions of the cable are taken from the cabling report from CERN [27] and the dimensions of the double-stack are measured optically with a microscope after metallographic preparation as detailed in section 2.4.
The conductor, cable, heat treatment and insulation are all representative for the 11 T dipole magnets of HL-LHC.
2.2. Transverse pressure and loading cases
The transverse stress is applied using the test setup developed at CERN and described in detail in [1, 2, 22]. Picture and schematic views are reported in figures 5 and 6. The compressive load is transmitted to the stack specimen by a hydraulic press using a dedicated die 44 mm long and 17 mm wide. The specimen is allowed to expand longitudinally, along its length, and transversally, across its width. An arrangement of Polyimide films and pre-scale films are placed between the die and the sample to respectively assure a better homogeneity of the applied pressure and measure the stress distribution on the surface of the specimen. Four calibrated load cells, distributed on the pressing tool, are used to control the load. The stress evaluated from the pre-scale films is quantified to be within 12.5% of the average stress derived by the load cells [22]. The observation of the pre-scale films indicates a higher pressure in the central part of the specimen. The transverse pressure reported in the following sections is the average pressure measured by the load cells.

Figure 5. Picture of the hydraulic press together with the pressing setup and supports for the long FReSCa specimen [1].
Download figure:
Standard image High-resolution image
Figure 6. Schematic views of the pressing structure and dimensions of the setup with a double-stack specimen [1].
Download figure:
Standard image High-resolution imageThe 1.8 m long double-stack specimen used for critical current measurements is installed in the hydraulic press with dedicated supports to avoid bending. The pressure is applied at room temperature in the central area where there are not voltage taps (area 1 in figure 4). The load is maintained for 2 min as recommended for the use of pre-scale films [28]. A cumulative load, which covers the range from 130 MPa to 190 MPa with a step increase of 10 MPa, is first applied. Between each stress level, the specimen is unloaded to 0 MPa and an electrical measurement is performed as described in section 2.3. This loading sequence is followed by 20 cycles to 190 MPa with unloads at 0 MPa. The test procedure is reported in figure 7(a).

Figure 7. Loading scenarios for (a) the FReSCa specimen submitted to a cumulative loading with the electrical measurements after each unloads and (b) two samples loaded at 160 MPa one, monotonically, and the second, cumulatively after being cut from the non-loaded area of the long specimen (see section 2.4 and figure 4). The stress is the applied stress during the transverse compression and do not include thermal stress and stress due to Lorentz force.
Download figure:
Standard image High-resolution imageFor the samples cut after the electrical measurements from the non-damaged areas (areas 2 and 3 in figure 4—describe in section 2.4), the same mechanical setup is used, but the samples are duplicated and subjected to monotonic or cumulative loads. The samples subjected to monotonic loads are loaded to the target pressure and then unloaded to 0 MPa. The samples subjected to cumulative loads are loaded to the target pressure in the same way than for the area used for Ic measurements (see above). This area (area 1 in figure 4) was indeed submitted only to cumulative loading since it was loaded to increasing stress levels applied all to the same area. For both cumulative and monotonic loadings, the load is maintained for 2 min. Four stress levels are applied: 140 MPa, 160 MPa, 170 MPa and 180 MPa. The loadings for the monotonic and cumulative 160 MPa stress levels are presented in figure 7(b) as example.
2.3. Electrical measurements in the FReSCa test station
Critical current measurements of the 1.8 m long double-stack specimen are performed in the FReSCa test station at 4.3 K and in external magnetic fields Bapp from 7 T to 9.6 T. The applied field is parallel to the width and perpendicular to the thickness of the specimen. The resulting direction of the Lorentz force FL is reported in figure 8. The loaded area (area 1 in figure 4) is located in the homogeneous field region of the FReSCa test station. The specimen is not restricted in its width but to avoid movements during the test, the specimen is pre-loaded to 50 MPa via a plate, compressed onto the specimen, with bolts every 40 mm, as represented in figure 8. This measurement, performed before application of the transverse pressure at room temperature, defines the baseline performance of the specimen. It is referred to as virgin sample hereafter.

Figure 8. Schematic cross-section of the double-stack specimen in the FReSCa sample holder with the applied field Bapp , the direction of the current I and the resulting Lorentz forces FL on the specimen [1].
Download figure:
Standard image High-resolution imageThe critical current tests are done at different Bapp and with ramp rates of 300 A s−1, 200 A s−1, 100 A s−1 and 50 A s−1. For each background magnetic field, the critical current measurement is repeated at least eight times.
2.4. Metallographic samples, preparation and analysis
After the transport measurements in FReSCa, several samples are cut from three different areas of the 1.8 m long specimen to perform the metallographic analysis. The cut areas are detailed in figure 4. The cuts are done with a diamond wire saw to minimize the impact on the mechanical state of the samples. The area 1 of the specimen, represented in figure 4, is the area used during the electrical tests. This sample is located approximately in the middle of the long specimen and was exposed to the high field region in the FReSCa test station. It is cut to evaluate its damage state after being submitted to the cumulative loadings followed by 20 cycles at 190 MPa and the successive cooling-down and warming-up associated to the electrical measurements (see section 2.3). This sample is called hereafter 190 MPa cycled sample. Additionally, samples are cut from the specimen near the position of the so-called 190 MPa cycled sample, i.e. from area 2 in figure 4. The samples are analyzed to check that no damage was induced during the transport measurements campaign. These samples are used as reference samples for the rest of the study to guarantee that no damage is generated from the metallographic preparation. They are prepared together with the loaded samples and they undergo the same procedure. Representative observations of the reference samples are presented figure 9. The leftover length of the specimen (area 3 in figure 4) is cut in seven 60 mm long samples without voltage tap. These samples were loaded to the target pressure with monotonic or cumulative loadings following the description in section 2.2 and are used to compare the metallographic analysis with the electrical measurements in section 3.2.

Figure 9. SEM observations of the reference sample: (a) representative strand in the cable with (b) enlarged view on the sub-elements. (c) strand located at the edge of the cable—the kink—see figure 1. No cracks are observed in the reference samples.
Download figure:
Standard image High-resolution imageThe samples were embedded in circular shape epoxy resin to protect them during metallographic preparation. The impregnation was performed at room temperature. The samples were mechanically grinded with SiC pads with decreasing grit sizes of P320, P600 and P1200. They were then polished with water-based diamond solutions of decreasing particle sizes of 9 µm, 3 µm and 1 µm. The grinding and polishing steps were performed using an automatic polishing machine with a load on the sample of 10 N for the grinding and 0.5 N for the polishing steps. A final vibro-polishing step was performed during 6 h with a colloidal silica suspension of 0.02 µm particle size. Between each step, the samples were gently cleaned with metallographic soap on a soft cloth and dried.
Transverse and longitudinal cross sections were analyzed. Figure 10 defines the different polishing planes used to analyze the damage state of the samples. The transverse cross-section (plane X–Y in figure 10) gives polished sample as represented in figure 10(b). It allows to have an overview of the complete specimen and to look for any damage in the cross-section. Two longitudinal polishing directions are used—side and top. The side longitudinal direction (plane Y–Z in figure 10), gives polished sample as represented in figure 10(d). It allows to observe the strands located at the edge of the cable, the kink (see figure 1), which are heavily deformed from the cabling process. The top longitudinal cross-section (plane X–Z in figure 10), gives polished sample as represented in figure 10(c). It allows to observe a large area of the sample and to identify transversal cracks in a sub-element. These types of cracks, presented in figure 11, can cut transversally the sub-elements across the entire A15 phase, preventing the current to flow. They were observed in strands loaded with bending and reported to be the main source of degradation in the CICC in [9–14].

Figure 10. Definition of the polishing planes used for the metallographic analysis of the samples. (a) 3D representation of the two cables with the polishing planes. The plane X–Y define the transverse cross-section (b), the plane X–Z the top longitudinal cross section (c) and the plane Y–Z the side longitudinal cross-section (d).
Download figure:
Standard image High-resolution image
Figure 11. Longitudinal cross-section of a RRP strand bent to 1.5% strain at 77 K. Transverse cracks can be observed in the sub-elements in the fraction of cross section under tension [9]. Permission under GNU Free documentation license version 1.2.
Download figure:
Standard image High-resolution imageFor each sample, the analysis was performed with an optical microscope Olympus BX51. A Zeiss EVO10 scanning electron microscope (SEM) was used to perform observations of the samples subjected to 140 MPa cumulated stress, 160 MPa monotonic stress and 190 MPa cycled stresses. The analysis of the observations was performed using FIJI-ImageJ [29] and manual analysis.
An overview of the damage state and an evaluation of the pattern and distribution of cracks are summarized in one figure for each analyzed sample in figure 15. The authors chose to represent the damage state by coloring the identified cracked sub-elements with a color indicating the number of cracks identified via optical microscopy. The color scheme adopted is the following: yellow for sub-elements with one crack, orange for sub-elements with two cracks, red for sub-elements with three cracks, and finally dark red when four or more cracks appear. This representation report on the frequency and not on the size of the cracks. Observations and analysis are discussed in section 3.2.
3. Results
3.1. Electrical measurements
Representative V–I curves of the critical current measurements in a background field of 7.5 T after application of the 140 MPa and 190 MPa cumulative stress levels are presented in figure 12. The evaluation of the critical current (Ic
) and the n-value (n) is done with the electrical field (E) criterion of  . The data are treated with a moving average window smoothing. The non-linear fitting takes into account the offset (E0) of the measurement, the residual resistive slope (
 ) and the power law (
 ) according to:
where E is the electrical field across the sample and I is the transferred current.

Figure 12. V–I measurements on the two cables of the double-stack specimen after application of a transverse stress of 140 MPa and 190 MPa. Data as measured, no filters or corrections are applied.
Download figure:
Standard image High-resolution imageFigure 13 reports the results of the Ic measurements after application of the successive stress levels. In figure 13(a), the critical current of the two cables is plotted for background magnetic fields of 7 T and 9.6 T. We can observe an increase of the critical current until 140 MPa and then a decrease for increasing stress levels. The increase (up to ≈5%) is due to a change in the strain state of Nb3Sn. The superconducting phase is in a compressive state after the heat treatment. The application of a load on the specimen induces a release of the strain with a consequent Ic increase [30]. In figure 13(b), we can observe the Ic field dependence of one of the two cable at different stress levels. The self-field contribution of the cable is taken into account in the analysis: a self-field value corresponding to 79 mT kA−1, calculated via a finite element simulation, is added to the applied background field (Bbackground) to obtain the total magnetic field (Btotal) in the cable. The measured critical currents of the cable are compared with the values derived from the single wire measurements [31]. These calculated values represent an upper and a lower Ic boundary. The values are estimated using the established formula [31]:
with the number of wire  ,
,  , the lower boundary
  and the upper boundary
  .
.

Figure 13. Critical current Ic as a function of (a) the applied stress σ for the two cables in the double-stack specimen and (b) the total magnetic field Btotal for a single cable in the double-stack specimen for the different stress levels.
Download figure:
Standard image High-resolution imageFor the specimen before loading and for cumulative loading up to 170 MPa, the critical current is found to be in the expected range. After application of 180 MPa, the critical current is below the expected value from single wire measurement.
Figure 14 presents for each of the two cables the evolution of the critical current, normalized to the critical current of the virgin sample (figure 14(a)), and of the n-value (figure 14(b)) for the applied cumulative stresses and in background fields of 7 T and 9.6 T. At 140 MPa, the critical current reaches a maximum and the n-value does not change. From 140 MPa to 170 MPa, the critical current decreases but is still above the virgin value. The n-value starts decreasing for stresses higher than 160 MPa. After application of 180 MPa, the critical current is lower than the virgin sample by 2% and than its maximum value by 6%. After application of 190 MPa, the critical current is lower than the virgin sample by 6% and than its maximum by 10%. The n-value also decreases from about 90 to less than 50. After mechanical cycling, Ic further degrades: a degradation of 16% from the virgin sample has been measured, with no significant change of the n-value.

Figure 14. Transport properties after application of the different transverse stress levels of the two Rutherford cables (cable 1 and cable 2) in the double-stack specimen at the minimum and maximum background magnetic fields.
Download figure:
Standard image High-resolution image3.2. Metallographic analysis
Figure 15 presents the analysis of the crack distribution of the metallographic samples loaded at 140 MPa, 160 MPa and 170 MPa and the 190 MPa cycled sample accordingly to the stress scenarios presented in section 2.2. Cracks are already visible at a pressure of 140 MPa, as visible in figure 15(a). The monotonic loading generates a crack density lower than the cumulated one. Damage is localized mainly in the middle of the cable and the thin edge is less damaged than the thick one. This observation is in line with what is measured by the pre-scale film used during the transverse compression, as discussed in section 2.2, and is attributed to the non-inverted configuration. The non-inverted configuration implies a thickness of impregnation higher at the thin edge and a stress concentration higher at the thick edge.

Figure 15. Representation of the crack distribution of the metallographic samples loaded at different stress scenarios as presented in section 2.2.
Download figure:
Standard image High-resolution imageFor the 160 MPa, 170 MPa, 180 MPa and 190 MPa cycled samples, cracks in the sub-elements are mainly localized, in the transverse cross-section, in planes oriented 45∘ with respect to the loading direction, as visible on the analysis in figure 15. The X-shaped damaged area is represented figure 16 by the red line on single strands with random hexagonal orientation. It was already observed in strands transversally loaded in [2, 18, 32]. The sub-elements are twisted and arranged following a hexagonal pattern in a strand. It is thus important to note that the 45∘ planes in which the damaged sub-elements are concentrated do not seems to be impacted by the orientation of the hexagonal structure as represented figure 16. As visible in figure 15 for the different stress levels, the X-shaped area is always oriented the same for all the strands, which have different orientation of hexagonal pattern. This area can be divided into four affected zones, represented in figure 16. In strands with approximately 1 to 10 sub-elements affected, cracks are localized in zone A, B and C. As the crack density increases, zone C seems more affected. In heavily damaged strands, cracks are observed in zone D with a localized high crack density in zone C and D compared to surrounding sub-elements. At the sub-element scale, most of the cracks are oriented parallel or with a small angle to the transverse loading direction. This direction corresponds to the Y-direction of the double-stack in the present configuration. Cracks oriented in the X-direction, also called horizontal cracks, were observed in severely damaged strands and localized in zone C.

Figure 16. Schematic map of the X-shaped damaged area in strands with different hexagonal orientation. This area was observed in strands loaded with cumulated and monotonic loadings at 160 MPa, 170 MPa and 190 MPa stress levels and is oriented 45∘ with respect to the loading direction.
Download figure:
Standard image High-resolution imageFigure 17 presents representative observations of cracked sub-elements in the 190 MPa cycled sample (area 1 in figure 4). At the sub-element scale, cracks are mainly oriented radially as in figure 17(a). Cracks oriented in the Y-direction, i.e. parallel cracks, not radial and visible in transverse cross-section, were also observed as shown figure 17(b). In the longitudinal cross-section, few cracks were observed in the strands located at the edge of the cable—called kink, see figure 1. They are mainly oriented in the longitudinal direction of the sub-element, named longitudinal cracks in figure 17(c) and in [1, 2], or straight cracks in [21]. Other cracks oriented with wave shape around the porosity in the core of the sub-elements are also visible, named wavy cracks in figure 17(c) and in [21]. Among the dozens of samples analyzed, only one sub-element showed a crack across the entire A15 phase, named transverse cracks in enlarged view of figure 17(c). On the other hand, several longitudinal cracks were identified in strands not located at the edge of the cable, as shown in figure 17(d). These cracks, up to about 0.1 mm to 0.2 mm long and largely opened as shown in figures 17(d) and (e), are propagating from the core of the sub-element to its external surface. These cracks can thus prevent the flow of the current since they cut radially the sub-element.
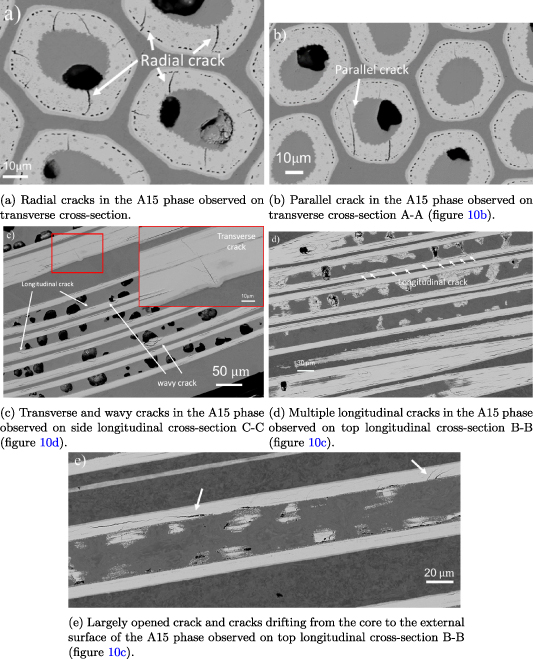
Figure 17. Representative SEM observations of cracked sub-elements of 190 MPa cycled sample extracted from area 1 (see figure 4). This sample underwent the full series of loading (figure 7(a)) and electrical measurements.
Download figure:
Standard image High-resolution imageFor stress levels equal or higher than the 160 MPa level, cracks seem to initiate from porosities in the core of the sub-element or from the phase's interfaces (Nb/Nb3Sn and Nb3Sn/Cu-Sn core), as shown in figure 18 for the 160 MPa cumulated sample and in figures 17(a) and (b) for the 190 MPa cycled sample. The observed cracks do not seem to initiate in the restack porosities. No cracks were observed in the unreacted Nb barrier. At a stress level of 140 MPa, all cracks observed initiated from the core (Nb3Sn/Cu-Sn core or Nb3Sn/porosity).

Figure 18. Cracks in sub-elements of the 160 MPa cumulated sample.
Download figure:
Standard image High-resolution image
4. Discussion
Transport measurements on the non-inverted double-stack specimen subjected to cumulated loads show an increase of Ic until 140 MPa, where the maximum critical current is achieved. This increase of Ic is expected to be caused by release of internal strain [30]. From 140 MPa and 170 MPa, the Ic decreases but it remains above the value measured for the virgin sample. The critical current starts to decrease below the value of the virgin sample between 160 MPa and 170 MPa. The n-value stays unchanged until 160 MPa and decreases between 160 MPa and 170 MPa. The metallographic analysis clearly shows the presence of a significant number of cracks in the 160 MPa cumulated sample. On the total specimen, 91% of the strand exhibits at least one damaged sub-element and 15% of the sub-element exhibits at least one crack. The density of cracks observed at this stress level leads to the conclusion that mechanical damage in the sub-elements appears before 160 MPa and thus before detection of Ic degradation via electrical measurements. Even at the 140 MPa cumulated stress level, corresponding to the maximum critical current measured in the specimen, some cracks are already observed in the metallographic sample. On the total specimen, 36% of the strand exhibits at least one damaged sub-element and 0.6% of the sub-element exhibits at least one crack. In the tested specimen, these cracks do not affect the transport properties, however they do affect the mechanical integrity of the A15 phase of the concerned sub-elements. To the knowledge of the authors, this phenomenology has never been reported on stacks of Rutherford cables. In previous work and in this study, it was observed that cracks can propagate from the core of the sub-element to their surface, see figures 17(d), (e) and [1, 2]. Such evolution can locally interrupt the transport of the current and lead to redistribution in surrounding sub-elements through the copper matrix. It is important to note that the specimen is thermally cycles for the electrical measurements from room temperature to 4.2 K. The metallographic samples submitted to a cumulative loading were not cooled between each stress level. Cracks were however observed in the sample subjected to 140 MPa cumulated stress whereas the electrical measurements did not show any degradation with the thermal cycles at this level.
Metallographic analysis clearly show a difference in the severity of the damage between monotonic and cumulated loadings. One factor that could have a major impact in this difference is the accumulation of plastic strain in the copper matrix, also known as ratcheting effect. Such behavior is observed in Nb3Sn conductor loaded with non-monotonic loadings [33, 34]. At each loading, copper accumulates plastic strain and the complex structure of the conductor can lead to localization of stress at the sub-element scale and generation of cracks in the A15 phase. The thermo-mechanical cyclic loading experienced by the cables during the magnet lifetime could promote propagation of radial cracks not detected with transport measurements. The behavior of Rutherford cable conductors under such loading should be further investigated.
The stress distribution in this study is affected by the non-inverted configuration selected for the double-stack that can lead to over damage the sample. However, an uneven distribution of the load was also observed in inverted stacks because of irregularities in the geometry and the presence of Mica in the sample can also affect the stress distribution [35].
As presented in section 2.2, the boundary conditions adopted for applying the transverse compressive stresses allow the specimen to expand longitudinally in the direction of the stack and transversally across the cable width. The strain state in the stack could thus be larger and the stress smaller than with boundary conditions where the specimen cannot expand. The loading conditions used in this study is thus not fully representative of the conditions in the magnet. In [21], Balachandran et al compared the orientation and the pattern of cracks in an 11 T dipole short model coil from a magnet with degraded performance with a Nb3Sn 10-stack sample on which transverse compressive load was applied. The metallographic analyses showed varying crack orientations for the dipole coil and cracks oriented along principal planes and in principal directions in the 10-stack sample. It was concluded that the 11 T dipole coils have been in a multi-axial stress state. These results indicate that a transversally loaded specimen at the stack scale is not sufficient to understand the damage phenomenon occurring at the coil scale. The understanding of the phenomenology related to the damage and degradation of Nb3Sn Rutherford cables requires a broader investigation. This work is thus a first step and can contribute to develop a global strategy. It can be completed by the study of different configurations of stacks submitted to elementary and known loadings and boundary conditions such as transverse stress applied on the thickness of the specimen, bending, torsion.
5. Summary and conclusions
Based on the work of [1, 2, 21] and inspired by the micrographic analysis work done on the conductors used in magnets for fusion reactor [9–14], we developed a procedure to study the impact of the transverse pressure on stacks made of two Rutherford cables and to correlate Ic degradation with cracks formation in the A15 phase.
The procedure was applied to a non-inverted double-stack specimen loaded at different stress levels. The specimen was free to expand longitudinally and across the width. Mechanical damage, visible via cracks in the sub-elements, was observed before a degradation of the critical current could be measured. At a cumulated load of 140 MPa, the specimen showed its maximum critical current, but cracks could already be observed via microscopic analysis of transverse cross-sections. The electrical measurements gave therefore macroscopic useful information on the transport properties of the sample but they did not represent the damage state in the A15 phase. Micro-cracks, indicating the on-set of a mechanical degradation in the sub-elements, are present when transport measurements do not indicate yet any degradation in critical current.
The study of the density of cracks generated by monotonic and cumulated loads shows the critical effect of a cyclic loading. It is thus necessary to evaluate if cracks that appear at low pressure, without macroscopic impact on transport properties, could lead to a degradation of the electrical performance after exposure to a cyclic thermo-mechanical loading.
The double-stack configuration is a simplified geometry that enables studying the damage phenomenology in Nb3Sn Rutherford cables. We adopted it for the study of transverse pressure applied to the wide face of the cables, but other types of mechanical loadings such as tension, bending and transverse compression perpendicular to the width and thickness of the stack could also be studied. The procedure developed in this paper can thus be used under different experimental conditions and can be applied for systematic and statistical studies aiming at evaluating the performance and the limits of superconductors.
Acknowledgments
The authors would like to thank G Peiro for the support during the transport measurements in the FReSCa test station, F Wolf for applying the transverse pressure on the double-stack and F Nunio for providing the 3D representation of the stack using the CoCaSCOPE—Mesh Generator.
Data availability statement
All data that support the findings of this study are included within the article (and any supplementary files).